Free Statistics

of Irreproducible Research!

Author's title

Author*The author of this computation has been verified*
R Software Modulerwasp_autocorrelation.wasp
Title produced by software(Partial) Autocorrelation Function
Date of computationSun, 17 Dec 2017 22:55:14 +0100
Cite this page as followsStatistical Computations at FreeStatistics.org, Office for Research Development and Education, URL https://freestatistics.org/blog/index.php?v=date/2017/Dec/17/t1513547763s1ofyfz9oytpn5i.htm/, Retrieved Wed, 15 May 2024 04:41:10 +0000
Statistical Computations at FreeStatistics.org, Office for Research Development and Education, URL https://freestatistics.org/blog/index.php?pk=310080, Retrieved Wed, 15 May 2024 04:41:10 +0000
QR Codes:

Original text written by user:
IsPrivate?No (this computation is public)
User-defined keywords
Estimated Impact49
Family? (F = Feedback message, R = changed R code, M = changed R Module, P = changed Parameters, D = changed Data)
-       [(Partial) Autocorrelation Function] [Datareeks 3.1 - (...] [2017-12-17 21:55:14] [228f385b091a4ec8014a0b8722ae7714] [Current]
Feedback Forum

Post a new message
Dataseries X:
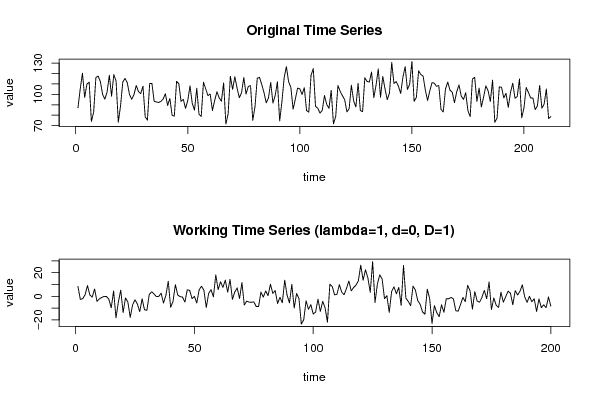
87.1
105
120.3
97
109.9
111.7
74
82.8
116.1
117.6
112.2
100
95.4
102.3
118.3
98.2
119
112.8
73.3
89
111.8
115.4
111.2
99.9
95.2
99.8
108.5
102.7
100.7
107.9
78.5
75.3
110.4
110.5
93.4
92.7
92.2
93.3
95.5
100.6
89.3
96
80
79.1
112.4
110.2
93.3
95.3
86.5
94.1
108.2
91.3
84.9
105.9
81
78.8
111.7
105.3
98.8
100.3
84.5
94.1
102.5
96.8
93.4
111
71.5
81.2
117.3
104.8
116.9
105.9
96.8
101.6
116.2
100.3
107.7
108.4
75.1
88.3
115.4
116.4
109.5
101.8
91.9
96.5
111.5
91.7
99
112
74.4
92.8
115.9
126.6
112
106.6
85.8
95.6
106
105.3
100
106.4
84.5
82.9
118.3
124.8
88.5
86.7
82
84.6
98.9
90.3
86.6
103.9
71.7
78.7
108.5
102.9
98.7
95
83.2
86.3
108.8
93.8
87.9
110.6
84.6
83.3
115.9
112.4
111.8
121.4
96.8
108.7
124.4
97.2
117.3
105.3
94.9
101.4
130.6
110.4
112.3
107.8
100.9
116.7
126.5
104.7
109.6
131.5
93.3
97.1
122.6
119
117.5
104.1
94.1
103.5
111.3
110.7
107.7
108.5
85.4
83.2
105.4
111.8
104
102.1
92
102.5
109.1
98.5
95.1
101.6
84.4
78.7
114.7
116.4
93.2
106
87.9
97.5
108.2
103.5
93.1
113.7
73.2
77.3
107.1
106.9
96.6
101
87.5
101.8
110.8
96.3
97.9
114.8
77.4
87
106.6
101.8
96.6
96.4
85.4
88.9
108.6
86.7
90.7
105.1
76.8
78.7


Summary of computational transaction
Raw Input view raw input (R code)
Raw Outputview raw output of R engine
Computing time2 seconds
R ServerBig Analytics Cloud Computing Center

\begin{tabular}{lllllllll}
\hline
Summary of computational transaction \tabularnewline
Raw Input view raw input (R code)  \tabularnewline
Raw Outputview raw output of R engine  \tabularnewline
Computing time2 seconds \tabularnewline
R ServerBig Analytics Cloud Computing Center \tabularnewline
\hline
\end{tabular}
%Source: https://freestatistics.org/blog/index.php?pk=310080&T=0

[TABLE]
[ROW]
Summary of computational transaction[/C][/ROW] [ROW]Raw Input[/C] view raw input (R code) [/C][/ROW] [ROW]Raw Output[/C]view raw output of R engine [/C][/ROW] [ROW]Computing time[/C]2 seconds[/C][/ROW] [ROW]R Server[/C]Big Analytics Cloud Computing Center[/C][/ROW] [/TABLE] Source: https://freestatistics.org/blog/index.php?pk=310080&T=0

Globally Unique Identifier (entire table): ba.freestatistics.org/blog/index.php?pk=310080&T=0

As an alternative you can also use a QR Code:  

The GUIDs for individual cells are displayed in the table below:

Summary of computational transaction
Raw Input view raw input (R code)
Raw Outputview raw output of R engine
Computing time2 seconds
R ServerBig Analytics Cloud Computing Center


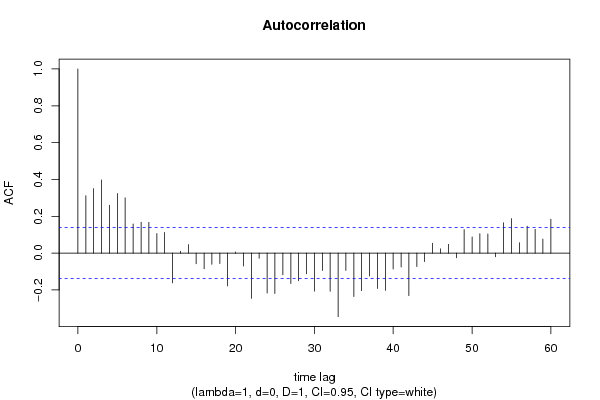
Autocorrelation Function
Time lag kACF(k)T-STATP-value
10.3111794.40079e-06
20.350374.9551e-06
30.3970735.61550
40.2598393.67470.000153
50.3233964.57354e-06
60.2999574.2421.7e-05
70.1577762.23130.013386
80.1674022.36740.009434
90.1668122.35910.009642
100.1060651.50.067598
110.1123911.58950.056769
12-0.1615-2.2840.011712
130.0097610.1380.445171
140.0462590.65420.256867
15-0.058074-0.82130.206229
16-0.08532-1.20660.114503
17-0.060824-0.86020.195358
18-0.05643-0.7980.212896
19-0.177874-2.51550.006336
200.0064820.09170.463524
21-0.070311-0.99440.160626
22-0.245708-3.47480.000313
23-0.027881-0.39430.346889
24-0.216436-3.06090.001255
25-0.219547-3.10490.00109
26-0.117128-1.65640.0496
27-0.16483-2.3310.010373
28-0.149771-2.11810.017701
29-0.112543-1.59160.056528
30-0.206417-2.91920.001956
31-0.094279-1.33330.091974
32-0.207402-2.93310.001874
33-0.345017-4.87931e-06
34-0.093795-1.32650.0931
35-0.235575-3.33150.000514
36-0.203693-2.88070.002201
37-0.124531-1.76110.039872
38-0.192194-2.7180.003572
39-0.202314-2.86120.002335
40-0.086573-1.22430.111135
41-0.075674-1.07020.142912
42-0.23072-3.26290.000648
43-0.073203-1.03530.150901
44-0.046086-0.65180.257653
450.0534030.75520.225498
460.0232020.32810.371581
470.047670.67420.250496
48-0.025724-0.36380.358201
490.1277291.80640.036183
500.087741.24080.10806
510.1047321.48110.070073
520.1042111.47380.071058
53-0.020103-0.28430.388235
540.1647452.32980.010406
550.1874712.65120.004331
560.0559190.79080.214997
570.1458312.06240.020233
580.1290181.82460.034778
590.076031.07520.141783
600.183562.59590.005067

\begin{tabular}{lllllllll}
\hline
Autocorrelation Function \tabularnewline
Time lag k & ACF(k) & T-STAT & P-value \tabularnewline
1 & 0.311179 & 4.4007 & 9e-06 \tabularnewline
2 & 0.35037 & 4.955 & 1e-06 \tabularnewline
3 & 0.397073 & 5.6155 & 0 \tabularnewline
4 & 0.259839 & 3.6747 & 0.000153 \tabularnewline
5 & 0.323396 & 4.5735 & 4e-06 \tabularnewline
6 & 0.299957 & 4.242 & 1.7e-05 \tabularnewline
7 & 0.157776 & 2.2313 & 0.013386 \tabularnewline
8 & 0.167402 & 2.3674 & 0.009434 \tabularnewline
9 & 0.166812 & 2.3591 & 0.009642 \tabularnewline
10 & 0.106065 & 1.5 & 0.067598 \tabularnewline
11 & 0.112391 & 1.5895 & 0.056769 \tabularnewline
12 & -0.1615 & -2.284 & 0.011712 \tabularnewline
13 & 0.009761 & 0.138 & 0.445171 \tabularnewline
14 & 0.046259 & 0.6542 & 0.256867 \tabularnewline
15 & -0.058074 & -0.8213 & 0.206229 \tabularnewline
16 & -0.08532 & -1.2066 & 0.114503 \tabularnewline
17 & -0.060824 & -0.8602 & 0.195358 \tabularnewline
18 & -0.05643 & -0.798 & 0.212896 \tabularnewline
19 & -0.177874 & -2.5155 & 0.006336 \tabularnewline
20 & 0.006482 & 0.0917 & 0.463524 \tabularnewline
21 & -0.070311 & -0.9944 & 0.160626 \tabularnewline
22 & -0.245708 & -3.4748 & 0.000313 \tabularnewline
23 & -0.027881 & -0.3943 & 0.346889 \tabularnewline
24 & -0.216436 & -3.0609 & 0.001255 \tabularnewline
25 & -0.219547 & -3.1049 & 0.00109 \tabularnewline
26 & -0.117128 & -1.6564 & 0.0496 \tabularnewline
27 & -0.16483 & -2.331 & 0.010373 \tabularnewline
28 & -0.149771 & -2.1181 & 0.017701 \tabularnewline
29 & -0.112543 & -1.5916 & 0.056528 \tabularnewline
30 & -0.206417 & -2.9192 & 0.001956 \tabularnewline
31 & -0.094279 & -1.3333 & 0.091974 \tabularnewline
32 & -0.207402 & -2.9331 & 0.001874 \tabularnewline
33 & -0.345017 & -4.8793 & 1e-06 \tabularnewline
34 & -0.093795 & -1.3265 & 0.0931 \tabularnewline
35 & -0.235575 & -3.3315 & 0.000514 \tabularnewline
36 & -0.203693 & -2.8807 & 0.002201 \tabularnewline
37 & -0.124531 & -1.7611 & 0.039872 \tabularnewline
38 & -0.192194 & -2.718 & 0.003572 \tabularnewline
39 & -0.202314 & -2.8612 & 0.002335 \tabularnewline
40 & -0.086573 & -1.2243 & 0.111135 \tabularnewline
41 & -0.075674 & -1.0702 & 0.142912 \tabularnewline
42 & -0.23072 & -3.2629 & 0.000648 \tabularnewline
43 & -0.073203 & -1.0353 & 0.150901 \tabularnewline
44 & -0.046086 & -0.6518 & 0.257653 \tabularnewline
45 & 0.053403 & 0.7552 & 0.225498 \tabularnewline
46 & 0.023202 & 0.3281 & 0.371581 \tabularnewline
47 & 0.04767 & 0.6742 & 0.250496 \tabularnewline
48 & -0.025724 & -0.3638 & 0.358201 \tabularnewline
49 & 0.127729 & 1.8064 & 0.036183 \tabularnewline
50 & 0.08774 & 1.2408 & 0.10806 \tabularnewline
51 & 0.104732 & 1.4811 & 0.070073 \tabularnewline
52 & 0.104211 & 1.4738 & 0.071058 \tabularnewline
53 & -0.020103 & -0.2843 & 0.388235 \tabularnewline
54 & 0.164745 & 2.3298 & 0.010406 \tabularnewline
55 & 0.187471 & 2.6512 & 0.004331 \tabularnewline
56 & 0.055919 & 0.7908 & 0.214997 \tabularnewline
57 & 0.145831 & 2.0624 & 0.020233 \tabularnewline
58 & 0.129018 & 1.8246 & 0.034778 \tabularnewline
59 & 0.07603 & 1.0752 & 0.141783 \tabularnewline
60 & 0.18356 & 2.5959 & 0.005067 \tabularnewline
\hline
\end{tabular}
%Source: https://freestatistics.org/blog/index.php?pk=310080&T=1

[TABLE]
[ROW][C]Autocorrelation Function[/C][/ROW]
[ROW][C]Time lag k[/C][C]ACF(k)[/C][C]T-STAT[/C][C]P-value[/C][/ROW]
[ROW][C]1[/C][C]0.311179[/C][C]4.4007[/C][C]9e-06[/C][/ROW]
[ROW][C]2[/C][C]0.35037[/C][C]4.955[/C][C]1e-06[/C][/ROW]
[ROW][C]3[/C][C]0.397073[/C][C]5.6155[/C][C]0[/C][/ROW]
[ROW][C]4[/C][C]0.259839[/C][C]3.6747[/C][C]0.000153[/C][/ROW]
[ROW][C]5[/C][C]0.323396[/C][C]4.5735[/C][C]4e-06[/C][/ROW]
[ROW][C]6[/C][C]0.299957[/C][C]4.242[/C][C]1.7e-05[/C][/ROW]
[ROW][C]7[/C][C]0.157776[/C][C]2.2313[/C][C]0.013386[/C][/ROW]
[ROW][C]8[/C][C]0.167402[/C][C]2.3674[/C][C]0.009434[/C][/ROW]
[ROW][C]9[/C][C]0.166812[/C][C]2.3591[/C][C]0.009642[/C][/ROW]
[ROW][C]10[/C][C]0.106065[/C][C]1.5[/C][C]0.067598[/C][/ROW]
[ROW][C]11[/C][C]0.112391[/C][C]1.5895[/C][C]0.056769[/C][/ROW]
[ROW][C]12[/C][C]-0.1615[/C][C]-2.284[/C][C]0.011712[/C][/ROW]
[ROW][C]13[/C][C]0.009761[/C][C]0.138[/C][C]0.445171[/C][/ROW]
[ROW][C]14[/C][C]0.046259[/C][C]0.6542[/C][C]0.256867[/C][/ROW]
[ROW][C]15[/C][C]-0.058074[/C][C]-0.8213[/C][C]0.206229[/C][/ROW]
[ROW][C]16[/C][C]-0.08532[/C][C]-1.2066[/C][C]0.114503[/C][/ROW]
[ROW][C]17[/C][C]-0.060824[/C][C]-0.8602[/C][C]0.195358[/C][/ROW]
[ROW][C]18[/C][C]-0.05643[/C][C]-0.798[/C][C]0.212896[/C][/ROW]
[ROW][C]19[/C][C]-0.177874[/C][C]-2.5155[/C][C]0.006336[/C][/ROW]
[ROW][C]20[/C][C]0.006482[/C][C]0.0917[/C][C]0.463524[/C][/ROW]
[ROW][C]21[/C][C]-0.070311[/C][C]-0.9944[/C][C]0.160626[/C][/ROW]
[ROW][C]22[/C][C]-0.245708[/C][C]-3.4748[/C][C]0.000313[/C][/ROW]
[ROW][C]23[/C][C]-0.027881[/C][C]-0.3943[/C][C]0.346889[/C][/ROW]
[ROW][C]24[/C][C]-0.216436[/C][C]-3.0609[/C][C]0.001255[/C][/ROW]
[ROW][C]25[/C][C]-0.219547[/C][C]-3.1049[/C][C]0.00109[/C][/ROW]
[ROW][C]26[/C][C]-0.117128[/C][C]-1.6564[/C][C]0.0496[/C][/ROW]
[ROW][C]27[/C][C]-0.16483[/C][C]-2.331[/C][C]0.010373[/C][/ROW]
[ROW][C]28[/C][C]-0.149771[/C][C]-2.1181[/C][C]0.017701[/C][/ROW]
[ROW][C]29[/C][C]-0.112543[/C][C]-1.5916[/C][C]0.056528[/C][/ROW]
[ROW][C]30[/C][C]-0.206417[/C][C]-2.9192[/C][C]0.001956[/C][/ROW]
[ROW][C]31[/C][C]-0.094279[/C][C]-1.3333[/C][C]0.091974[/C][/ROW]
[ROW][C]32[/C][C]-0.207402[/C][C]-2.9331[/C][C]0.001874[/C][/ROW]
[ROW][C]33[/C][C]-0.345017[/C][C]-4.8793[/C][C]1e-06[/C][/ROW]
[ROW][C]34[/C][C]-0.093795[/C][C]-1.3265[/C][C]0.0931[/C][/ROW]
[ROW][C]35[/C][C]-0.235575[/C][C]-3.3315[/C][C]0.000514[/C][/ROW]
[ROW][C]36[/C][C]-0.203693[/C][C]-2.8807[/C][C]0.002201[/C][/ROW]
[ROW][C]37[/C][C]-0.124531[/C][C]-1.7611[/C][C]0.039872[/C][/ROW]
[ROW][C]38[/C][C]-0.192194[/C][C]-2.718[/C][C]0.003572[/C][/ROW]
[ROW][C]39[/C][C]-0.202314[/C][C]-2.8612[/C][C]0.002335[/C][/ROW]
[ROW][C]40[/C][C]-0.086573[/C][C]-1.2243[/C][C]0.111135[/C][/ROW]
[ROW][C]41[/C][C]-0.075674[/C][C]-1.0702[/C][C]0.142912[/C][/ROW]
[ROW][C]42[/C][C]-0.23072[/C][C]-3.2629[/C][C]0.000648[/C][/ROW]
[ROW][C]43[/C][C]-0.073203[/C][C]-1.0353[/C][C]0.150901[/C][/ROW]
[ROW][C]44[/C][C]-0.046086[/C][C]-0.6518[/C][C]0.257653[/C][/ROW]
[ROW][C]45[/C][C]0.053403[/C][C]0.7552[/C][C]0.225498[/C][/ROW]
[ROW][C]46[/C][C]0.023202[/C][C]0.3281[/C][C]0.371581[/C][/ROW]
[ROW][C]47[/C][C]0.04767[/C][C]0.6742[/C][C]0.250496[/C][/ROW]
[ROW][C]48[/C][C]-0.025724[/C][C]-0.3638[/C][C]0.358201[/C][/ROW]
[ROW][C]49[/C][C]0.127729[/C][C]1.8064[/C][C]0.036183[/C][/ROW]
[ROW][C]50[/C][C]0.08774[/C][C]1.2408[/C][C]0.10806[/C][/ROW]
[ROW][C]51[/C][C]0.104732[/C][C]1.4811[/C][C]0.070073[/C][/ROW]
[ROW][C]52[/C][C]0.104211[/C][C]1.4738[/C][C]0.071058[/C][/ROW]
[ROW][C]53[/C][C]-0.020103[/C][C]-0.2843[/C][C]0.388235[/C][/ROW]
[ROW][C]54[/C][C]0.164745[/C][C]2.3298[/C][C]0.010406[/C][/ROW]
[ROW][C]55[/C][C]0.187471[/C][C]2.6512[/C][C]0.004331[/C][/ROW]
[ROW][C]56[/C][C]0.055919[/C][C]0.7908[/C][C]0.214997[/C][/ROW]
[ROW][C]57[/C][C]0.145831[/C][C]2.0624[/C][C]0.020233[/C][/ROW]
[ROW][C]58[/C][C]0.129018[/C][C]1.8246[/C][C]0.034778[/C][/ROW]
[ROW][C]59[/C][C]0.07603[/C][C]1.0752[/C][C]0.141783[/C][/ROW]
[ROW][C]60[/C][C]0.18356[/C][C]2.5959[/C][C]0.005067[/C][/ROW]
[/TABLE]
Source: https://freestatistics.org/blog/index.php?pk=310080&T=1

Globally Unique Identifier (entire table): ba.freestatistics.org/blog/index.php?pk=310080&T=1

As an alternative you can also use a QR Code:  

The GUIDs for individual cells are displayed in the table below:

Autocorrelation Function
Time lag kACF(k)T-STATP-value
10.3111794.40079e-06
20.350374.9551e-06
30.3970735.61550
40.2598393.67470.000153
50.3233964.57354e-06
60.2999574.2421.7e-05
70.1577762.23130.013386
80.1674022.36740.009434
90.1668122.35910.009642
100.1060651.50.067598
110.1123911.58950.056769
12-0.1615-2.2840.011712
130.0097610.1380.445171
140.0462590.65420.256867
15-0.058074-0.82130.206229
16-0.08532-1.20660.114503
17-0.060824-0.86020.195358
18-0.05643-0.7980.212896
19-0.177874-2.51550.006336
200.0064820.09170.463524
21-0.070311-0.99440.160626
22-0.245708-3.47480.000313
23-0.027881-0.39430.346889
24-0.216436-3.06090.001255
25-0.219547-3.10490.00109
26-0.117128-1.65640.0496
27-0.16483-2.3310.010373
28-0.149771-2.11810.017701
29-0.112543-1.59160.056528
30-0.206417-2.91920.001956
31-0.094279-1.33330.091974
32-0.207402-2.93310.001874
33-0.345017-4.87931e-06
34-0.093795-1.32650.0931
35-0.235575-3.33150.000514
36-0.203693-2.88070.002201
37-0.124531-1.76110.039872
38-0.192194-2.7180.003572
39-0.202314-2.86120.002335
40-0.086573-1.22430.111135
41-0.075674-1.07020.142912
42-0.23072-3.26290.000648
43-0.073203-1.03530.150901
44-0.046086-0.65180.257653
450.0534030.75520.225498
460.0232020.32810.371581
470.047670.67420.250496
48-0.025724-0.36380.358201
490.1277291.80640.036183
500.087741.24080.10806
510.1047321.48110.070073
520.1042111.47380.071058
53-0.020103-0.28430.388235
540.1647452.32980.010406
550.1874712.65120.004331
560.0559190.79080.214997
570.1458312.06240.020233
580.1290181.82460.034778
590.076031.07520.141783
600.183562.59590.005067


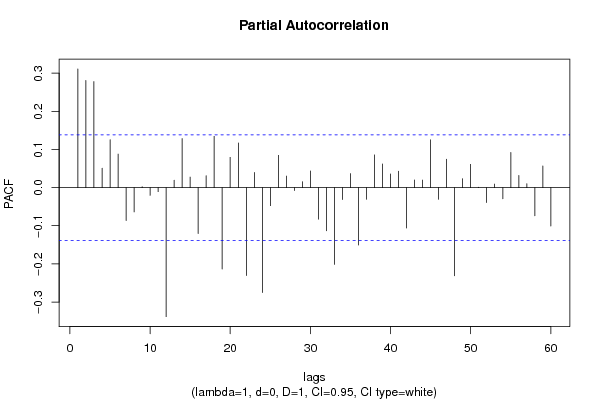
Partial Autocorrelation Function
Time lag kPACF(k)T-STATP-value
10.3111794.40079e-06
20.2807213.975e-05
30.2780043.93165.8e-05
40.0506560.71640.237293
50.1256741.77730.03852
60.0878451.24230.107788
7-0.086368-1.22140.111682
8-0.063631-0.89990.184632
90.0021150.02990.488086
10-0.0203-0.28710.387174
11-0.010479-0.14820.441172
12-0.338395-4.78562e-06
130.0193340.27340.392406
140.1284261.81620.035417
150.0275430.38950.348657
16-0.120296-1.70120.045225
170.0310570.43920.330492
180.1343531.90.029434
19-0.213594-3.02070.001426
200.0793951.12280.131431
210.1171641.6570.049548
22-0.230319-3.25720.000661
230.0396220.56030.287939
24-0.275108-3.89066.8e-05
25-0.047199-0.66750.252611
260.0845021.1950.116744
270.0302150.42730.334811
28-0.007664-0.10840.456901
290.0155020.21920.413344
300.0435590.6160.269291
31-0.082641-1.16870.121955
32-0.113208-1.6010.055477
33-0.201409-2.84840.002427
34-0.031237-0.44180.329571
350.0367660.51990.301839
36-0.150343-2.12620.017358
37-0.030755-0.43490.332039
380.0857771.21310.113267
390.061780.87370.191663
400.0355360.50260.307916
410.0430780.60920.271536
42-0.10597-1.49860.067772
430.0201140.28450.388176
440.0196470.27780.390709
450.1252481.77130.03902
46-0.030373-0.42950.333997
470.0745981.0550.146354
48-0.231241-3.27020.000633
490.0234540.33170.370234
500.0609420.86190.1949
510.0011270.01590.493649
52-0.039059-0.55240.290655
530.0091860.12990.448386
54-0.029296-0.41430.339544
550.0921641.30340.096968
560.031620.44720.327616
570.0102580.14510.442399
58-0.073602-1.04090.149592
590.056780.8030.211467
60-0.1009-1.42690.077578

\begin{tabular}{lllllllll}
\hline
Partial Autocorrelation Function \tabularnewline
Time lag k & PACF(k) & T-STAT & P-value \tabularnewline
1 & 0.311179 & 4.4007 & 9e-06 \tabularnewline
2 & 0.280721 & 3.97 & 5e-05 \tabularnewline
3 & 0.278004 & 3.9316 & 5.8e-05 \tabularnewline
4 & 0.050656 & 0.7164 & 0.237293 \tabularnewline
5 & 0.125674 & 1.7773 & 0.03852 \tabularnewline
6 & 0.087845 & 1.2423 & 0.107788 \tabularnewline
7 & -0.086368 & -1.2214 & 0.111682 \tabularnewline
8 & -0.063631 & -0.8999 & 0.184632 \tabularnewline
9 & 0.002115 & 0.0299 & 0.488086 \tabularnewline
10 & -0.0203 & -0.2871 & 0.387174 \tabularnewline
11 & -0.010479 & -0.1482 & 0.441172 \tabularnewline
12 & -0.338395 & -4.7856 & 2e-06 \tabularnewline
13 & 0.019334 & 0.2734 & 0.392406 \tabularnewline
14 & 0.128426 & 1.8162 & 0.035417 \tabularnewline
15 & 0.027543 & 0.3895 & 0.348657 \tabularnewline
16 & -0.120296 & -1.7012 & 0.045225 \tabularnewline
17 & 0.031057 & 0.4392 & 0.330492 \tabularnewline
18 & 0.134353 & 1.9 & 0.029434 \tabularnewline
19 & -0.213594 & -3.0207 & 0.001426 \tabularnewline
20 & 0.079395 & 1.1228 & 0.131431 \tabularnewline
21 & 0.117164 & 1.657 & 0.049548 \tabularnewline
22 & -0.230319 & -3.2572 & 0.000661 \tabularnewline
23 & 0.039622 & 0.5603 & 0.287939 \tabularnewline
24 & -0.275108 & -3.8906 & 6.8e-05 \tabularnewline
25 & -0.047199 & -0.6675 & 0.252611 \tabularnewline
26 & 0.084502 & 1.195 & 0.116744 \tabularnewline
27 & 0.030215 & 0.4273 & 0.334811 \tabularnewline
28 & -0.007664 & -0.1084 & 0.456901 \tabularnewline
29 & 0.015502 & 0.2192 & 0.413344 \tabularnewline
30 & 0.043559 & 0.616 & 0.269291 \tabularnewline
31 & -0.082641 & -1.1687 & 0.121955 \tabularnewline
32 & -0.113208 & -1.601 & 0.055477 \tabularnewline
33 & -0.201409 & -2.8484 & 0.002427 \tabularnewline
34 & -0.031237 & -0.4418 & 0.329571 \tabularnewline
35 & 0.036766 & 0.5199 & 0.301839 \tabularnewline
36 & -0.150343 & -2.1262 & 0.017358 \tabularnewline
37 & -0.030755 & -0.4349 & 0.332039 \tabularnewline
38 & 0.085777 & 1.2131 & 0.113267 \tabularnewline
39 & 0.06178 & 0.8737 & 0.191663 \tabularnewline
40 & 0.035536 & 0.5026 & 0.307916 \tabularnewline
41 & 0.043078 & 0.6092 & 0.271536 \tabularnewline
42 & -0.10597 & -1.4986 & 0.067772 \tabularnewline
43 & 0.020114 & 0.2845 & 0.388176 \tabularnewline
44 & 0.019647 & 0.2778 & 0.390709 \tabularnewline
45 & 0.125248 & 1.7713 & 0.03902 \tabularnewline
46 & -0.030373 & -0.4295 & 0.333997 \tabularnewline
47 & 0.074598 & 1.055 & 0.146354 \tabularnewline
48 & -0.231241 & -3.2702 & 0.000633 \tabularnewline
49 & 0.023454 & 0.3317 & 0.370234 \tabularnewline
50 & 0.060942 & 0.8619 & 0.1949 \tabularnewline
51 & 0.001127 & 0.0159 & 0.493649 \tabularnewline
52 & -0.039059 & -0.5524 & 0.290655 \tabularnewline
53 & 0.009186 & 0.1299 & 0.448386 \tabularnewline
54 & -0.029296 & -0.4143 & 0.339544 \tabularnewline
55 & 0.092164 & 1.3034 & 0.096968 \tabularnewline
56 & 0.03162 & 0.4472 & 0.327616 \tabularnewline
57 & 0.010258 & 0.1451 & 0.442399 \tabularnewline
58 & -0.073602 & -1.0409 & 0.149592 \tabularnewline
59 & 0.05678 & 0.803 & 0.211467 \tabularnewline
60 & -0.1009 & -1.4269 & 0.077578 \tabularnewline
\hline
\end{tabular}
%Source: https://freestatistics.org/blog/index.php?pk=310080&T=2

[TABLE]
[ROW][C]Partial Autocorrelation Function[/C][/ROW]
[ROW][C]Time lag k[/C][C]PACF(k)[/C][C]T-STAT[/C][C]P-value[/C][/ROW]
[ROW][C]1[/C][C]0.311179[/C][C]4.4007[/C][C]9e-06[/C][/ROW]
[ROW][C]2[/C][C]0.280721[/C][C]3.97[/C][C]5e-05[/C][/ROW]
[ROW][C]3[/C][C]0.278004[/C][C]3.9316[/C][C]5.8e-05[/C][/ROW]
[ROW][C]4[/C][C]0.050656[/C][C]0.7164[/C][C]0.237293[/C][/ROW]
[ROW][C]5[/C][C]0.125674[/C][C]1.7773[/C][C]0.03852[/C][/ROW]
[ROW][C]6[/C][C]0.087845[/C][C]1.2423[/C][C]0.107788[/C][/ROW]
[ROW][C]7[/C][C]-0.086368[/C][C]-1.2214[/C][C]0.111682[/C][/ROW]
[ROW][C]8[/C][C]-0.063631[/C][C]-0.8999[/C][C]0.184632[/C][/ROW]
[ROW][C]9[/C][C]0.002115[/C][C]0.0299[/C][C]0.488086[/C][/ROW]
[ROW][C]10[/C][C]-0.0203[/C][C]-0.2871[/C][C]0.387174[/C][/ROW]
[ROW][C]11[/C][C]-0.010479[/C][C]-0.1482[/C][C]0.441172[/C][/ROW]
[ROW][C]12[/C][C]-0.338395[/C][C]-4.7856[/C][C]2e-06[/C][/ROW]
[ROW][C]13[/C][C]0.019334[/C][C]0.2734[/C][C]0.392406[/C][/ROW]
[ROW][C]14[/C][C]0.128426[/C][C]1.8162[/C][C]0.035417[/C][/ROW]
[ROW][C]15[/C][C]0.027543[/C][C]0.3895[/C][C]0.348657[/C][/ROW]
[ROW][C]16[/C][C]-0.120296[/C][C]-1.7012[/C][C]0.045225[/C][/ROW]
[ROW][C]17[/C][C]0.031057[/C][C]0.4392[/C][C]0.330492[/C][/ROW]
[ROW][C]18[/C][C]0.134353[/C][C]1.9[/C][C]0.029434[/C][/ROW]
[ROW][C]19[/C][C]-0.213594[/C][C]-3.0207[/C][C]0.001426[/C][/ROW]
[ROW][C]20[/C][C]0.079395[/C][C]1.1228[/C][C]0.131431[/C][/ROW]
[ROW][C]21[/C][C]0.117164[/C][C]1.657[/C][C]0.049548[/C][/ROW]
[ROW][C]22[/C][C]-0.230319[/C][C]-3.2572[/C][C]0.000661[/C][/ROW]
[ROW][C]23[/C][C]0.039622[/C][C]0.5603[/C][C]0.287939[/C][/ROW]
[ROW][C]24[/C][C]-0.275108[/C][C]-3.8906[/C][C]6.8e-05[/C][/ROW]
[ROW][C]25[/C][C]-0.047199[/C][C]-0.6675[/C][C]0.252611[/C][/ROW]
[ROW][C]26[/C][C]0.084502[/C][C]1.195[/C][C]0.116744[/C][/ROW]
[ROW][C]27[/C][C]0.030215[/C][C]0.4273[/C][C]0.334811[/C][/ROW]
[ROW][C]28[/C][C]-0.007664[/C][C]-0.1084[/C][C]0.456901[/C][/ROW]
[ROW][C]29[/C][C]0.015502[/C][C]0.2192[/C][C]0.413344[/C][/ROW]
[ROW][C]30[/C][C]0.043559[/C][C]0.616[/C][C]0.269291[/C][/ROW]
[ROW][C]31[/C][C]-0.082641[/C][C]-1.1687[/C][C]0.121955[/C][/ROW]
[ROW][C]32[/C][C]-0.113208[/C][C]-1.601[/C][C]0.055477[/C][/ROW]
[ROW][C]33[/C][C]-0.201409[/C][C]-2.8484[/C][C]0.002427[/C][/ROW]
[ROW][C]34[/C][C]-0.031237[/C][C]-0.4418[/C][C]0.329571[/C][/ROW]
[ROW][C]35[/C][C]0.036766[/C][C]0.5199[/C][C]0.301839[/C][/ROW]
[ROW][C]36[/C][C]-0.150343[/C][C]-2.1262[/C][C]0.017358[/C][/ROW]
[ROW][C]37[/C][C]-0.030755[/C][C]-0.4349[/C][C]0.332039[/C][/ROW]
[ROW][C]38[/C][C]0.085777[/C][C]1.2131[/C][C]0.113267[/C][/ROW]
[ROW][C]39[/C][C]0.06178[/C][C]0.8737[/C][C]0.191663[/C][/ROW]
[ROW][C]40[/C][C]0.035536[/C][C]0.5026[/C][C]0.307916[/C][/ROW]
[ROW][C]41[/C][C]0.043078[/C][C]0.6092[/C][C]0.271536[/C][/ROW]
[ROW][C]42[/C][C]-0.10597[/C][C]-1.4986[/C][C]0.067772[/C][/ROW]
[ROW][C]43[/C][C]0.020114[/C][C]0.2845[/C][C]0.388176[/C][/ROW]
[ROW][C]44[/C][C]0.019647[/C][C]0.2778[/C][C]0.390709[/C][/ROW]
[ROW][C]45[/C][C]0.125248[/C][C]1.7713[/C][C]0.03902[/C][/ROW]
[ROW][C]46[/C][C]-0.030373[/C][C]-0.4295[/C][C]0.333997[/C][/ROW]
[ROW][C]47[/C][C]0.074598[/C][C]1.055[/C][C]0.146354[/C][/ROW]
[ROW][C]48[/C][C]-0.231241[/C][C]-3.2702[/C][C]0.000633[/C][/ROW]
[ROW][C]49[/C][C]0.023454[/C][C]0.3317[/C][C]0.370234[/C][/ROW]
[ROW][C]50[/C][C]0.060942[/C][C]0.8619[/C][C]0.1949[/C][/ROW]
[ROW][C]51[/C][C]0.001127[/C][C]0.0159[/C][C]0.493649[/C][/ROW]
[ROW][C]52[/C][C]-0.039059[/C][C]-0.5524[/C][C]0.290655[/C][/ROW]
[ROW][C]53[/C][C]0.009186[/C][C]0.1299[/C][C]0.448386[/C][/ROW]
[ROW][C]54[/C][C]-0.029296[/C][C]-0.4143[/C][C]0.339544[/C][/ROW]
[ROW][C]55[/C][C]0.092164[/C][C]1.3034[/C][C]0.096968[/C][/ROW]
[ROW][C]56[/C][C]0.03162[/C][C]0.4472[/C][C]0.327616[/C][/ROW]
[ROW][C]57[/C][C]0.010258[/C][C]0.1451[/C][C]0.442399[/C][/ROW]
[ROW][C]58[/C][C]-0.073602[/C][C]-1.0409[/C][C]0.149592[/C][/ROW]
[ROW][C]59[/C][C]0.05678[/C][C]0.803[/C][C]0.211467[/C][/ROW]
[ROW][C]60[/C][C]-0.1009[/C][C]-1.4269[/C][C]0.077578[/C][/ROW]
[/TABLE]
Source: https://freestatistics.org/blog/index.php?pk=310080&T=2

Globally Unique Identifier (entire table): ba.freestatistics.org/blog/index.php?pk=310080&T=2

As an alternative you can also use a QR Code:  

The GUIDs for individual cells are displayed in the table below:

Partial Autocorrelation Function
Time lag kPACF(k)T-STATP-value
10.3111794.40079e-06
20.2807213.975e-05
30.2780043.93165.8e-05
40.0506560.71640.237293
50.1256741.77730.03852
60.0878451.24230.107788
7-0.086368-1.22140.111682
8-0.063631-0.89990.184632
90.0021150.02990.488086
10-0.0203-0.28710.387174
11-0.010479-0.14820.441172
12-0.338395-4.78562e-06
130.0193340.27340.392406
140.1284261.81620.035417
150.0275430.38950.348657
16-0.120296-1.70120.045225
170.0310570.43920.330492
180.1343531.90.029434
19-0.213594-3.02070.001426
200.0793951.12280.131431
210.1171641.6570.049548
22-0.230319-3.25720.000661
230.0396220.56030.287939
24-0.275108-3.89066.8e-05
25-0.047199-0.66750.252611
260.0845021.1950.116744
270.0302150.42730.334811
28-0.007664-0.10840.456901
290.0155020.21920.413344
300.0435590.6160.269291
31-0.082641-1.16870.121955
32-0.113208-1.6010.055477
33-0.201409-2.84840.002427
34-0.031237-0.44180.329571
350.0367660.51990.301839
36-0.150343-2.12620.017358
37-0.030755-0.43490.332039
380.0857771.21310.113267
390.061780.87370.191663
400.0355360.50260.307916
410.0430780.60920.271536
42-0.10597-1.49860.067772
430.0201140.28450.388176
440.0196470.27780.390709
450.1252481.77130.03902
46-0.030373-0.42950.333997
470.0745981.0550.146354
48-0.231241-3.27020.000633
490.0234540.33170.370234
500.0609420.86190.1949
510.0011270.01590.493649
52-0.039059-0.55240.290655
530.0091860.12990.448386
54-0.029296-0.41430.339544
550.0921641.30340.096968
560.031620.44720.327616
570.0102580.14510.442399
58-0.073602-1.04090.149592
590.056780.8030.211467
60-0.1009-1.42690.077578


Parameters (Session):
par1 = 60 ; par2 = 1 ; par3 = 0 ; par4 = 1 ; par5 = 12 ; par6 = White Noise ; par7 = 0.95 ;
Parameters (R input):
par1 = 60 ; par2 = 1 ; par3 = 0 ; par4 = 1 ; par5 = 12 ; par6 = White Noise ; par7 = 0.95 ; par8 = ;
R code (references can be found in the software module):
if (par1 == 'Default') {
par1 = 10*log10(length(x))
} else {
par1 <- as.numeric(par1)
}
par2 <- as.numeric(par2)
par3 <- as.numeric(par3)
par4 <- as.numeric(par4)
par5 <- as.numeric(par5)
if (par6 == 'White Noise') par6 <- 'white' else par6 <- 'ma'
par7 <- as.numeric(par7)
if (par8 != '') par8 <- as.numeric(par8)
x <- na.omit(x)
ox <- x
if (par8 == '') {
if (par2 == 0) {
x <- log(x)
} else {
x <- (x ^ par2 - 1) / par2
}
} else {
x <- log(x,base=par8)
}
if (par3 > 0) x <- diff(x,lag=1,difference=par3)
if (par4 > 0) x <- diff(x,lag=par5,difference=par4)
bitmap(file='picts.png')
op <- par(mfrow=c(2,1))
plot(ox,type='l',main='Original Time Series',xlab='time',ylab='value')
if (par8=='') {
mytitle <- paste('Working Time Series (lambda=',par2,', d=',par3,', D=',par4,')',sep='')
mysub <- paste('(lambda=',par2,', d=',par3,', D=',par4,', CI=', par7, ', CI type=',par6,')',sep='')
} else {
mytitle <- paste('Working Time Series (base=',par8,', d=',par3,', D=',par4,')',sep='')
mysub <- paste('(base=',par8,', d=',par3,', D=',par4,', CI=', par7, ', CI type=',par6,')',sep='')
}
plot(x,type='l', main=mytitle,xlab='time',ylab='value')
par(op)
dev.off()
bitmap(file='pic1.png')
racf <- acf(x, par1, main='Autocorrelation', xlab='time lag', ylab='ACF', ci.type=par6, ci=par7, sub=mysub)
dev.off()
bitmap(file='pic2.png')
rpacf <- pacf(x,par1,main='Partial Autocorrelation',xlab='lags',ylab='PACF',sub=mysub)
dev.off()
(myacf <- c(racf$acf))
(mypacf <- c(rpacf$acf))
lengthx <- length(x)
sqrtn <- sqrt(lengthx)
load(file='createtable')
a<-table.start()
a<-table.row.start(a)
a<-table.element(a,'Autocorrelation Function',4,TRUE)
a<-table.row.end(a)
a<-table.row.start(a)
a<-table.element(a,'Time lag k',header=TRUE)
a<-table.element(a,'ACF(k)',header=TRUE)
a<-table.element(a,'T-STAT',header=TRUE)
a<-table.element(a,'P-value',header=TRUE)
a<-table.row.end(a)
for (i in 2:(par1+1)) {
a<-table.row.start(a)
a<-table.element(a,i-1,header=TRUE)
a<-table.element(a,round(myacf[i],6))
mytstat <- myacf[i]*sqrtn
a<-table.element(a,round(mytstat,4))
a<-table.element(a,round(1-pt(abs(mytstat),lengthx),6))
a<-table.row.end(a)
}
a<-table.end(a)
table.save(a,file='mytable.tab')
a<-table.start()
a<-table.row.start(a)
a<-table.element(a,'Partial Autocorrelation Function',4,TRUE)
a<-table.row.end(a)
a<-table.row.start(a)
a<-table.element(a,'Time lag k',header=TRUE)
a<-table.element(a,'PACF(k)',header=TRUE)
a<-table.element(a,'T-STAT',header=TRUE)
a<-table.element(a,'P-value',header=TRUE)
a<-table.row.end(a)
for (i in 1:par1) {
a<-table.row.start(a)
a<-table.element(a,i,header=TRUE)
a<-table.element(a,round(mypacf[i],6))
mytstat <- mypacf[i]*sqrtn
a<-table.element(a,round(mytstat,4))
a<-table.element(a,round(1-pt(abs(mytstat),lengthx),6))
a<-table.row.end(a)
}
a<-table.end(a)
table.save(a,file='mytable1.tab')