Free Statistics

of Irreproducible Research!

Author's title

Author*The author of this computation has been verified*
R Software Modulerwasp_autocorrelation.wasp
Title produced by software(Partial) Autocorrelation Function
Date of computationSun, 17 Dec 2017 22:21:53 +0100
Cite this page as followsStatistical Computations at FreeStatistics.org, Office for Research Development and Education, URL https://freestatistics.org/blog/index.php?v=date/2017/Dec/17/t1513545745j8pzkhb65zw1vg0.htm/, Retrieved Wed, 15 May 2024 22:38:46 +0000
Statistical Computations at FreeStatistics.org, Office for Research Development and Education, URL https://freestatistics.org/blog/index.php?pk=310075, Retrieved Wed, 15 May 2024 22:38:46 +0000
QR Codes:

Original text written by user:
IsPrivate?No (this computation is public)
User-defined keywords
Estimated Impact99
Family? (F = Feedback message, R = changed R code, M = changed R Module, P = changed Parameters, D = changed Data)
-       [(Partial) Autocorrelation Function] [Datareeks 3.1 - (...] [2017-12-17 21:21:53] [228f385b091a4ec8014a0b8722ae7714] [Current]
Feedback Forum

Post a new message
Dataseries X:
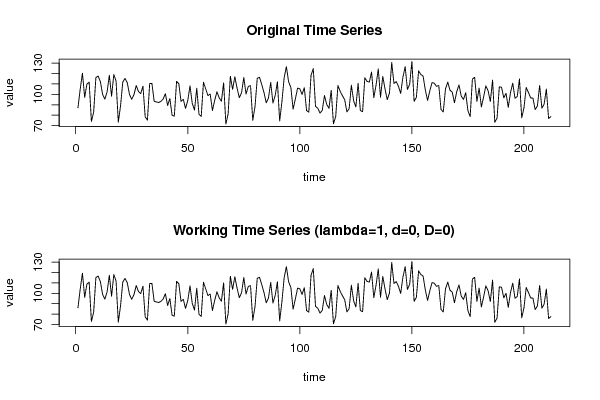
87.1
105
120.3
97
109.9
111.7
74
82.8
116.1
117.6
112.2
100
95.4
102.3
118.3
98.2
119
112.8
73.3
89
111.8
115.4
111.2
99.9
95.2
99.8
108.5
102.7
100.7
107.9
78.5
75.3
110.4
110.5
93.4
92.7
92.2
93.3
95.5
100.6
89.3
96
80
79.1
112.4
110.2
93.3
95.3
86.5
94.1
108.2
91.3
84.9
105.9
81
78.8
111.7
105.3
98.8
100.3
84.5
94.1
102.5
96.8
93.4
111
71.5
81.2
117.3
104.8
116.9
105.9
96.8
101.6
116.2
100.3
107.7
108.4
75.1
88.3
115.4
116.4
109.5
101.8
91.9
96.5
111.5
91.7
99
112
74.4
92.8
115.9
126.6
112
106.6
85.8
95.6
106
105.3
100
106.4
84.5
82.9
118.3
124.8
88.5
86.7
82
84.6
98.9
90.3
86.6
103.9
71.7
78.7
108.5
102.9
98.7
95
83.2
86.3
108.8
93.8
87.9
110.6
84.6
83.3
115.9
112.4
111.8
121.4
96.8
108.7
124.4
97.2
117.3
105.3
94.9
101.4
130.6
110.4
112.3
107.8
100.9
116.7
126.5
104.7
109.6
131.5
93.3
97.1
122.6
119
117.5
104.1
94.1
103.5
111.3
110.7
107.7
108.5
85.4
83.2
105.4
111.8
104
102.1
92
102.5
109.1
98.5
95.1
101.6
84.4
78.7
114.7
116.4
93.2
106
87.9
97.5
108.2
103.5
93.1
113.7
73.2
77.3
107.1
106.9
96.6
101
87.5
101.8
110.8
96.3
97.9
114.8
77.4
87
106.6
101.8
96.6
96.4
85.4
88.9
108.6
86.7
90.7
105.1
76.8
78.7


Summary of computational transaction
Raw Input view raw input (R code)
Raw Outputview raw output of R engine
Computing time2 seconds
R ServerBig Analytics Cloud Computing Center

\begin{tabular}{lllllllll}
\hline
Summary of computational transaction \tabularnewline
Raw Input view raw input (R code)  \tabularnewline
Raw Outputview raw output of R engine  \tabularnewline
Computing time2 seconds \tabularnewline
R ServerBig Analytics Cloud Computing Center \tabularnewline
\hline
\end{tabular}
%Source: https://freestatistics.org/blog/index.php?pk=310075&T=0

[TABLE]
[ROW]
Summary of computational transaction[/C][/ROW] [ROW]Raw Input[/C] view raw input (R code) [/C][/ROW] [ROW]Raw Output[/C]view raw output of R engine [/C][/ROW] [ROW]Computing time[/C]2 seconds[/C][/ROW] [ROW]R Server[/C]Big Analytics Cloud Computing Center[/C][/ROW] [/TABLE] Source: https://freestatistics.org/blog/index.php?pk=310075&T=0

Globally Unique Identifier (entire table): ba.freestatistics.org/blog/index.php?pk=310075&T=0

As an alternative you can also use a QR Code:  

The GUIDs for individual cells are displayed in the table below:

Summary of computational transaction
Raw Input view raw input (R code)
Raw Outputview raw output of R engine
Computing time2 seconds
R ServerBig Analytics Cloud Computing Center


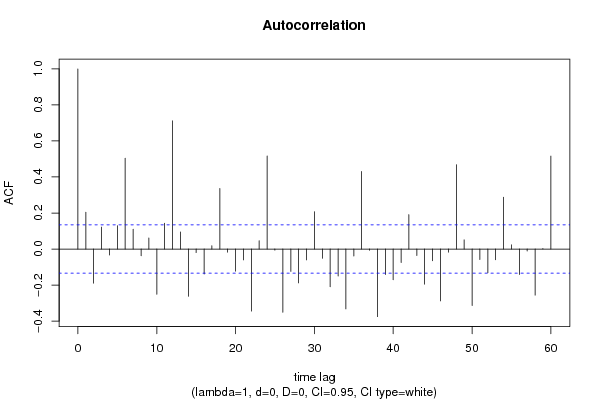
Autocorrelation Function
Time lag kACF(k)T-STATP-value
10.2037322.96640.001679
2-0.189489-2.7590.003152
30.1216031.77060.039035
4-0.033208-0.48350.314614
50.1292251.88150.030634
60.5037997.33540
70.1099541.60090.055439
8-0.037325-0.54350.293691
90.0614820.89520.185852
10-0.25111-3.65620.000161
110.1430042.08220.019264
120.71154210.36020
130.0945251.37630.08509
14-0.262011-3.81498.9e-05
15-0.019949-0.29050.385873
16-0.138824-2.02130.022253
170.0182280.26540.395479
180.3361554.89451e-06
19-0.017288-0.25170.400754
20-0.122742-1.78710.037671
21-0.06054-0.88150.18953
22-0.344857-5.02121e-06
230.0457210.66570.25316
240.5169617.52710
25-0.006225-0.09060.463934
26-0.350868-5.10870
27-0.124198-1.80830.035985
28-0.188041-2.73790.003354
29-0.060316-0.87820.190411
300.2068983.01250.001453
31-0.051127-0.74440.228723
32-0.209975-3.05730.00126
33-0.150127-2.18590.01496
34-0.332505-4.84131e-06
35-0.039316-0.57240.283812
360.4305046.26820
37-0.007215-0.10510.458215
38-0.375684-5.470
39-0.141513-2.06050.020288
40-0.171094-2.49120.00675
41-0.074538-1.08530.139513
420.1907832.77780.002981
43-0.036198-0.52710.299355
44-0.194992-2.83910.002482
45-0.065541-0.95430.170513
46-0.288081-4.19452e-05
47-0.017468-0.25430.399742
480.4675326.80740
490.0506870.7380.230659
50-0.314069-4.57294e-06
51-0.0582-0.84740.198862
52-0.132173-1.92450.027817
53-0.059982-0.87340.19173
540.2871614.18112.1e-05
550.0229860.33470.369099
56-0.14137-2.05840.020388
57-0.01096-0.15960.436681
58-0.256188-3.73020.000123
590.0008140.01190.495277
600.5157657.50960

\begin{tabular}{lllllllll}
\hline
Autocorrelation Function \tabularnewline
Time lag k & ACF(k) & T-STAT & P-value \tabularnewline
1 & 0.203732 & 2.9664 & 0.001679 \tabularnewline
2 & -0.189489 & -2.759 & 0.003152 \tabularnewline
3 & 0.121603 & 1.7706 & 0.039035 \tabularnewline
4 & -0.033208 & -0.4835 & 0.314614 \tabularnewline
5 & 0.129225 & 1.8815 & 0.030634 \tabularnewline
6 & 0.503799 & 7.3354 & 0 \tabularnewline
7 & 0.109954 & 1.6009 & 0.055439 \tabularnewline
8 & -0.037325 & -0.5435 & 0.293691 \tabularnewline
9 & 0.061482 & 0.8952 & 0.185852 \tabularnewline
10 & -0.25111 & -3.6562 & 0.000161 \tabularnewline
11 & 0.143004 & 2.0822 & 0.019264 \tabularnewline
12 & 0.711542 & 10.3602 & 0 \tabularnewline
13 & 0.094525 & 1.3763 & 0.08509 \tabularnewline
14 & -0.262011 & -3.8149 & 8.9e-05 \tabularnewline
15 & -0.019949 & -0.2905 & 0.385873 \tabularnewline
16 & -0.138824 & -2.0213 & 0.022253 \tabularnewline
17 & 0.018228 & 0.2654 & 0.395479 \tabularnewline
18 & 0.336155 & 4.8945 & 1e-06 \tabularnewline
19 & -0.017288 & -0.2517 & 0.400754 \tabularnewline
20 & -0.122742 & -1.7871 & 0.037671 \tabularnewline
21 & -0.06054 & -0.8815 & 0.18953 \tabularnewline
22 & -0.344857 & -5.0212 & 1e-06 \tabularnewline
23 & 0.045721 & 0.6657 & 0.25316 \tabularnewline
24 & 0.516961 & 7.5271 & 0 \tabularnewline
25 & -0.006225 & -0.0906 & 0.463934 \tabularnewline
26 & -0.350868 & -5.1087 & 0 \tabularnewline
27 & -0.124198 & -1.8083 & 0.035985 \tabularnewline
28 & -0.188041 & -2.7379 & 0.003354 \tabularnewline
29 & -0.060316 & -0.8782 & 0.190411 \tabularnewline
30 & 0.206898 & 3.0125 & 0.001453 \tabularnewline
31 & -0.051127 & -0.7444 & 0.228723 \tabularnewline
32 & -0.209975 & -3.0573 & 0.00126 \tabularnewline
33 & -0.150127 & -2.1859 & 0.01496 \tabularnewline
34 & -0.332505 & -4.8413 & 1e-06 \tabularnewline
35 & -0.039316 & -0.5724 & 0.283812 \tabularnewline
36 & 0.430504 & 6.2682 & 0 \tabularnewline
37 & -0.007215 & -0.1051 & 0.458215 \tabularnewline
38 & -0.375684 & -5.47 & 0 \tabularnewline
39 & -0.141513 & -2.0605 & 0.020288 \tabularnewline
40 & -0.171094 & -2.4912 & 0.00675 \tabularnewline
41 & -0.074538 & -1.0853 & 0.139513 \tabularnewline
42 & 0.190783 & 2.7778 & 0.002981 \tabularnewline
43 & -0.036198 & -0.5271 & 0.299355 \tabularnewline
44 & -0.194992 & -2.8391 & 0.002482 \tabularnewline
45 & -0.065541 & -0.9543 & 0.170513 \tabularnewline
46 & -0.288081 & -4.1945 & 2e-05 \tabularnewline
47 & -0.017468 & -0.2543 & 0.399742 \tabularnewline
48 & 0.467532 & 6.8074 & 0 \tabularnewline
49 & 0.050687 & 0.738 & 0.230659 \tabularnewline
50 & -0.314069 & -4.5729 & 4e-06 \tabularnewline
51 & -0.0582 & -0.8474 & 0.198862 \tabularnewline
52 & -0.132173 & -1.9245 & 0.027817 \tabularnewline
53 & -0.059982 & -0.8734 & 0.19173 \tabularnewline
54 & 0.287161 & 4.1811 & 2.1e-05 \tabularnewline
55 & 0.022986 & 0.3347 & 0.369099 \tabularnewline
56 & -0.14137 & -2.0584 & 0.020388 \tabularnewline
57 & -0.01096 & -0.1596 & 0.436681 \tabularnewline
58 & -0.256188 & -3.7302 & 0.000123 \tabularnewline
59 & 0.000814 & 0.0119 & 0.495277 \tabularnewline
60 & 0.515765 & 7.5096 & 0 \tabularnewline
\hline
\end{tabular}
%Source: https://freestatistics.org/blog/index.php?pk=310075&T=1

[TABLE]
[ROW][C]Autocorrelation Function[/C][/ROW]
[ROW][C]Time lag k[/C][C]ACF(k)[/C][C]T-STAT[/C][C]P-value[/C][/ROW]
[ROW][C]1[/C][C]0.203732[/C][C]2.9664[/C][C]0.001679[/C][/ROW]
[ROW][C]2[/C][C]-0.189489[/C][C]-2.759[/C][C]0.003152[/C][/ROW]
[ROW][C]3[/C][C]0.121603[/C][C]1.7706[/C][C]0.039035[/C][/ROW]
[ROW][C]4[/C][C]-0.033208[/C][C]-0.4835[/C][C]0.314614[/C][/ROW]
[ROW][C]5[/C][C]0.129225[/C][C]1.8815[/C][C]0.030634[/C][/ROW]
[ROW][C]6[/C][C]0.503799[/C][C]7.3354[/C][C]0[/C][/ROW]
[ROW][C]7[/C][C]0.109954[/C][C]1.6009[/C][C]0.055439[/C][/ROW]
[ROW][C]8[/C][C]-0.037325[/C][C]-0.5435[/C][C]0.293691[/C][/ROW]
[ROW][C]9[/C][C]0.061482[/C][C]0.8952[/C][C]0.185852[/C][/ROW]
[ROW][C]10[/C][C]-0.25111[/C][C]-3.6562[/C][C]0.000161[/C][/ROW]
[ROW][C]11[/C][C]0.143004[/C][C]2.0822[/C][C]0.019264[/C][/ROW]
[ROW][C]12[/C][C]0.711542[/C][C]10.3602[/C][C]0[/C][/ROW]
[ROW][C]13[/C][C]0.094525[/C][C]1.3763[/C][C]0.08509[/C][/ROW]
[ROW][C]14[/C][C]-0.262011[/C][C]-3.8149[/C][C]8.9e-05[/C][/ROW]
[ROW][C]15[/C][C]-0.019949[/C][C]-0.2905[/C][C]0.385873[/C][/ROW]
[ROW][C]16[/C][C]-0.138824[/C][C]-2.0213[/C][C]0.022253[/C][/ROW]
[ROW][C]17[/C][C]0.018228[/C][C]0.2654[/C][C]0.395479[/C][/ROW]
[ROW][C]18[/C][C]0.336155[/C][C]4.8945[/C][C]1e-06[/C][/ROW]
[ROW][C]19[/C][C]-0.017288[/C][C]-0.2517[/C][C]0.400754[/C][/ROW]
[ROW][C]20[/C][C]-0.122742[/C][C]-1.7871[/C][C]0.037671[/C][/ROW]
[ROW][C]21[/C][C]-0.06054[/C][C]-0.8815[/C][C]0.18953[/C][/ROW]
[ROW][C]22[/C][C]-0.344857[/C][C]-5.0212[/C][C]1e-06[/C][/ROW]
[ROW][C]23[/C][C]0.045721[/C][C]0.6657[/C][C]0.25316[/C][/ROW]
[ROW][C]24[/C][C]0.516961[/C][C]7.5271[/C][C]0[/C][/ROW]
[ROW][C]25[/C][C]-0.006225[/C][C]-0.0906[/C][C]0.463934[/C][/ROW]
[ROW][C]26[/C][C]-0.350868[/C][C]-5.1087[/C][C]0[/C][/ROW]
[ROW][C]27[/C][C]-0.124198[/C][C]-1.8083[/C][C]0.035985[/C][/ROW]
[ROW][C]28[/C][C]-0.188041[/C][C]-2.7379[/C][C]0.003354[/C][/ROW]
[ROW][C]29[/C][C]-0.060316[/C][C]-0.8782[/C][C]0.190411[/C][/ROW]
[ROW][C]30[/C][C]0.206898[/C][C]3.0125[/C][C]0.001453[/C][/ROW]
[ROW][C]31[/C][C]-0.051127[/C][C]-0.7444[/C][C]0.228723[/C][/ROW]
[ROW][C]32[/C][C]-0.209975[/C][C]-3.0573[/C][C]0.00126[/C][/ROW]
[ROW][C]33[/C][C]-0.150127[/C][C]-2.1859[/C][C]0.01496[/C][/ROW]
[ROW][C]34[/C][C]-0.332505[/C][C]-4.8413[/C][C]1e-06[/C][/ROW]
[ROW][C]35[/C][C]-0.039316[/C][C]-0.5724[/C][C]0.283812[/C][/ROW]
[ROW][C]36[/C][C]0.430504[/C][C]6.2682[/C][C]0[/C][/ROW]
[ROW][C]37[/C][C]-0.007215[/C][C]-0.1051[/C][C]0.458215[/C][/ROW]
[ROW][C]38[/C][C]-0.375684[/C][C]-5.47[/C][C]0[/C][/ROW]
[ROW][C]39[/C][C]-0.141513[/C][C]-2.0605[/C][C]0.020288[/C][/ROW]
[ROW][C]40[/C][C]-0.171094[/C][C]-2.4912[/C][C]0.00675[/C][/ROW]
[ROW][C]41[/C][C]-0.074538[/C][C]-1.0853[/C][C]0.139513[/C][/ROW]
[ROW][C]42[/C][C]0.190783[/C][C]2.7778[/C][C]0.002981[/C][/ROW]
[ROW][C]43[/C][C]-0.036198[/C][C]-0.5271[/C][C]0.299355[/C][/ROW]
[ROW][C]44[/C][C]-0.194992[/C][C]-2.8391[/C][C]0.002482[/C][/ROW]
[ROW][C]45[/C][C]-0.065541[/C][C]-0.9543[/C][C]0.170513[/C][/ROW]
[ROW][C]46[/C][C]-0.288081[/C][C]-4.1945[/C][C]2e-05[/C][/ROW]
[ROW][C]47[/C][C]-0.017468[/C][C]-0.2543[/C][C]0.399742[/C][/ROW]
[ROW][C]48[/C][C]0.467532[/C][C]6.8074[/C][C]0[/C][/ROW]
[ROW][C]49[/C][C]0.050687[/C][C]0.738[/C][C]0.230659[/C][/ROW]
[ROW][C]50[/C][C]-0.314069[/C][C]-4.5729[/C][C]4e-06[/C][/ROW]
[ROW][C]51[/C][C]-0.0582[/C][C]-0.8474[/C][C]0.198862[/C][/ROW]
[ROW][C]52[/C][C]-0.132173[/C][C]-1.9245[/C][C]0.027817[/C][/ROW]
[ROW][C]53[/C][C]-0.059982[/C][C]-0.8734[/C][C]0.19173[/C][/ROW]
[ROW][C]54[/C][C]0.287161[/C][C]4.1811[/C][C]2.1e-05[/C][/ROW]
[ROW][C]55[/C][C]0.022986[/C][C]0.3347[/C][C]0.369099[/C][/ROW]
[ROW][C]56[/C][C]-0.14137[/C][C]-2.0584[/C][C]0.020388[/C][/ROW]
[ROW][C]57[/C][C]-0.01096[/C][C]-0.1596[/C][C]0.436681[/C][/ROW]
[ROW][C]58[/C][C]-0.256188[/C][C]-3.7302[/C][C]0.000123[/C][/ROW]
[ROW][C]59[/C][C]0.000814[/C][C]0.0119[/C][C]0.495277[/C][/ROW]
[ROW][C]60[/C][C]0.515765[/C][C]7.5096[/C][C]0[/C][/ROW]
[/TABLE]
Source: https://freestatistics.org/blog/index.php?pk=310075&T=1

Globally Unique Identifier (entire table): ba.freestatistics.org/blog/index.php?pk=310075&T=1

As an alternative you can also use a QR Code:  

The GUIDs for individual cells are displayed in the table below:

Autocorrelation Function
Time lag kACF(k)T-STATP-value
10.2037322.96640.001679
2-0.189489-2.7590.003152
30.1216031.77060.039035
4-0.033208-0.48350.314614
50.1292251.88150.030634
60.5037997.33540
70.1099541.60090.055439
8-0.037325-0.54350.293691
90.0614820.89520.185852
10-0.25111-3.65620.000161
110.1430042.08220.019264
120.71154210.36020
130.0945251.37630.08509
14-0.262011-3.81498.9e-05
15-0.019949-0.29050.385873
16-0.138824-2.02130.022253
170.0182280.26540.395479
180.3361554.89451e-06
19-0.017288-0.25170.400754
20-0.122742-1.78710.037671
21-0.06054-0.88150.18953
22-0.344857-5.02121e-06
230.0457210.66570.25316
240.5169617.52710
25-0.006225-0.09060.463934
26-0.350868-5.10870
27-0.124198-1.80830.035985
28-0.188041-2.73790.003354
29-0.060316-0.87820.190411
300.2068983.01250.001453
31-0.051127-0.74440.228723
32-0.209975-3.05730.00126
33-0.150127-2.18590.01496
34-0.332505-4.84131e-06
35-0.039316-0.57240.283812
360.4305046.26820
37-0.007215-0.10510.458215
38-0.375684-5.470
39-0.141513-2.06050.020288
40-0.171094-2.49120.00675
41-0.074538-1.08530.139513
420.1907832.77780.002981
43-0.036198-0.52710.299355
44-0.194992-2.83910.002482
45-0.065541-0.95430.170513
46-0.288081-4.19452e-05
47-0.017468-0.25430.399742
480.4675326.80740
490.0506870.7380.230659
50-0.314069-4.57294e-06
51-0.0582-0.84740.198862
52-0.132173-1.92450.027817
53-0.059982-0.87340.19173
540.2871614.18112.1e-05
550.0229860.33470.369099
56-0.14137-2.05840.020388
57-0.01096-0.15960.436681
58-0.256188-3.73020.000123
590.0008140.01190.495277
600.5157657.50960


Partial Autocorrelation Function
Time lag kPACF(k)T-STATP-value
10.2037322.96640.001679
2-0.240999-3.5090.000275
30.2421413.52560.000259
4-0.209026-3.04350.001317
50.3524635.13190
60.3416754.97491e-06
7-0.004227-0.06150.475491
80.1696582.47030.007145
9-0.129056-1.87910.030803
10-0.302784-4.40868e-06
110.2852994.1542.4e-05
120.4646826.76590
13-0.126997-1.84910.032918
14-0.244278-3.55670.000232
15-0.164282-2.3920.008815
16-0.049056-0.71430.237924
17-0.112404-1.63660.051596
18-0.082231-1.19730.116263
19-0.100764-1.46710.071909
200.0324780.47290.318388
210.0009450.01380.494516
22-0.054408-0.79220.214568
230.0555960.80950.20957
240.064710.94220.173583
250.0282310.41110.340725
26-0.175271-2.5520.005708
27-0.013624-0.19840.421473
280.0369830.53850.295407
29-0.085805-1.24930.10646
30-0.063763-0.92840.177126
310.0306690.44650.327829
32-0.134235-1.95450.025979
33-0.00864-0.12580.450005
340.0150980.21980.41311
35-0.061506-0.89550.185756
360.1191421.73470.04212
370.0261310.38050.351987
38-0.018626-0.27120.39325
390.0138540.20170.420166
40-0.041942-0.61070.271032
410.0008610.01250.495005
42-0.040855-0.59490.276288
43-0.057985-0.84430.199734
440.0155490.22640.410558
450.1733852.52450.006159
46-0.110613-1.61060.054383
470.0680250.99050.16154
480.0533780.77720.218953
490.0447550.65160.25767
50-0.020364-0.29650.383568
51-0.028023-0.4080.341834
52-0.136058-1.9810.02444
53-0.0368-0.53580.296325
540.0894731.30280.097036
55-0.010389-0.15130.439957
56-0.019368-0.2820.389106
57-0.103381-1.50530.066874
58-0.037608-0.54760.292279
590.0002650.00390.498462
600.0874941.27390.102041

\begin{tabular}{lllllllll}
\hline
Partial Autocorrelation Function \tabularnewline
Time lag k & PACF(k) & T-STAT & P-value \tabularnewline
1 & 0.203732 & 2.9664 & 0.001679 \tabularnewline
2 & -0.240999 & -3.509 & 0.000275 \tabularnewline
3 & 0.242141 & 3.5256 & 0.000259 \tabularnewline
4 & -0.209026 & -3.0435 & 0.001317 \tabularnewline
5 & 0.352463 & 5.1319 & 0 \tabularnewline
6 & 0.341675 & 4.9749 & 1e-06 \tabularnewline
7 & -0.004227 & -0.0615 & 0.475491 \tabularnewline
8 & 0.169658 & 2.4703 & 0.007145 \tabularnewline
9 & -0.129056 & -1.8791 & 0.030803 \tabularnewline
10 & -0.302784 & -4.4086 & 8e-06 \tabularnewline
11 & 0.285299 & 4.154 & 2.4e-05 \tabularnewline
12 & 0.464682 & 6.7659 & 0 \tabularnewline
13 & -0.126997 & -1.8491 & 0.032918 \tabularnewline
14 & -0.244278 & -3.5567 & 0.000232 \tabularnewline
15 & -0.164282 & -2.392 & 0.008815 \tabularnewline
16 & -0.049056 & -0.7143 & 0.237924 \tabularnewline
17 & -0.112404 & -1.6366 & 0.051596 \tabularnewline
18 & -0.082231 & -1.1973 & 0.116263 \tabularnewline
19 & -0.100764 & -1.4671 & 0.071909 \tabularnewline
20 & 0.032478 & 0.4729 & 0.318388 \tabularnewline
21 & 0.000945 & 0.0138 & 0.494516 \tabularnewline
22 & -0.054408 & -0.7922 & 0.214568 \tabularnewline
23 & 0.055596 & 0.8095 & 0.20957 \tabularnewline
24 & 0.06471 & 0.9422 & 0.173583 \tabularnewline
25 & 0.028231 & 0.4111 & 0.340725 \tabularnewline
26 & -0.175271 & -2.552 & 0.005708 \tabularnewline
27 & -0.013624 & -0.1984 & 0.421473 \tabularnewline
28 & 0.036983 & 0.5385 & 0.295407 \tabularnewline
29 & -0.085805 & -1.2493 & 0.10646 \tabularnewline
30 & -0.063763 & -0.9284 & 0.177126 \tabularnewline
31 & 0.030669 & 0.4465 & 0.327829 \tabularnewline
32 & -0.134235 & -1.9545 & 0.025979 \tabularnewline
33 & -0.00864 & -0.1258 & 0.450005 \tabularnewline
34 & 0.015098 & 0.2198 & 0.41311 \tabularnewline
35 & -0.061506 & -0.8955 & 0.185756 \tabularnewline
36 & 0.119142 & 1.7347 & 0.04212 \tabularnewline
37 & 0.026131 & 0.3805 & 0.351987 \tabularnewline
38 & -0.018626 & -0.2712 & 0.39325 \tabularnewline
39 & 0.013854 & 0.2017 & 0.420166 \tabularnewline
40 & -0.041942 & -0.6107 & 0.271032 \tabularnewline
41 & 0.000861 & 0.0125 & 0.495005 \tabularnewline
42 & -0.040855 & -0.5949 & 0.276288 \tabularnewline
43 & -0.057985 & -0.8443 & 0.199734 \tabularnewline
44 & 0.015549 & 0.2264 & 0.410558 \tabularnewline
45 & 0.173385 & 2.5245 & 0.006159 \tabularnewline
46 & -0.110613 & -1.6106 & 0.054383 \tabularnewline
47 & 0.068025 & 0.9905 & 0.16154 \tabularnewline
48 & 0.053378 & 0.7772 & 0.218953 \tabularnewline
49 & 0.044755 & 0.6516 & 0.25767 \tabularnewline
50 & -0.020364 & -0.2965 & 0.383568 \tabularnewline
51 & -0.028023 & -0.408 & 0.341834 \tabularnewline
52 & -0.136058 & -1.981 & 0.02444 \tabularnewline
53 & -0.0368 & -0.5358 & 0.296325 \tabularnewline
54 & 0.089473 & 1.3028 & 0.097036 \tabularnewline
55 & -0.010389 & -0.1513 & 0.439957 \tabularnewline
56 & -0.019368 & -0.282 & 0.389106 \tabularnewline
57 & -0.103381 & -1.5053 & 0.066874 \tabularnewline
58 & -0.037608 & -0.5476 & 0.292279 \tabularnewline
59 & 0.000265 & 0.0039 & 0.498462 \tabularnewline
60 & 0.087494 & 1.2739 & 0.102041 \tabularnewline
\hline
\end{tabular}
%Source: https://freestatistics.org/blog/index.php?pk=310075&T=2

[TABLE]
[ROW][C]Partial Autocorrelation Function[/C][/ROW]
[ROW][C]Time lag k[/C][C]PACF(k)[/C][C]T-STAT[/C][C]P-value[/C][/ROW]
[ROW][C]1[/C][C]0.203732[/C][C]2.9664[/C][C]0.001679[/C][/ROW]
[ROW][C]2[/C][C]-0.240999[/C][C]-3.509[/C][C]0.000275[/C][/ROW]
[ROW][C]3[/C][C]0.242141[/C][C]3.5256[/C][C]0.000259[/C][/ROW]
[ROW][C]4[/C][C]-0.209026[/C][C]-3.0435[/C][C]0.001317[/C][/ROW]
[ROW][C]5[/C][C]0.352463[/C][C]5.1319[/C][C]0[/C][/ROW]
[ROW][C]6[/C][C]0.341675[/C][C]4.9749[/C][C]1e-06[/C][/ROW]
[ROW][C]7[/C][C]-0.004227[/C][C]-0.0615[/C][C]0.475491[/C][/ROW]
[ROW][C]8[/C][C]0.169658[/C][C]2.4703[/C][C]0.007145[/C][/ROW]
[ROW][C]9[/C][C]-0.129056[/C][C]-1.8791[/C][C]0.030803[/C][/ROW]
[ROW][C]10[/C][C]-0.302784[/C][C]-4.4086[/C][C]8e-06[/C][/ROW]
[ROW][C]11[/C][C]0.285299[/C][C]4.154[/C][C]2.4e-05[/C][/ROW]
[ROW][C]12[/C][C]0.464682[/C][C]6.7659[/C][C]0[/C][/ROW]
[ROW][C]13[/C][C]-0.126997[/C][C]-1.8491[/C][C]0.032918[/C][/ROW]
[ROW][C]14[/C][C]-0.244278[/C][C]-3.5567[/C][C]0.000232[/C][/ROW]
[ROW][C]15[/C][C]-0.164282[/C][C]-2.392[/C][C]0.008815[/C][/ROW]
[ROW][C]16[/C][C]-0.049056[/C][C]-0.7143[/C][C]0.237924[/C][/ROW]
[ROW][C]17[/C][C]-0.112404[/C][C]-1.6366[/C][C]0.051596[/C][/ROW]
[ROW][C]18[/C][C]-0.082231[/C][C]-1.1973[/C][C]0.116263[/C][/ROW]
[ROW][C]19[/C][C]-0.100764[/C][C]-1.4671[/C][C]0.071909[/C][/ROW]
[ROW][C]20[/C][C]0.032478[/C][C]0.4729[/C][C]0.318388[/C][/ROW]
[ROW][C]21[/C][C]0.000945[/C][C]0.0138[/C][C]0.494516[/C][/ROW]
[ROW][C]22[/C][C]-0.054408[/C][C]-0.7922[/C][C]0.214568[/C][/ROW]
[ROW][C]23[/C][C]0.055596[/C][C]0.8095[/C][C]0.20957[/C][/ROW]
[ROW][C]24[/C][C]0.06471[/C][C]0.9422[/C][C]0.173583[/C][/ROW]
[ROW][C]25[/C][C]0.028231[/C][C]0.4111[/C][C]0.340725[/C][/ROW]
[ROW][C]26[/C][C]-0.175271[/C][C]-2.552[/C][C]0.005708[/C][/ROW]
[ROW][C]27[/C][C]-0.013624[/C][C]-0.1984[/C][C]0.421473[/C][/ROW]
[ROW][C]28[/C][C]0.036983[/C][C]0.5385[/C][C]0.295407[/C][/ROW]
[ROW][C]29[/C][C]-0.085805[/C][C]-1.2493[/C][C]0.10646[/C][/ROW]
[ROW][C]30[/C][C]-0.063763[/C][C]-0.9284[/C][C]0.177126[/C][/ROW]
[ROW][C]31[/C][C]0.030669[/C][C]0.4465[/C][C]0.327829[/C][/ROW]
[ROW][C]32[/C][C]-0.134235[/C][C]-1.9545[/C][C]0.025979[/C][/ROW]
[ROW][C]33[/C][C]-0.00864[/C][C]-0.1258[/C][C]0.450005[/C][/ROW]
[ROW][C]34[/C][C]0.015098[/C][C]0.2198[/C][C]0.41311[/C][/ROW]
[ROW][C]35[/C][C]-0.061506[/C][C]-0.8955[/C][C]0.185756[/C][/ROW]
[ROW][C]36[/C][C]0.119142[/C][C]1.7347[/C][C]0.04212[/C][/ROW]
[ROW][C]37[/C][C]0.026131[/C][C]0.3805[/C][C]0.351987[/C][/ROW]
[ROW][C]38[/C][C]-0.018626[/C][C]-0.2712[/C][C]0.39325[/C][/ROW]
[ROW][C]39[/C][C]0.013854[/C][C]0.2017[/C][C]0.420166[/C][/ROW]
[ROW][C]40[/C][C]-0.041942[/C][C]-0.6107[/C][C]0.271032[/C][/ROW]
[ROW][C]41[/C][C]0.000861[/C][C]0.0125[/C][C]0.495005[/C][/ROW]
[ROW][C]42[/C][C]-0.040855[/C][C]-0.5949[/C][C]0.276288[/C][/ROW]
[ROW][C]43[/C][C]-0.057985[/C][C]-0.8443[/C][C]0.199734[/C][/ROW]
[ROW][C]44[/C][C]0.015549[/C][C]0.2264[/C][C]0.410558[/C][/ROW]
[ROW][C]45[/C][C]0.173385[/C][C]2.5245[/C][C]0.006159[/C][/ROW]
[ROW][C]46[/C][C]-0.110613[/C][C]-1.6106[/C][C]0.054383[/C][/ROW]
[ROW][C]47[/C][C]0.068025[/C][C]0.9905[/C][C]0.16154[/C][/ROW]
[ROW][C]48[/C][C]0.053378[/C][C]0.7772[/C][C]0.218953[/C][/ROW]
[ROW][C]49[/C][C]0.044755[/C][C]0.6516[/C][C]0.25767[/C][/ROW]
[ROW][C]50[/C][C]-0.020364[/C][C]-0.2965[/C][C]0.383568[/C][/ROW]
[ROW][C]51[/C][C]-0.028023[/C][C]-0.408[/C][C]0.341834[/C][/ROW]
[ROW][C]52[/C][C]-0.136058[/C][C]-1.981[/C][C]0.02444[/C][/ROW]
[ROW][C]53[/C][C]-0.0368[/C][C]-0.5358[/C][C]0.296325[/C][/ROW]
[ROW][C]54[/C][C]0.089473[/C][C]1.3028[/C][C]0.097036[/C][/ROW]
[ROW][C]55[/C][C]-0.010389[/C][C]-0.1513[/C][C]0.439957[/C][/ROW]
[ROW][C]56[/C][C]-0.019368[/C][C]-0.282[/C][C]0.389106[/C][/ROW]
[ROW][C]57[/C][C]-0.103381[/C][C]-1.5053[/C][C]0.066874[/C][/ROW]
[ROW][C]58[/C][C]-0.037608[/C][C]-0.5476[/C][C]0.292279[/C][/ROW]
[ROW][C]59[/C][C]0.000265[/C][C]0.0039[/C][C]0.498462[/C][/ROW]
[ROW][C]60[/C][C]0.087494[/C][C]1.2739[/C][C]0.102041[/C][/ROW]
[/TABLE]
Source: https://freestatistics.org/blog/index.php?pk=310075&T=2

Globally Unique Identifier (entire table): ba.freestatistics.org/blog/index.php?pk=310075&T=2

As an alternative you can also use a QR Code:  

The GUIDs for individual cells are displayed in the table below:

Partial Autocorrelation Function
Time lag kPACF(k)T-STATP-value
10.2037322.96640.001679
2-0.240999-3.5090.000275
30.2421413.52560.000259
4-0.209026-3.04350.001317
50.3524635.13190
60.3416754.97491e-06
7-0.004227-0.06150.475491
80.1696582.47030.007145
9-0.129056-1.87910.030803
10-0.302784-4.40868e-06
110.2852994.1542.4e-05
120.4646826.76590
13-0.126997-1.84910.032918
14-0.244278-3.55670.000232
15-0.164282-2.3920.008815
16-0.049056-0.71430.237924
17-0.112404-1.63660.051596
18-0.082231-1.19730.116263
19-0.100764-1.46710.071909
200.0324780.47290.318388
210.0009450.01380.494516
22-0.054408-0.79220.214568
230.0555960.80950.20957
240.064710.94220.173583
250.0282310.41110.340725
26-0.175271-2.5520.005708
27-0.013624-0.19840.421473
280.0369830.53850.295407
29-0.085805-1.24930.10646
30-0.063763-0.92840.177126
310.0306690.44650.327829
32-0.134235-1.95450.025979
33-0.00864-0.12580.450005
340.0150980.21980.41311
35-0.061506-0.89550.185756
360.1191421.73470.04212
370.0261310.38050.351987
38-0.018626-0.27120.39325
390.0138540.20170.420166
40-0.041942-0.61070.271032
410.0008610.01250.495005
42-0.040855-0.59490.276288
43-0.057985-0.84430.199734
440.0155490.22640.410558
450.1733852.52450.006159
46-0.110613-1.61060.054383
470.0680250.99050.16154
480.0533780.77720.218953
490.0447550.65160.25767
50-0.020364-0.29650.383568
51-0.028023-0.4080.341834
52-0.136058-1.9810.02444
53-0.0368-0.53580.296325
540.0894731.30280.097036
55-0.010389-0.15130.439957
56-0.019368-0.2820.389106
57-0.103381-1.50530.066874
58-0.037608-0.54760.292279
590.0002650.00390.498462
600.0874941.27390.102041


Parameters (Session):
par1 = 60 ; par2 = 1 ; par3 = 0 ; par4 = 0 ; par5 = 12 ; par6 = White Noise ; par7 = 0.95 ;
Parameters (R input):
par1 = 60 ; par2 = 1 ; par3 = 0 ; par4 = 0 ; par5 = 12 ; par6 = White Noise ; par7 = 0.95 ; par8 = ;
R code (references can be found in the software module):
if (par1 == 'Default') {
par1 = 10*log10(length(x))
} else {
par1 <- as.numeric(par1)
}
par2 <- as.numeric(par2)
par3 <- as.numeric(par3)
par4 <- as.numeric(par4)
par5 <- as.numeric(par5)
if (par6 == 'White Noise') par6 <- 'white' else par6 <- 'ma'
par7 <- as.numeric(par7)
if (par8 != '') par8 <- as.numeric(par8)
x <- na.omit(x)
ox <- x
if (par8 == '') {
if (par2 == 0) {
x <- log(x)
} else {
x <- (x ^ par2 - 1) / par2
}
} else {
x <- log(x,base=par8)
}
if (par3 > 0) x <- diff(x,lag=1,difference=par3)
if (par4 > 0) x <- diff(x,lag=par5,difference=par4)
bitmap(file='picts.png')
op <- par(mfrow=c(2,1))
plot(ox,type='l',main='Original Time Series',xlab='time',ylab='value')
if (par8=='') {
mytitle <- paste('Working Time Series (lambda=',par2,', d=',par3,', D=',par4,')',sep='')
mysub <- paste('(lambda=',par2,', d=',par3,', D=',par4,', CI=', par7, ', CI type=',par6,')',sep='')
} else {
mytitle <- paste('Working Time Series (base=',par8,', d=',par3,', D=',par4,')',sep='')
mysub <- paste('(base=',par8,', d=',par3,', D=',par4,', CI=', par7, ', CI type=',par6,')',sep='')
}
plot(x,type='l', main=mytitle,xlab='time',ylab='value')
par(op)
dev.off()
bitmap(file='pic1.png')
racf <- acf(x, par1, main='Autocorrelation', xlab='time lag', ylab='ACF', ci.type=par6, ci=par7, sub=mysub)
dev.off()
bitmap(file='pic2.png')
rpacf <- pacf(x,par1,main='Partial Autocorrelation',xlab='lags',ylab='PACF',sub=mysub)
dev.off()
(myacf <- c(racf$acf))
(mypacf <- c(rpacf$acf))
lengthx <- length(x)
sqrtn <- sqrt(lengthx)
load(file='createtable')
a<-table.start()
a<-table.row.start(a)
a<-table.element(a,'Autocorrelation Function',4,TRUE)
a<-table.row.end(a)
a<-table.row.start(a)
a<-table.element(a,'Time lag k',header=TRUE)
a<-table.element(a,'ACF(k)',header=TRUE)
a<-table.element(a,'T-STAT',header=TRUE)
a<-table.element(a,'P-value',header=TRUE)
a<-table.row.end(a)
for (i in 2:(par1+1)) {
a<-table.row.start(a)
a<-table.element(a,i-1,header=TRUE)
a<-table.element(a,round(myacf[i],6))
mytstat <- myacf[i]*sqrtn
a<-table.element(a,round(mytstat,4))
a<-table.element(a,round(1-pt(abs(mytstat),lengthx),6))
a<-table.row.end(a)
}
a<-table.end(a)
table.save(a,file='mytable.tab')
a<-table.start()
a<-table.row.start(a)
a<-table.element(a,'Partial Autocorrelation Function',4,TRUE)
a<-table.row.end(a)
a<-table.row.start(a)
a<-table.element(a,'Time lag k',header=TRUE)
a<-table.element(a,'PACF(k)',header=TRUE)
a<-table.element(a,'T-STAT',header=TRUE)
a<-table.element(a,'P-value',header=TRUE)
a<-table.row.end(a)
for (i in 1:par1) {
a<-table.row.start(a)
a<-table.element(a,i,header=TRUE)
a<-table.element(a,round(mypacf[i],6))
mytstat <- mypacf[i]*sqrtn
a<-table.element(a,round(mytstat,4))
a<-table.element(a,round(1-pt(abs(mytstat),lengthx),6))
a<-table.row.end(a)
}
a<-table.end(a)
table.save(a,file='mytable1.tab')