Free Statistics
of Irreproducible Research!
Description of Statistical Computation | ||||||||||||||||||||||||||||||
|---|---|---|---|---|---|---|---|---|---|---|---|---|---|---|---|---|---|---|---|---|---|---|---|---|---|---|---|---|---|---|
| Author's title | ||||||||||||||||||||||||||||||
| Author | *The author of this computation has been verified* | |||||||||||||||||||||||||||||
| R Software Module | rwasp_skewness_kurtosis_plot.wasp | |||||||||||||||||||||||||||||
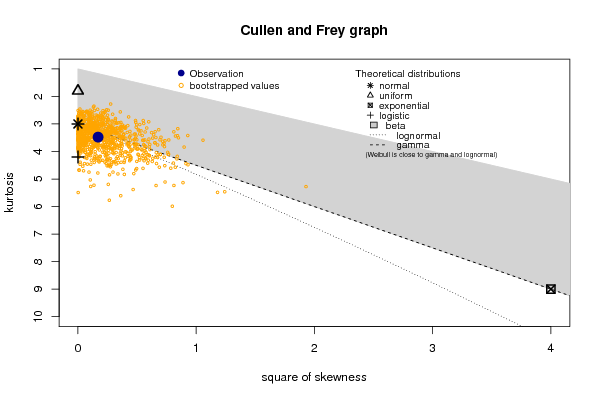
| Title produced by software | Skewness-Kurtosis Plot | |||||||||||||||||||||||||||||
| Date of computation | Sun, 17 Dec 2017 20:23:49 +0100 | |||||||||||||||||||||||||||||
| Cite this page as follows | Statistical Computations at FreeStatistics.org, Office for Research Development and Education, URL https://freestatistics.org/blog/index.php?v=date/2017/Dec/17/t1513538697fr56odyxpry30m7.htm/, Retrieved Wed, 15 May 2024 05:30:54 +0000 | |||||||||||||||||||||||||||||
| Statistical Computations at FreeStatistics.org, Office for Research Development and Education, URL https://freestatistics.org/blog/index.php?pk=310048, Retrieved Wed, 15 May 2024 05:30:54 +0000 | ||||||||||||||||||||||||||||||
| QR Codes: | ||||||||||||||||||||||||||||||
|
| ||||||||||||||||||||||||||||||
| Original text written by user: | ||||||||||||||||||||||||||||||
| IsPrivate? | No (this computation is public) | |||||||||||||||||||||||||||||
| User-defined keywords | ||||||||||||||||||||||||||||||
| Estimated Impact | 44 | |||||||||||||||||||||||||||||
Tree of Dependent Computations | ||||||||||||||||||||||||||||||
| Family? (F = Feedback message, R = changed R code, M = changed R Module, P = changed Parameters, D = changed Data) | ||||||||||||||||||||||||||||||
| - [Skewness-Kurtosis Plot] [Skewness-Curtosis...] [2017-12-17 19:23:49] [0624292ea623603b59620a7164665963] [Current] | ||||||||||||||||||||||||||||||
| Feedback Forum | ||||||||||||||||||||||||||||||
Post a new message | ||||||||||||||||||||||||||||||
Dataset | ||||||||||||||||||||||||||||||
| Dataseries X: | ||||||||||||||||||||||||||||||
0.0235487878787898 0.0418587878787879 -0.00358121212121189 0.0270787878787876 0.0194987878787877 0.0166087878787878 0.0965787878787879 -0.0503712121212122 0.0169158333333333 -0.115401212121212 0.0266287878787878 -0.0516812121212122 0.00680878787878777 0.167138787878788 -0.0688441666666667 0.0514887878787878 0.183518787878788 0.0212887878787878 0.0704787878787878 -0.0631212121212122 -0.0653412121212122 -0.0737612121212121 -0.0501812121212122 -0.0192141666666667 -0.00128416666666665 -0.0187941666666667 0.0308158333333334 0.000558787878787791 -0.00664121212121219 0.0329287878787878 -0.00533121212121216 0.0204387878787878 -0.0359612121212122 -0.0354712121212122 -0.0733112121212122 -0.0124612121212122 -0.0137912121212122 -0.144461212121212 -0.00558121212121224 0.0669258333333333 -0.0472841666666667 0.147755833333333 -0.0645841666666667 -0.0251041666666667 -0.0173041666666667 -0.0629733333333333 0.217066666666667 -0.154093333333333 0.024697142857143 0.128137142857143 0.112557142857143 0.00787714285714293 -0.0626028571428572 -0.0654828571428572 0.208747142857143 -0.0299028571428571 0.0593871428571429 0.0399671428571429 0.0586971428571428 -0.0484028571428572 -0.131672857142857 -0.0768928571428571 -0.0232628571428571 -0.176112857142857 0.167017142857143 -0.112102857142857 0.00392714285714281 0.103857142857143 -0.188432857142857 | ||||||||||||||||||||||||||||||
Tables (Output of Computation) | ||||||||||||||||||||||||||||||
| ||||||||||||||||||||||||||||||
Figures (Output of Computation) | ||||||||||||||||||||||||||||||
Input Parameters & R Code | ||||||||||||||||||||||||||||||
| Parameters (Session): | ||||||||||||||||||||||||||||||
| par1 = 3 ; par2 = Do not include Seasonal Dummies ; par3 = Linear Trend ; par6 = 12 ; | ||||||||||||||||||||||||||||||
| Parameters (R input): | ||||||||||||||||||||||||||||||
| R code (references can be found in the software module): | ||||||||||||||||||||||||||||||
library(fitdistrplus) | ||||||||||||||||||||||||||||||