Free Statistics

of Irreproducible Research!

Author's title

Author*The author of this computation has been verified*
R Software Modulerwasp_autocorrelation.wasp
Title produced by software(Partial) Autocorrelation Function
Date of computationSun, 17 Dec 2017 18:58:54 +0100
Cite this page as followsStatistical Computations at FreeStatistics.org, Office for Research Development and Education, URL https://freestatistics.org/blog/index.php?v=date/2017/Dec/17/t15135335865vbl02wm1rxkja1.htm/, Retrieved Wed, 15 May 2024 13:55:16 +0000
Statistical Computations at FreeStatistics.org, Office for Research Development and Education, URL https://freestatistics.org/blog/index.php?pk=310035, Retrieved Wed, 15 May 2024 13:55:16 +0000
QR Codes:

Original text written by user:
IsPrivate?No (this computation is public)
User-defined keywordsd= 0, D = 0
Estimated Impact68
Family? (F = Feedback message, R = changed R code, M = changed R Module, P = changed Parameters, D = changed Data)
-       [(Partial) Autocorrelation Function] [(partial) autocor...] [2017-12-17 17:58:54] [431300f4593cfe73715ac2c22e82996b] [Current]
Feedback Forum

Post a new message
Dataseries X:
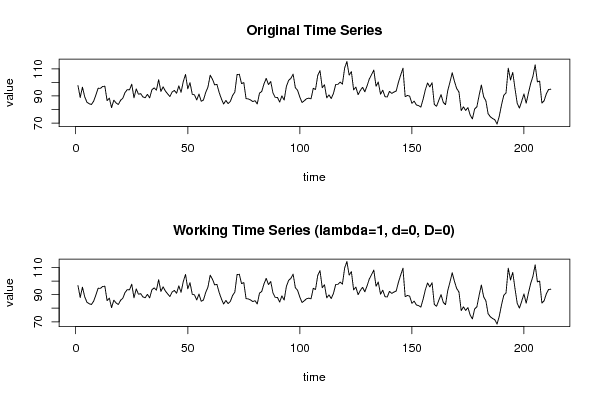
97.7
88.9
96.5
89.5
85.4
84.3
83.7
86.2
90.7
95.7
95.6
97
97.2
86.6
88.4
81.4
86.9
84.9
83.7
86.8
88.3
92.5
94.7
94.5
98.7
88.6
95.2
91.3
91.7
89.3
88.7
91.2
88.6
94.6
96
94.3
102
93.4
96.7
93.7
91.6
89.6
92.9
94.1
92
97.5
92.7
100.7
105.9
95.3
99.8
91.3
90.8
87.1
91.4
86.1
87.1
92.6
96.6
105.3
102.4
98.2
98.6
92.6
87.9
84.1
86.7
84.4
86
90.4
92.9
105.8
106
99.1
99.9
88.1
87.8
87.1
85.9
86.5
84.1
92.1
93.3
98.9
103
98.4
100.7
92.3
89
88.9
85.5
90.1
87
97.1
101.5
103
106.1
96.1
94.2
89.1
85.2
86.5
88
88.4
87.9
95.7
94.8
105.2
108.7
96.1
98.3
88.6
90.8
88.1
91.9
98.5
98.6
100.3
98.7
110.7
115.4
105.4
108
94.5
96.5
91
94.1
96.4
93.1
97.5
102.5
105.7
109.1
97.2
100.3
91.3
94.3
89.5
89.3
93.4
91.9
92.9
93.7
100.1
105.5
110.5
89.5
90.4
89.9
84.6
86.2
83.4
82.9
81.8
87.6
94.6
99.6
96.7
99.8
83.8
82.4
86.8
91
85.3
83.6
94
100.3
107.1
100.7
95.5
92.9
79.2
82
79.3
81.5
76
73.1
80.4
82.1
90.5
98.1
89.5
86.5
77
74.7
73.4
72.5
69.3
75.2
83.5
90.5
92.2
110.5
101.8
107.4
95.5
84.5
81.1
86.2
91.5
84.7
92.2
99.2
104.5
113
100.4
101
84.8
86.5
91.7
94.8
95


Summary of computational transaction
Raw Input view raw input (R code)
Raw Outputview raw output of R engine
Computing time2 seconds
R ServerBig Analytics Cloud Computing Center

\begin{tabular}{lllllllll}
\hline
Summary of computational transaction \tabularnewline
Raw Input view raw input (R code)  \tabularnewline
Raw Outputview raw output of R engine  \tabularnewline
Computing time2 seconds \tabularnewline
R ServerBig Analytics Cloud Computing Center \tabularnewline
\hline
\end{tabular}
%Source: https://freestatistics.org/blog/index.php?pk=310035&T=0

[TABLE]
[ROW]
Summary of computational transaction[/C][/ROW] [ROW]Raw Input[/C] view raw input (R code) [/C][/ROW] [ROW]Raw Output[/C]view raw output of R engine [/C][/ROW] [ROW]Computing time[/C]2 seconds[/C][/ROW] [ROW]R Server[/C]Big Analytics Cloud Computing Center[/C][/ROW] [/TABLE] Source: https://freestatistics.org/blog/index.php?pk=310035&T=0

Globally Unique Identifier (entire table): ba.freestatistics.org/blog/index.php?pk=310035&T=0

As an alternative you can also use a QR Code:  

The GUIDs for individual cells are displayed in the table below:

Summary of computational transaction
Raw Input view raw input (R code)
Raw Outputview raw output of R engine
Computing time2 seconds
R ServerBig Analytics Cloud Computing Center


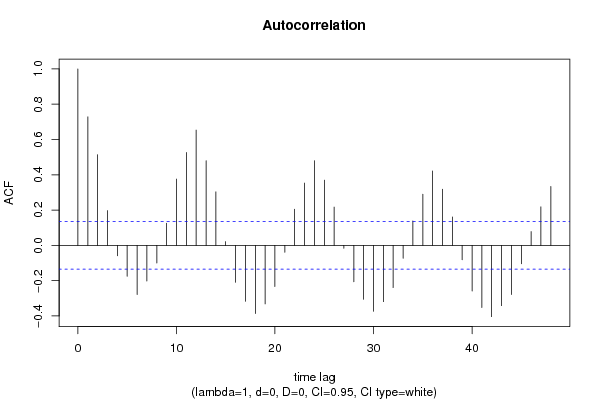
Autocorrelation Function
Time lag kACF(k)T-STATP-value
10.72838110.60540
20.5140617.48480
30.19722.87130.002252
4-0.059208-0.86210.194808
5-0.175103-2.54950.005747
6-0.278611-4.05663.5e-05
7-0.201811-2.93840.001832
8-0.099951-1.45530.073532
90.1257381.83080.03427
100.3755985.46880
110.526087.65980
120.6534979.51510
130.4800396.98950
140.3033684.41718e-06
150.0213480.31080.378114
16-0.209217-3.04630.001306
17-0.316339-4.6064e-06
18-0.385851-5.61810
19-0.331472-4.82631e-06
20-0.232895-3.3910.000415
21-0.039049-0.56860.285126
220.2053082.98930.001563
230.3529385.13890
240.4794676.98110
250.3698015.38440
260.217153.16180.000899
27-0.016535-0.24080.404988
28-0.205797-2.99640.001529
29-0.305564-4.44917e-06
30-0.37323-5.43430
31-0.318862-4.64273e-06
32-0.239186-3.48260.000302
33-0.072863-1.06090.144972
340.1383022.01370.022652
350.2896014.21671.8e-05
360.4218736.14260
370.3186194.63923e-06
380.1613292.3490.009872
39-0.08123-1.18270.119122
40-0.258351-3.76160.000109
41-0.351667-5.12040
42-0.403841-5.880
43-0.341398-4.97081e-06
44-0.278576-4.05613.5e-05
45-0.104573-1.52260.064674
460.0781611.1380.128193
470.2183793.17970.000848
480.3340664.86411e-06

\begin{tabular}{lllllllll}
\hline
Autocorrelation Function \tabularnewline
Time lag k & ACF(k) & T-STAT & P-value \tabularnewline
1 & 0.728381 & 10.6054 & 0 \tabularnewline
2 & 0.514061 & 7.4848 & 0 \tabularnewline
3 & 0.1972 & 2.8713 & 0.002252 \tabularnewline
4 & -0.059208 & -0.8621 & 0.194808 \tabularnewline
5 & -0.175103 & -2.5495 & 0.005747 \tabularnewline
6 & -0.278611 & -4.0566 & 3.5e-05 \tabularnewline
7 & -0.201811 & -2.9384 & 0.001832 \tabularnewline
8 & -0.099951 & -1.4553 & 0.073532 \tabularnewline
9 & 0.125738 & 1.8308 & 0.03427 \tabularnewline
10 & 0.375598 & 5.4688 & 0 \tabularnewline
11 & 0.52608 & 7.6598 & 0 \tabularnewline
12 & 0.653497 & 9.5151 & 0 \tabularnewline
13 & 0.480039 & 6.9895 & 0 \tabularnewline
14 & 0.303368 & 4.4171 & 8e-06 \tabularnewline
15 & 0.021348 & 0.3108 & 0.378114 \tabularnewline
16 & -0.209217 & -3.0463 & 0.001306 \tabularnewline
17 & -0.316339 & -4.606 & 4e-06 \tabularnewline
18 & -0.385851 & -5.6181 & 0 \tabularnewline
19 & -0.331472 & -4.8263 & 1e-06 \tabularnewline
20 & -0.232895 & -3.391 & 0.000415 \tabularnewline
21 & -0.039049 & -0.5686 & 0.285126 \tabularnewline
22 & 0.205308 & 2.9893 & 0.001563 \tabularnewline
23 & 0.352938 & 5.1389 & 0 \tabularnewline
24 & 0.479467 & 6.9811 & 0 \tabularnewline
25 & 0.369801 & 5.3844 & 0 \tabularnewline
26 & 0.21715 & 3.1618 & 0.000899 \tabularnewline
27 & -0.016535 & -0.2408 & 0.404988 \tabularnewline
28 & -0.205797 & -2.9964 & 0.001529 \tabularnewline
29 & -0.305564 & -4.4491 & 7e-06 \tabularnewline
30 & -0.37323 & -5.4343 & 0 \tabularnewline
31 & -0.318862 & -4.6427 & 3e-06 \tabularnewline
32 & -0.239186 & -3.4826 & 0.000302 \tabularnewline
33 & -0.072863 & -1.0609 & 0.144972 \tabularnewline
34 & 0.138302 & 2.0137 & 0.022652 \tabularnewline
35 & 0.289601 & 4.2167 & 1.8e-05 \tabularnewline
36 & 0.421873 & 6.1426 & 0 \tabularnewline
37 & 0.318619 & 4.6392 & 3e-06 \tabularnewline
38 & 0.161329 & 2.349 & 0.009872 \tabularnewline
39 & -0.08123 & -1.1827 & 0.119122 \tabularnewline
40 & -0.258351 & -3.7616 & 0.000109 \tabularnewline
41 & -0.351667 & -5.1204 & 0 \tabularnewline
42 & -0.403841 & -5.88 & 0 \tabularnewline
43 & -0.341398 & -4.9708 & 1e-06 \tabularnewline
44 & -0.278576 & -4.0561 & 3.5e-05 \tabularnewline
45 & -0.104573 & -1.5226 & 0.064674 \tabularnewline
46 & 0.078161 & 1.138 & 0.128193 \tabularnewline
47 & 0.218379 & 3.1797 & 0.000848 \tabularnewline
48 & 0.334066 & 4.8641 & 1e-06 \tabularnewline
\hline
\end{tabular}
%Source: https://freestatistics.org/blog/index.php?pk=310035&T=1

[TABLE]
[ROW][C]Autocorrelation Function[/C][/ROW]
[ROW][C]Time lag k[/C][C]ACF(k)[/C][C]T-STAT[/C][C]P-value[/C][/ROW]
[ROW][C]1[/C][C]0.728381[/C][C]10.6054[/C][C]0[/C][/ROW]
[ROW][C]2[/C][C]0.514061[/C][C]7.4848[/C][C]0[/C][/ROW]
[ROW][C]3[/C][C]0.1972[/C][C]2.8713[/C][C]0.002252[/C][/ROW]
[ROW][C]4[/C][C]-0.059208[/C][C]-0.8621[/C][C]0.194808[/C][/ROW]
[ROW][C]5[/C][C]-0.175103[/C][C]-2.5495[/C][C]0.005747[/C][/ROW]
[ROW][C]6[/C][C]-0.278611[/C][C]-4.0566[/C][C]3.5e-05[/C][/ROW]
[ROW][C]7[/C][C]-0.201811[/C][C]-2.9384[/C][C]0.001832[/C][/ROW]
[ROW][C]8[/C][C]-0.099951[/C][C]-1.4553[/C][C]0.073532[/C][/ROW]
[ROW][C]9[/C][C]0.125738[/C][C]1.8308[/C][C]0.03427[/C][/ROW]
[ROW][C]10[/C][C]0.375598[/C][C]5.4688[/C][C]0[/C][/ROW]
[ROW][C]11[/C][C]0.52608[/C][C]7.6598[/C][C]0[/C][/ROW]
[ROW][C]12[/C][C]0.653497[/C][C]9.5151[/C][C]0[/C][/ROW]
[ROW][C]13[/C][C]0.480039[/C][C]6.9895[/C][C]0[/C][/ROW]
[ROW][C]14[/C][C]0.303368[/C][C]4.4171[/C][C]8e-06[/C][/ROW]
[ROW][C]15[/C][C]0.021348[/C][C]0.3108[/C][C]0.378114[/C][/ROW]
[ROW][C]16[/C][C]-0.209217[/C][C]-3.0463[/C][C]0.001306[/C][/ROW]
[ROW][C]17[/C][C]-0.316339[/C][C]-4.606[/C][C]4e-06[/C][/ROW]
[ROW][C]18[/C][C]-0.385851[/C][C]-5.6181[/C][C]0[/C][/ROW]
[ROW][C]19[/C][C]-0.331472[/C][C]-4.8263[/C][C]1e-06[/C][/ROW]
[ROW][C]20[/C][C]-0.232895[/C][C]-3.391[/C][C]0.000415[/C][/ROW]
[ROW][C]21[/C][C]-0.039049[/C][C]-0.5686[/C][C]0.285126[/C][/ROW]
[ROW][C]22[/C][C]0.205308[/C][C]2.9893[/C][C]0.001563[/C][/ROW]
[ROW][C]23[/C][C]0.352938[/C][C]5.1389[/C][C]0[/C][/ROW]
[ROW][C]24[/C][C]0.479467[/C][C]6.9811[/C][C]0[/C][/ROW]
[ROW][C]25[/C][C]0.369801[/C][C]5.3844[/C][C]0[/C][/ROW]
[ROW][C]26[/C][C]0.21715[/C][C]3.1618[/C][C]0.000899[/C][/ROW]
[ROW][C]27[/C][C]-0.016535[/C][C]-0.2408[/C][C]0.404988[/C][/ROW]
[ROW][C]28[/C][C]-0.205797[/C][C]-2.9964[/C][C]0.001529[/C][/ROW]
[ROW][C]29[/C][C]-0.305564[/C][C]-4.4491[/C][C]7e-06[/C][/ROW]
[ROW][C]30[/C][C]-0.37323[/C][C]-5.4343[/C][C]0[/C][/ROW]
[ROW][C]31[/C][C]-0.318862[/C][C]-4.6427[/C][C]3e-06[/C][/ROW]
[ROW][C]32[/C][C]-0.239186[/C][C]-3.4826[/C][C]0.000302[/C][/ROW]
[ROW][C]33[/C][C]-0.072863[/C][C]-1.0609[/C][C]0.144972[/C][/ROW]
[ROW][C]34[/C][C]0.138302[/C][C]2.0137[/C][C]0.022652[/C][/ROW]
[ROW][C]35[/C][C]0.289601[/C][C]4.2167[/C][C]1.8e-05[/C][/ROW]
[ROW][C]36[/C][C]0.421873[/C][C]6.1426[/C][C]0[/C][/ROW]
[ROW][C]37[/C][C]0.318619[/C][C]4.6392[/C][C]3e-06[/C][/ROW]
[ROW][C]38[/C][C]0.161329[/C][C]2.349[/C][C]0.009872[/C][/ROW]
[ROW][C]39[/C][C]-0.08123[/C][C]-1.1827[/C][C]0.119122[/C][/ROW]
[ROW][C]40[/C][C]-0.258351[/C][C]-3.7616[/C][C]0.000109[/C][/ROW]
[ROW][C]41[/C][C]-0.351667[/C][C]-5.1204[/C][C]0[/C][/ROW]
[ROW][C]42[/C][C]-0.403841[/C][C]-5.88[/C][C]0[/C][/ROW]
[ROW][C]43[/C][C]-0.341398[/C][C]-4.9708[/C][C]1e-06[/C][/ROW]
[ROW][C]44[/C][C]-0.278576[/C][C]-4.0561[/C][C]3.5e-05[/C][/ROW]
[ROW][C]45[/C][C]-0.104573[/C][C]-1.5226[/C][C]0.064674[/C][/ROW]
[ROW][C]46[/C][C]0.078161[/C][C]1.138[/C][C]0.128193[/C][/ROW]
[ROW][C]47[/C][C]0.218379[/C][C]3.1797[/C][C]0.000848[/C][/ROW]
[ROW][C]48[/C][C]0.334066[/C][C]4.8641[/C][C]1e-06[/C][/ROW]
[/TABLE]
Source: https://freestatistics.org/blog/index.php?pk=310035&T=1

Globally Unique Identifier (entire table): ba.freestatistics.org/blog/index.php?pk=310035&T=1

As an alternative you can also use a QR Code:  

The GUIDs for individual cells are displayed in the table below:

Autocorrelation Function
Time lag kACF(k)T-STATP-value
10.72838110.60540
20.5140617.48480
30.19722.87130.002252
4-0.059208-0.86210.194808
5-0.175103-2.54950.005747
6-0.278611-4.05663.5e-05
7-0.201811-2.93840.001832
8-0.099951-1.45530.073532
90.1257381.83080.03427
100.3755985.46880
110.526087.65980
120.6534979.51510
130.4800396.98950
140.3033684.41718e-06
150.0213480.31080.378114
16-0.209217-3.04630.001306
17-0.316339-4.6064e-06
18-0.385851-5.61810
19-0.331472-4.82631e-06
20-0.232895-3.3910.000415
21-0.039049-0.56860.285126
220.2053082.98930.001563
230.3529385.13890
240.4794676.98110
250.3698015.38440
260.217153.16180.000899
27-0.016535-0.24080.404988
28-0.205797-2.99640.001529
29-0.305564-4.44917e-06
30-0.37323-5.43430
31-0.318862-4.64273e-06
32-0.239186-3.48260.000302
33-0.072863-1.06090.144972
340.1383022.01370.022652
350.2896014.21671.8e-05
360.4218736.14260
370.3186194.63923e-06
380.1613292.3490.009872
39-0.08123-1.18270.119122
40-0.258351-3.76160.000109
41-0.351667-5.12040
42-0.403841-5.880
43-0.341398-4.97081e-06
44-0.278576-4.05613.5e-05
45-0.104573-1.52260.064674
460.0781611.1380.128193
470.2183793.17970.000848
480.3340664.86411e-06


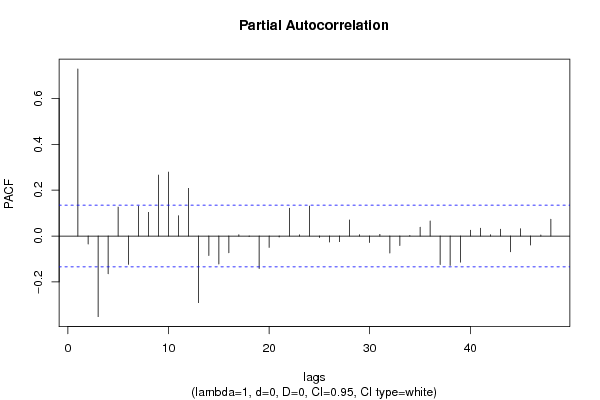
Partial Autocorrelation Function
Time lag kPACF(k)T-STATP-value
10.72838110.60540
2-0.035098-0.5110.304928
3-0.351494-5.11780
4-0.164541-2.39580.008728
50.126041.83520.033941
6-0.123758-1.80190.036488
70.1304751.89970.029412
80.1031091.50130.067385
90.2654513.8657.4e-05
100.2785384.05563.5e-05
110.0882621.28510.100078
120.2078763.02670.001389
13-0.290509-4.22991.7e-05
14-0.084888-1.2360.108914
15-0.122226-1.77960.038283
16-0.072632-1.05750.145736
170.005540.08070.467896
18-0.001651-0.0240.490423
19-0.141914-2.06630.020008
20-0.049627-0.72260.235366
21-0.004543-0.06610.473661
220.1213721.76720.039317
230.0049420.0720.47135
240.1303441.89780.029538
25-0.006359-0.09260.463159
26-0.025746-0.37490.354067
27-0.024365-0.35480.361562
280.0700241.01960.154549
290.0053330.07770.469088
30-0.027932-0.40670.342322
310.0073540.10710.457414
32-0.073994-1.07740.14127
33-0.041709-0.60730.272155
340.0026690.03890.484517
350.0383950.5590.28836
360.0658110.95820.169519
37-0.124201-1.80840.035981
38-0.127867-1.86180.03201
39-0.114-1.65990.049211
400.0254830.3710.355492
410.0340310.49550.310378
420.0053120.07730.469213
430.0293770.42770.334636
44-0.06895-1.00390.158281
450.0320030.4660.32086
46-0.039294-0.57210.283922
470.0044510.06480.474193
480.0731071.06440.144168

\begin{tabular}{lllllllll}
\hline
Partial Autocorrelation Function \tabularnewline
Time lag k & PACF(k) & T-STAT & P-value \tabularnewline
1 & 0.728381 & 10.6054 & 0 \tabularnewline
2 & -0.035098 & -0.511 & 0.304928 \tabularnewline
3 & -0.351494 & -5.1178 & 0 \tabularnewline
4 & -0.164541 & -2.3958 & 0.008728 \tabularnewline
5 & 0.12604 & 1.8352 & 0.033941 \tabularnewline
6 & -0.123758 & -1.8019 & 0.036488 \tabularnewline
7 & 0.130475 & 1.8997 & 0.029412 \tabularnewline
8 & 0.103109 & 1.5013 & 0.067385 \tabularnewline
9 & 0.265451 & 3.865 & 7.4e-05 \tabularnewline
10 & 0.278538 & 4.0556 & 3.5e-05 \tabularnewline
11 & 0.088262 & 1.2851 & 0.100078 \tabularnewline
12 & 0.207876 & 3.0267 & 0.001389 \tabularnewline
13 & -0.290509 & -4.2299 & 1.7e-05 \tabularnewline
14 & -0.084888 & -1.236 & 0.108914 \tabularnewline
15 & -0.122226 & -1.7796 & 0.038283 \tabularnewline
16 & -0.072632 & -1.0575 & 0.145736 \tabularnewline
17 & 0.00554 & 0.0807 & 0.467896 \tabularnewline
18 & -0.001651 & -0.024 & 0.490423 \tabularnewline
19 & -0.141914 & -2.0663 & 0.020008 \tabularnewline
20 & -0.049627 & -0.7226 & 0.235366 \tabularnewline
21 & -0.004543 & -0.0661 & 0.473661 \tabularnewline
22 & 0.121372 & 1.7672 & 0.039317 \tabularnewline
23 & 0.004942 & 0.072 & 0.47135 \tabularnewline
24 & 0.130344 & 1.8978 & 0.029538 \tabularnewline
25 & -0.006359 & -0.0926 & 0.463159 \tabularnewline
26 & -0.025746 & -0.3749 & 0.354067 \tabularnewline
27 & -0.024365 & -0.3548 & 0.361562 \tabularnewline
28 & 0.070024 & 1.0196 & 0.154549 \tabularnewline
29 & 0.005333 & 0.0777 & 0.469088 \tabularnewline
30 & -0.027932 & -0.4067 & 0.342322 \tabularnewline
31 & 0.007354 & 0.1071 & 0.457414 \tabularnewline
32 & -0.073994 & -1.0774 & 0.14127 \tabularnewline
33 & -0.041709 & -0.6073 & 0.272155 \tabularnewline
34 & 0.002669 & 0.0389 & 0.484517 \tabularnewline
35 & 0.038395 & 0.559 & 0.28836 \tabularnewline
36 & 0.065811 & 0.9582 & 0.169519 \tabularnewline
37 & -0.124201 & -1.8084 & 0.035981 \tabularnewline
38 & -0.127867 & -1.8618 & 0.03201 \tabularnewline
39 & -0.114 & -1.6599 & 0.049211 \tabularnewline
40 & 0.025483 & 0.371 & 0.355492 \tabularnewline
41 & 0.034031 & 0.4955 & 0.310378 \tabularnewline
42 & 0.005312 & 0.0773 & 0.469213 \tabularnewline
43 & 0.029377 & 0.4277 & 0.334636 \tabularnewline
44 & -0.06895 & -1.0039 & 0.158281 \tabularnewline
45 & 0.032003 & 0.466 & 0.32086 \tabularnewline
46 & -0.039294 & -0.5721 & 0.283922 \tabularnewline
47 & 0.004451 & 0.0648 & 0.474193 \tabularnewline
48 & 0.073107 & 1.0644 & 0.144168 \tabularnewline
\hline
\end{tabular}
%Source: https://freestatistics.org/blog/index.php?pk=310035&T=2

[TABLE]
[ROW][C]Partial Autocorrelation Function[/C][/ROW]
[ROW][C]Time lag k[/C][C]PACF(k)[/C][C]T-STAT[/C][C]P-value[/C][/ROW]
[ROW][C]1[/C][C]0.728381[/C][C]10.6054[/C][C]0[/C][/ROW]
[ROW][C]2[/C][C]-0.035098[/C][C]-0.511[/C][C]0.304928[/C][/ROW]
[ROW][C]3[/C][C]-0.351494[/C][C]-5.1178[/C][C]0[/C][/ROW]
[ROW][C]4[/C][C]-0.164541[/C][C]-2.3958[/C][C]0.008728[/C][/ROW]
[ROW][C]5[/C][C]0.12604[/C][C]1.8352[/C][C]0.033941[/C][/ROW]
[ROW][C]6[/C][C]-0.123758[/C][C]-1.8019[/C][C]0.036488[/C][/ROW]
[ROW][C]7[/C][C]0.130475[/C][C]1.8997[/C][C]0.029412[/C][/ROW]
[ROW][C]8[/C][C]0.103109[/C][C]1.5013[/C][C]0.067385[/C][/ROW]
[ROW][C]9[/C][C]0.265451[/C][C]3.865[/C][C]7.4e-05[/C][/ROW]
[ROW][C]10[/C][C]0.278538[/C][C]4.0556[/C][C]3.5e-05[/C][/ROW]
[ROW][C]11[/C][C]0.088262[/C][C]1.2851[/C][C]0.100078[/C][/ROW]
[ROW][C]12[/C][C]0.207876[/C][C]3.0267[/C][C]0.001389[/C][/ROW]
[ROW][C]13[/C][C]-0.290509[/C][C]-4.2299[/C][C]1.7e-05[/C][/ROW]
[ROW][C]14[/C][C]-0.084888[/C][C]-1.236[/C][C]0.108914[/C][/ROW]
[ROW][C]15[/C][C]-0.122226[/C][C]-1.7796[/C][C]0.038283[/C][/ROW]
[ROW][C]16[/C][C]-0.072632[/C][C]-1.0575[/C][C]0.145736[/C][/ROW]
[ROW][C]17[/C][C]0.00554[/C][C]0.0807[/C][C]0.467896[/C][/ROW]
[ROW][C]18[/C][C]-0.001651[/C][C]-0.024[/C][C]0.490423[/C][/ROW]
[ROW][C]19[/C][C]-0.141914[/C][C]-2.0663[/C][C]0.020008[/C][/ROW]
[ROW][C]20[/C][C]-0.049627[/C][C]-0.7226[/C][C]0.235366[/C][/ROW]
[ROW][C]21[/C][C]-0.004543[/C][C]-0.0661[/C][C]0.473661[/C][/ROW]
[ROW][C]22[/C][C]0.121372[/C][C]1.7672[/C][C]0.039317[/C][/ROW]
[ROW][C]23[/C][C]0.004942[/C][C]0.072[/C][C]0.47135[/C][/ROW]
[ROW][C]24[/C][C]0.130344[/C][C]1.8978[/C][C]0.029538[/C][/ROW]
[ROW][C]25[/C][C]-0.006359[/C][C]-0.0926[/C][C]0.463159[/C][/ROW]
[ROW][C]26[/C][C]-0.025746[/C][C]-0.3749[/C][C]0.354067[/C][/ROW]
[ROW][C]27[/C][C]-0.024365[/C][C]-0.3548[/C][C]0.361562[/C][/ROW]
[ROW][C]28[/C][C]0.070024[/C][C]1.0196[/C][C]0.154549[/C][/ROW]
[ROW][C]29[/C][C]0.005333[/C][C]0.0777[/C][C]0.469088[/C][/ROW]
[ROW][C]30[/C][C]-0.027932[/C][C]-0.4067[/C][C]0.342322[/C][/ROW]
[ROW][C]31[/C][C]0.007354[/C][C]0.1071[/C][C]0.457414[/C][/ROW]
[ROW][C]32[/C][C]-0.073994[/C][C]-1.0774[/C][C]0.14127[/C][/ROW]
[ROW][C]33[/C][C]-0.041709[/C][C]-0.6073[/C][C]0.272155[/C][/ROW]
[ROW][C]34[/C][C]0.002669[/C][C]0.0389[/C][C]0.484517[/C][/ROW]
[ROW][C]35[/C][C]0.038395[/C][C]0.559[/C][C]0.28836[/C][/ROW]
[ROW][C]36[/C][C]0.065811[/C][C]0.9582[/C][C]0.169519[/C][/ROW]
[ROW][C]37[/C][C]-0.124201[/C][C]-1.8084[/C][C]0.035981[/C][/ROW]
[ROW][C]38[/C][C]-0.127867[/C][C]-1.8618[/C][C]0.03201[/C][/ROW]
[ROW][C]39[/C][C]-0.114[/C][C]-1.6599[/C][C]0.049211[/C][/ROW]
[ROW][C]40[/C][C]0.025483[/C][C]0.371[/C][C]0.355492[/C][/ROW]
[ROW][C]41[/C][C]0.034031[/C][C]0.4955[/C][C]0.310378[/C][/ROW]
[ROW][C]42[/C][C]0.005312[/C][C]0.0773[/C][C]0.469213[/C][/ROW]
[ROW][C]43[/C][C]0.029377[/C][C]0.4277[/C][C]0.334636[/C][/ROW]
[ROW][C]44[/C][C]-0.06895[/C][C]-1.0039[/C][C]0.158281[/C][/ROW]
[ROW][C]45[/C][C]0.032003[/C][C]0.466[/C][C]0.32086[/C][/ROW]
[ROW][C]46[/C][C]-0.039294[/C][C]-0.5721[/C][C]0.283922[/C][/ROW]
[ROW][C]47[/C][C]0.004451[/C][C]0.0648[/C][C]0.474193[/C][/ROW]
[ROW][C]48[/C][C]0.073107[/C][C]1.0644[/C][C]0.144168[/C][/ROW]
[/TABLE]
Source: https://freestatistics.org/blog/index.php?pk=310035&T=2

Globally Unique Identifier (entire table): ba.freestatistics.org/blog/index.php?pk=310035&T=2

As an alternative you can also use a QR Code:  

The GUIDs for individual cells are displayed in the table below:

Partial Autocorrelation Function
Time lag kPACF(k)T-STATP-value
10.72838110.60540
2-0.035098-0.5110.304928
3-0.351494-5.11780
4-0.164541-2.39580.008728
50.126041.83520.033941
6-0.123758-1.80190.036488
70.1304751.89970.029412
80.1031091.50130.067385
90.2654513.8657.4e-05
100.2785384.05563.5e-05
110.0882621.28510.100078
120.2078763.02670.001389
13-0.290509-4.22991.7e-05
14-0.084888-1.2360.108914
15-0.122226-1.77960.038283
16-0.072632-1.05750.145736
170.005540.08070.467896
18-0.001651-0.0240.490423
19-0.141914-2.06630.020008
20-0.049627-0.72260.235366
21-0.004543-0.06610.473661
220.1213721.76720.039317
230.0049420.0720.47135
240.1303441.89780.029538
25-0.006359-0.09260.463159
26-0.025746-0.37490.354067
27-0.024365-0.35480.361562
280.0700241.01960.154549
290.0053330.07770.469088
30-0.027932-0.40670.342322
310.0073540.10710.457414
32-0.073994-1.07740.14127
33-0.041709-0.60730.272155
340.0026690.03890.484517
350.0383950.5590.28836
360.0658110.95820.169519
37-0.124201-1.80840.035981
38-0.127867-1.86180.03201
39-0.114-1.65990.049211
400.0254830.3710.355492
410.0340310.49550.310378
420.0053120.07730.469213
430.0293770.42770.334636
44-0.06895-1.00390.158281
450.0320030.4660.32086
46-0.039294-0.57210.283922
470.0044510.06480.474193
480.0731071.06440.144168


Parameters (Session):
par1 = 48 ; par2 = 1 ; par3 = 0 ; par4 = 0 ; par5 = 12 ; par6 = White Noise ; par7 = 0.95 ;
Parameters (R input):
par1 = 48 ; par2 = 1 ; par3 = 0 ; par4 = 0 ; par5 = 12 ; par6 = White Noise ; par7 = 0.95 ; par8 = ;
R code (references can be found in the software module):
if (par1 == 'Default') {
par1 = 10*log10(length(x))
} else {
par1 <- as.numeric(par1)
}
par2 <- as.numeric(par2)
par3 <- as.numeric(par3)
par4 <- as.numeric(par4)
par5 <- as.numeric(par5)
if (par6 == 'White Noise') par6 <- 'white' else par6 <- 'ma'
par7 <- as.numeric(par7)
if (par8 != '') par8 <- as.numeric(par8)
x <- na.omit(x)
ox <- x
if (par8 == '') {
if (par2 == 0) {
x <- log(x)
} else {
x <- (x ^ par2 - 1) / par2
}
} else {
x <- log(x,base=par8)
}
if (par3 > 0) x <- diff(x,lag=1,difference=par3)
if (par4 > 0) x <- diff(x,lag=par5,difference=par4)
bitmap(file='picts.png')
op <- par(mfrow=c(2,1))
plot(ox,type='l',main='Original Time Series',xlab='time',ylab='value')
if (par8=='') {
mytitle <- paste('Working Time Series (lambda=',par2,', d=',par3,', D=',par4,')',sep='')
mysub <- paste('(lambda=',par2,', d=',par3,', D=',par4,', CI=', par7, ', CI type=',par6,')',sep='')
} else {
mytitle <- paste('Working Time Series (base=',par8,', d=',par3,', D=',par4,')',sep='')
mysub <- paste('(base=',par8,', d=',par3,', D=',par4,', CI=', par7, ', CI type=',par6,')',sep='')
}
plot(x,type='l', main=mytitle,xlab='time',ylab='value')
par(op)
dev.off()
bitmap(file='pic1.png')
racf <- acf(x, par1, main='Autocorrelation', xlab='time lag', ylab='ACF', ci.type=par6, ci=par7, sub=mysub)
dev.off()
bitmap(file='pic2.png')
rpacf <- pacf(x,par1,main='Partial Autocorrelation',xlab='lags',ylab='PACF',sub=mysub)
dev.off()
(myacf <- c(racf$acf))
(mypacf <- c(rpacf$acf))
lengthx <- length(x)
sqrtn <- sqrt(lengthx)
load(file='createtable')
a<-table.start()
a<-table.row.start(a)
a<-table.element(a,'Autocorrelation Function',4,TRUE)
a<-table.row.end(a)
a<-table.row.start(a)
a<-table.element(a,'Time lag k',header=TRUE)
a<-table.element(a,'ACF(k)',header=TRUE)
a<-table.element(a,'T-STAT',header=TRUE)
a<-table.element(a,'P-value',header=TRUE)
a<-table.row.end(a)
for (i in 2:(par1+1)) {
a<-table.row.start(a)
a<-table.element(a,i-1,header=TRUE)
a<-table.element(a,round(myacf[i],6))
mytstat <- myacf[i]*sqrtn
a<-table.element(a,round(mytstat,4))
a<-table.element(a,round(1-pt(abs(mytstat),lengthx),6))
a<-table.row.end(a)
}
a<-table.end(a)
table.save(a,file='mytable.tab')
a<-table.start()
a<-table.row.start(a)
a<-table.element(a,'Partial Autocorrelation Function',4,TRUE)
a<-table.row.end(a)
a<-table.row.start(a)
a<-table.element(a,'Time lag k',header=TRUE)
a<-table.element(a,'PACF(k)',header=TRUE)
a<-table.element(a,'T-STAT',header=TRUE)
a<-table.element(a,'P-value',header=TRUE)
a<-table.row.end(a)
for (i in 1:par1) {
a<-table.row.start(a)
a<-table.element(a,i,header=TRUE)
a<-table.element(a,round(mypacf[i],6))
mytstat <- mypacf[i]*sqrtn
a<-table.element(a,round(mytstat,4))
a<-table.element(a,round(1-pt(abs(mytstat),lengthx),6))
a<-table.row.end(a)
}
a<-table.end(a)
table.save(a,file='mytable1.tab')