Free Statistics

of Irreproducible Research!

Author's title

Author*The author of this computation has been verified*
R Software Modulerwasp_multipleregression.wasp
Title produced by softwareMultiple Regression
Date of computationSun, 17 Dec 2017 16:43:36 +0100
Cite this page as followsStatistical Computations at FreeStatistics.org, Office for Research Development and Education, URL https://freestatistics.org/blog/index.php?v=date/2017/Dec/17/t1513525496j0f0xhayh2exjfd.htm/, Retrieved Wed, 15 May 2024 21:45:04 +0000
Statistical Computations at FreeStatistics.org, Office for Research Development and Education, URL https://freestatistics.org/blog/index.php?pk=310004, Retrieved Wed, 15 May 2024 21:45:04 +0000
QR Codes:

Original text written by user:
IsPrivate?No (this computation is public)
User-defined keywords
Estimated Impact108
Family? (F = Feedback message, R = changed R code, M = changed R Module, P = changed Parameters, D = changed Data)
-       [Multiple Regression] [Regressieanalyse ...] [2017-12-17 15:43:36] [97cb41d201d00a446ae5b9683850817f] [Current]
Feedback Forum

Post a new message
Dataseries X:
1	5	-0,5270
1	4	-0,0906
1	3	0,2587
1	3	0,0979
1	3	0,2428
1	3	0,3605
1	4	-0,2615
1	3	0,1583
1	3	0,2424
1	3	0,1584
1	1	0,3561
1	4	-0,1927
1	4	-0,0613
1	3	0,2063
1	3	0,3436
1	3	0,3194
1	3	-0,0845
1	1	0,4403
1	4	-0,2787
1	3	0,2970
1	4	-0,4848
1	3	0,2320
1	4	-0,3061
1	3	0,1446
1	1	0,4758
1	3	-0,0013
1	4	-0,2226
1	4	-0,2083
1	3	0,0862
1	3	0,2098
1	3	0,2666
1	3	0,2516
1	3	0,1699
1	3	-0,0024
1	4	-0,0622
1	3	0,1190
1	3	0,0620
1	5	-0,6904
1	3	0,0743
1	3	0,0730
1	4	-0,4075
1	4	-0,0808
1	4	-0,2974
1	4	-0,4918
1	1	0,3644
1	1	0,3182
1	3	0,2332
1	4	-0,1547
1	4	-0,3698
1	3	0,1843
1	3	0,3568
1	1	0,3496
1	3	0,1227
1	3	0,3361
1	3	0,2182
1	3	0,0371
1	4	-0,2099
1	3	0,3597
0	3	-0,0412
0	4	-0,1949
0	3	0,0581
0	4	-0,1459
0	4	-0,1076
0	4	-0,1391
0	4	-0,1122
0	3	-0,0660
0	3	0,1389
0	4	-0,2219
0	3	0,2193
0	4	-0,1337
0	1	0,5604
0	1	0,4342
0	1	0,3993
0	3	0,1623
0	4	-0,2995
0	1	0,2825
0	3	0,1293
0	3	0,1486
0	1	0,5319
0	1	0,3116
0	1	0,3521
0	3	0,1707
0	1	0,3869
0	3	0,1626
0	3	0,3188
0	3	0,0276
0	1	0,1824
0	4	-0,4011
0	1	0,4198
0	1	0,1742
0	1	0,3325
0	3	0,1053
0	1	0,4029
0	3	0,1849
0	3	0,0683
0	3	0,2555
0	3	0,0684
0	0	0,5597
0	3	0,2132
0	1	0,2321
0	3	-0,1126
0	0	0,4887
0	3	0,2134
0	3	0,2114
0	4	-0,2381
0	1	0,2630
0	1	0,2860
0	3	0,0171
0	3	0,1407
0	3	0,1733
0	3	0,1558
0	3	-0,0631
0	3	-0,0048
0	1	0,4701
0	1	0,5651
0	3	0,1504
0	3	-0,0021
0	3	0,0549
0	4	-0,2143
0	3	0,0983
0	3	0,0005
0	3	0,1792
0	3	0,1920
0	3	0,1685
0	1	0,3832
0	3	-0,0427
0	1	0,5606
0	3	0,0841
0	1	0,2618
0	1	0,4230
0	1	0,2839
0	1	0,4616
0	3	-0,0158
0	1	0,1611
0	1	0,4772
0	1	0,4335
0	1	0,4172
0	1	0,3517
0	1	0,5083
0	3	-0,0655
0	3	0,0645
0	0	0,5866
0	1	0,5351
0	1	0,4848
0	3	0,2089
0	1	0,4103
0	3	-0,0212
0	1	0,4240
0	0	0,5500
0	3	0,1408
0	1	0,4796
0	3	0,2835
0	3	0,0022
0	1	0,3312
0	4	-0,1140
0	1	0,3434
0	1	0,3028
0	1	0,4168
0	1	0,4772
0	1	0,3695
0	3	-0,0016
0	3	0,0787
0	1	0,2798
0	1	0,5942
0	4	-0,1813
0	4	-0,2211
0	5	-0,4167
0	1	0,3336
0	3	0,2506
0	1	0,3522
0	1	0,4213
0	1	0,5130
0	1	0,2776
0	1	0,4969
0	1	0,2916
0	3	0,2424
0	1	0,4111
0	0	0,6507
0	4	-0,4637
0	3	0,1984
0	1	0,3157
0	3	-0,0314
0	4	-0,1818
0	3	0,2354
0	3	0,1892
0	0	0,5324
0	1	0,5516
0	3	0,2158
0	1	0,2543
0	1	0,3076
0	1	0,4312
0	1	0,4300
0	1	0,3614
0	1	0,6741
0	1	0,3984
0	4	-0,1949
0	1	0,4942
0	0	0,6051
0	1	0,3499
0	1	0,4868
0	1	0,2422
0	3	0,1892
0	3	0,3252
0	0	0,5828
0	1	0,5743
0	5	-0,5352
0	1	0,5198
0	1	0,4462
0	1	0,2251
0	1	0,4167
0	3	0,3393
0	1	0,3297
0	1	0,3814
0	1	0,5686
0	1	0,3391
0	1	0,4708
0	3	-0,0585
0	3	0,1191
0	1	0,2868
0	1	0,2857
0	1	0,2469
0	1	0,2760
0	1	0,2681
0	1	0,5797
0	4	-0,0383
0	1	0,2666
0	1	0,3175
0	3	0,2053
0	1	0,5237
0	3	0,1341
0	3	0,2514
0	3	0,0586
0	4	-0,2218
0	1	0,4833
0	3	0,0854
0	1	0,3942
0	3	0,0725
0	1	0,3395
0	1	0,3621
0	1	0,3605
0	1	0,4553
0	3	-0,0317
0	3	0,2465
0	1	0,4612
0	1	0,3202
0	1	0,5321
0	3	0,0696
0	1	0,5371
0	0	0,5827
0	0	0,5504
0	1	0,3728
0	1	0,2597
0	1	0,2861
0	3	-0,1408
0	1	0,4160
0	3	-0,0640
0	4	-0,1376
0	3	0,2168
0	1	0,3923
0	3	0,1401
0	3	0,2147
0	3	0,2868
0	1	0,4356
0	4	-0,2097
0	3	0,0112
0	4	-0,2479
0	4	-0,2925
0	1	0,4454
0	3	0,1347
0	3	0,1545
0	3	-0,0241
0	3	0,2339
0	1	0,3809
0	1	0,4141
0	1	0,4555
0	1	0,2330
0	3	0,3004
0	3	0,2305
0	3	-0,0249
0	1	0,4927
0	1	0,3191
0	1	0,4386
0	1	0,5716
0	1	0,3862
0	3	-0,0963
0	3	0,0445
0	1	0,4353
0	3	-0,0300
0	1	0,1692
0	1	0,5719
0	1	0,4714
0	1	0,3080
0	3	0,1023
0	3	0,0058
0	1	0,3940
0	3	-0,1088
0	3	-0,0540
0	4	-0,1839
0	4	-0,1239
0	3	-0,1123
0	3	-0,0896
0	4	-0,1135
0	3	-0,0452
0	3	-0,0786
0	3	-0,0012
0	3	0,0917
0	3	-0,0781
0	3	-0,0227
0	3	-0,0570
0	3	0,0134
0	4	-0,0848
0	1	0,2843
0	3	0,1264
0	3	0,2281
0	3	-0,0471
0	5	-0,6570
0	3	0,1808
0	1	0,3200
0	1	0,4128
0	3	0,2115
0	4	-0,0158
0	3	0,1809
0	3	0,2055
0	1	0,4682
0	3	0,2866
0	4	-0,0950
0	3	0,0678
0	4	-0,3354
0	5	-0,6486
0	3	0,0953
0	1	0,3441
0	3	0,2653
0	3	0,2102
0	3	0,2885
0	3	0,1848
0	3	-0,1043
0	4	-0,4793
0	4	-0,2836
0	4	-0,4726
0	4	-0,1791
0	4	-0,3959
0	4	-0,2317
0	4	-0,4160
0	4	-0,2992
0	4	-0,2776
0	3	-0,2189
0	3	-0,0848
0	4	-0,5375
0	3	-0,1429
0	4	-0,2389
0	1	0,3043
0	5	-0,6671
0	3	-0,0302
0	3	0,1948
0	3	0,0059
0	3	0,0867
0	3	0,1104
0	3	0,1105
0	4	-0,0696
0	3	-0,0484
0	3	0,0423
0	3	0,1564
0	3	0,0423
0	3	-0,1531
0	3	0,0591
0	4	-0,0647
0	3	0,1547
0	3	0,2363
0	3	0,1853
0	1	0,3674
0	3	0,1570
0	3	0,1148
0	4	-0,5099
0	3	0,1860
0	3	0,2129
0	3	0,1152
0	3	-0,0295
0	3	0,0909
0	3	-0,0568
0	5	-0,6613
0	3	-0,0052
0	3	0,1245
0	3	-0,1064
0	3	0,1390
0	3	0,1102
0	3	0,2678
0	3	0,0434
0	3	0,0237
0	3	0,1476
0	4	-0,4466
0	3	-0,0189
0	3	0,1378
0	3	0,0073
0	3	0,0708
0	3	-0,0574
0	3	0,2082
0	3	0,1802
0	3	0,0670
0	3	-0,1181
0	3	0,3001
0	3	-0,0095
0	3	0,0094
0	3	0,1734
0	4	-0,3211
0	4	-0,1145
0	3	0,1173
0	3	0,1310
0	3	0,2227
0	4	-0,1803
0	1	0,3138
0	3	0,2001
0	3	0,2337
0	1	0,4059
0	1	0,2000
0	4	-0,1756
0	1	0,2392
0	1	0,5176
0	3	0,2779
0	4	-0,2353
0	3	0,0053
0	3	0,2121
0	3	0,0060
0	3	0,2347
0	3	0,3463
0	1	0,3587
0	1	0,2988
0	1	0,3923
0	3	0,0350
0	1	0,3548
0	3	-0,0002
0	1	0,3481
0	3	0,1044
0	1	0,3269
0	1	0,2309
0	3	0,0204
0	3	0,2542
0	3	0,0353
0	1	0,3479
0	3	0,2073
0	1	0,4199
0	1	0,4902
0	3	0,1626
0	4	-0,3657
0	4	-0,2240
0	3	0,0862
0	3	0,1082
0	1	0,3621
0	4	-0,0487
0	1	0,3584
0	3	0,0234
0	3	0,1756
0	3	-0,0090
0	4	-0,1754
0	3	0,2881
0	3	0,1283
0	1	0,3026
0	4	-0,2721
0	3	-0,0486
0	3	0,0819
0	1	0,3632
0	3	0,0436
0	1	0,3625
0	3	0,1587
0	3	0,2143
0	3	0,1180
0	1	0,3601
0	3	0,1000
0	3	0,0222
0	1	0,3304
0	1	0,2650
0	4	-0,0365
0	1	0,4643
0	3	0,1424
0	1	0,2916
0	3	0,1652
0	3	0,1208
0	4	-0,2749
0	1	0,3942
0	4	-0,3477
0	3	0,2235
0	3	-0,0276
0	3	0,1783
0	3	0,2014
0	3	0,1829
0	3	0,0685
0	3	0,1516
0	1	0,4889
0	3	-0,0419
0	3	-0,0580
0	3	0,2257
0	1	0,3520
0	1	0,3327
0	3	0,1326
0	3	-0,1080
0	1	0,3992
0	1	0,4039
0	1	0,3585
0	3	0,0347
0	3	0,2124
0	3	0,0782
0	1	0,4087
0	4	-0,1200
0	3	0,0214
0	4	-0,2910
0	3	-0,0889
0	3	0,0597
0	3	0,2454
0	1	0,4189
0	3	0,0675
0	1	0,5479
0	3	0,0540
1	1	0,4101
1	4	-0,1791
1	3	0,0133
1	3	-0,1032
1	3	-0,0284
1	3	0,1193
1	1	0,3862
1	3	0,1683
1	3	0,1450
1	3	0,3306
1	3	0,3422
1	1	0,6084
1	1	0,5408
1	4	-0,1507
1	3	0,1205
1	3	0,1898
1	3	0,2660
1	1	0,4668
1	1	0,5824
1	4	-0,1792
1	4	-0,1503
1	3	0,2211
1	1	0,5183
1	3	0,0959
1	1	0,3350
1	4	-0,4501
1	3	0,1150
1	1	0,2804
1	3	0,0184
1	1	0,3154
1	1	0,3345
1	1	0,4233
1	3	0,0362
1	4	-0,0609
1	1	0,4282
1	3	0,1513
0	3	0,3447
0	3	-0,1513
0	1	0,2229
0	3	-0,0272
0	1	0,4681
0	3	0,0662
0	1	0,3277
0	3	0,3271
0	3	-0,0282
0	1	0,2924
0	3	0,0219
0	1	0,3364
0	3	0,0120
0	3	0,0376
0	3	0,0450
0	1	0,2930
0	3	0,2060
0	3	0,1596
0	3	0,2010
0	3	0,1567
0	3	0,2815
0	3	0,0829
0	4	-0,1490
0	3	0,0877
0	4	-0,0842
0	3	-0,0752
0	3	0,2273
0	1	0,4326
0	1	0,5278
0	3	0,0072
0	1	0,3470
0	3	0,1226
0	1	0,3753
0	1	0,4373
0	4	-0,1419
0	3	0,3240
0	3	0,0127
0	3	0,3439
0	3	-0,0262
0	3	-0,0343
0	1	0,3682
0	3	0,2696
0	3	0,0289
0	1	0,4115
0	3	0,0001
0	4	-0,1164
0	3	0,2955
0	3	-0,0107
0	3	0,2078
0	1	0,4393
0	5	-0,6130
0	3	0,1795
0	1	0,4264
0	3	0,0988
0	1	0,4169
0	1	0,2991
0	3	0,2579
0	3	0,2231
0	1	0,3771
0	3	0,2890
0	3	0,2319
0	3	0,1552
0	3	-0,0058
0	3	0,2596
0	3	0,1255
0	3	0,2194
0	3	0,2841
0	4	-0,1890
0	3	-0,1193
0	4	-0,1608
0	4	-0,2750
0	4	-0,1331
0	3	0,1066
0	1	0,3274
0	4	-0,4451
0	1	0,3537
0	4	-0,2848
0	3	0,0727
0	3	0,2157
0	3	0,2290
0	3	0,0080
0	3	0,0488
0	1	0,3031
0	3	0,0007
0	3	0,0374
0	3	-0,0780
0	3	0,0405
0	3	0,0629
0	3	-0,0581
0	3	0,2767
0	3	0,1615
0	4	-0,2402
0	3	0,1271
0	3	0,0863
0	1	0,3365
0	3	0,2287
0	4	-0,2188
0	1	0,2613
0	4	-0,1339
0	3	0,2490
0	3	0,2572
0	3	0,2223
0	4	-0,2619
0	1	0,4511
0	4	-0,1857
0	3	-0,0500
0	4	-0,1631
0	3	0,2613
0	1	0,3829
0	4	-0,3210
0	1	0,4862
0	4	-0,1515
0	1	0,2038
0	1	0,2967
0	3	-0,0169
0	3	0,1146
0	4	-0,3070
0	3	0,3024
0	4	-0,2233
0	4	-0,1848
0	4	-0,0246
0	4	-0,3028
0	3	0,1099
0	4	-0,0851
0	4	-0,1230
0	4	-0,2838
0	4	-0,1192
0	4	-0,0554
0	4	-0,0482
0	4	-0,2518
0	4	-0,3605
0	4	-0,2353
0	3	0,1667
0	3	-0,0208
0	4	-0,3490
0	3	0,1059
0	1	0,3054
0	3	0,2291
0	1	0,3317
0	4	-0,3669
0	1	0,5179
0	3	0,2673
0	3	0,1710
0	1	0,4133
0	1	0,3974
0	1	0,3871
0	1	0,2809
0	4	-0,1750
0	3	-0,0785
0	3	0,0663
0	3	0,2044
0	1	0,3968
0	3	0,0123
0	1	0,3553
0	4	-0,2643
0	3	0,1750
0	4	-0,4532
0	3	0,1487
0	3	0,2585
0	3	0,1618
0	1	0,4967
0	3	-0,0329
0	1	0,3088
0	3	0,2935
0	3	0,1601
0	3	-0,0020
0	3	-0,0231
0	3	0,1509
0	4	-0,1249
0	3	0,0689
0	3	-0,0736
0	3	-0,0335
0	4	-0,3107
0	3	0,2792
0	1	0,2517
0	3	0,1879
0	1	0,2742
0	4	-0,0843
0	1	0,3730
0	4	-0,0930
0	3	0,1502
0	3	0,1728
0	1	0,3693
0	1	0,3009
0	1	0,3140
0	1	0,3421
0	4	-0,1842
0	3	0,1470
0	4	-0,1555
0	1	0,4350
0	3	0,1321
0	3	0,0825
0	3	0,1511
0	1	0,3059
0	3	0,0867
0	3	0,2568
0	3	0,2271
0	3	0,0712
0	3	0,3033
0	3	0,2870
0	3	0,2011
0	1	0,1716
0	4	-0,1542
0	3	0,1218
0	3	0,1877
0	3	0,0950
0	3	0,1023
0	3	0,2408
0	3	0,1322
0	4	0,0935
0	4	-0,0893
0	1	0,3751
0	3	0,1606
0	3	0,2709
0	3	0,0943
0	3	-0,0006
0	1	0,3781
0	4	-0,0461
0	4	-0,2448
0	3	-0,0195
0	3	0,2013
0	3	0,0288
0	3	0,1125
0	3	0,2142
0	3	0,3035
0	1	0,3633
0	5	-0,6245
0	1	0,3117
0	1	0,5569
0	4	-0,2263
0	1	0,4842
0	3	-0,0085
0	3	0,2322
0	3	0,0649
0	3	0,2457
0	3	0,0666
0	3	0,0836
0	3	0,2523
0	4	-0,4137
0	1	0,3109
0	4	-0,0620
0	3	0,1975
0	1	0,4986
0	3	0,0809
0	3	0,2516
0	1	0,3218
0	1	0,3901
0	1	0,3123
0	3	0,0788
0	3	0,2637
0	3	0,2470
0	3	0,2143
0	3	0,0478
0	4	-0,1175
0	4	-0,1230
0	1	0,1658
0	3	0,1897
0	3	0,2427
0	1	0,3355
0	3	0,2917
0	3	0,0093
0	4	-0,0355
0	3	0,1423
0	1	0,1789
0	1	0,3768
0	1	0,3074
1	1	0,4809
1	3	0,2316
1	1	0,3460
1	3	0,2767
1	3	0,0507
1	3	0,0542
1	1	0,4169
1	3	-0,0328
1	3	0,3479
1	3	0,2540
1	1	0,3493
1	1	0,4385
1	1	0,3917
1	3	-0,0624
1	3	0,0405
1	4	-0,2716
1	4	-0,3169
1	3	-0,0446
1	3	0,1471
1	3	0,1083
1	3	0,3247
1	1	0,4036
1	3	-0,0365
1	3	0,2087
1	3	-0,0917
1	3	0,2304
1	3	-0,0241
1	4	-0,3339
1	3	0,0197
1	3	0,0633
1	4	-0,0762
1	3	0,1211
1	3	0,3122
1	4	-0,1325
1	3	0,0684
1	3	0,2686
1	4	-0,0900
1	3	0,0628
1	3	0,2071


Summary of computational transaction
Raw Input view raw input (R code)
Raw Outputview raw output of R engine
Computing time12 seconds
R ServerBig Analytics Cloud Computing Center

\begin{tabular}{lllllllll}
\hline
Summary of computational transaction \tabularnewline
Raw Input view raw input (R code)  \tabularnewline
Raw Outputview raw output of R engine  \tabularnewline
Computing time12 seconds \tabularnewline
R ServerBig Analytics Cloud Computing Center \tabularnewline
\hline
\end{tabular}
%Source: https://freestatistics.org/blog/index.php?pk=310004&T=0

[TABLE]
[ROW]
Summary of computational transaction[/C][/ROW] [ROW]Raw Input[/C] view raw input (R code) [/C][/ROW] [ROW]Raw Output[/C]view raw output of R engine [/C][/ROW] [ROW]Computing time[/C]12 seconds[/C][/ROW] [ROW]R Server[/C]Big Analytics Cloud Computing Center[/C][/ROW] [/TABLE] Source: https://freestatistics.org/blog/index.php?pk=310004&T=0

Globally Unique Identifier (entire table): ba.freestatistics.org/blog/index.php?pk=310004&T=0

As an alternative you can also use a QR Code:  

The GUIDs for individual cells are displayed in the table below:

Summary of computational transaction
Raw Input view raw input (R code)
Raw Outputview raw output of R engine
Computing time12 seconds
R ServerBig Analytics Cloud Computing Center


Multiple Linear Regression - Estimated Regression Equation
ObamaPtKl[t] = + 3.07354 + 0.208492Regio[t] -3.92075PtDiff4[t] + e[t]

\begin{tabular}{lllllllll}
\hline
Multiple Linear Regression - Estimated Regression Equation \tabularnewline
ObamaPtKl[t] =  +  3.07354 +  0.208492Regio[t] -3.92075PtDiff4[t]  + e[t] \tabularnewline
 \tabularnewline
\hline
\end{tabular}
%Source: https://freestatistics.org/blog/index.php?pk=310004&T=1

[TABLE]
[ROW][C]Multiple Linear Regression - Estimated Regression Equation[/C][/ROW]
[ROW][C]ObamaPtKl[t] =  +  3.07354 +  0.208492Regio[t] -3.92075PtDiff4[t]  + e[t][/C][/ROW]
[ROW][C][/C][/ROW]
[/TABLE]
Source: https://freestatistics.org/blog/index.php?pk=310004&T=1

Globally Unique Identifier (entire table): ba.freestatistics.org/blog/index.php?pk=310004&T=1

As an alternative you can also use a QR Code:  

The GUIDs for individual cells are displayed in the table below:

Multiple Linear Regression - Estimated Regression Equation
ObamaPtKl[t] = + 3.07354 + 0.208492Regio[t] -3.92075PtDiff4[t] + e[t]


Multiple Linear Regression - Ordinary Least Squares
VariableParameterS.D.T-STATH0: parameter = 02-tail p-value1-tail p-value
(Intercept)+3.074 0.0259+1.1870e+02 0 0
Regio+0.2085 0.05796+3.5970e+00 0.0003406 0.0001703
PtDiff4-3.921 0.0862-4.5480e+01 8.375e-230 4.187e-230

\begin{tabular}{lllllllll}
\hline
Multiple Linear Regression - Ordinary Least Squares \tabularnewline
Variable & Parameter & S.D. & T-STATH0: parameter = 0 & 2-tail p-value & 1-tail p-value \tabularnewline
(Intercept) & +3.074 &  0.0259 & +1.1870e+02 &  0 &  0 \tabularnewline
Regio & +0.2085 &  0.05796 & +3.5970e+00 &  0.0003406 &  0.0001703 \tabularnewline
PtDiff4 & -3.921 &  0.0862 & -4.5480e+01 &  8.375e-230 &  4.187e-230 \tabularnewline
\hline
\end{tabular}
%Source: https://freestatistics.org/blog/index.php?pk=310004&T=2

[TABLE]
[ROW][C]Multiple Linear Regression - Ordinary Least Squares[/C][/ROW]
[ROW][C]Variable[/C][C]Parameter[/C][C]S.D.[/C][C]T-STATH0: parameter = 0[/C][C]2-tail p-value[/C][C]1-tail p-value[/C][/ROW]
[ROW][C](Intercept)[/C][C]+3.074[/C][C] 0.0259[/C][C]+1.1870e+02[/C][C] 0[/C][C] 0[/C][/ROW]
[ROW][C]Regio[/C][C]+0.2085[/C][C] 0.05796[/C][C]+3.5970e+00[/C][C] 0.0003406[/C][C] 0.0001703[/C][/ROW]
[ROW][C]PtDiff4[/C][C]-3.921[/C][C] 0.0862[/C][C]-4.5480e+01[/C][C] 8.375e-230[/C][C] 4.187e-230[/C][/ROW]
[/TABLE]
Source: https://freestatistics.org/blog/index.php?pk=310004&T=2

Globally Unique Identifier (entire table): ba.freestatistics.org/blog/index.php?pk=310004&T=2

As an alternative you can also use a QR Code:  

The GUIDs for individual cells are displayed in the table below:

Multiple Linear Regression - Ordinary Least Squares
VariableParameterS.D.T-STATH0: parameter = 02-tail p-value1-tail p-value
(Intercept)+3.074 0.0259+1.1870e+02 0 0
Regio+0.2085 0.05796+3.5970e+00 0.0003406 0.0001703
PtDiff4-3.921 0.0862-4.5480e+01 8.375e-230 4.187e-230


Multiple Linear Regression - Regression Statistics
Multiple R 0.844
R-squared 0.7123
Adjusted R-squared 0.7117
F-TEST (value) 1051
F-TEST (DF numerator)2
F-TEST (DF denominator)849
p-value 0
Multiple Linear Regression - Residual Statistics
Residual Standard Deviation 0.6134
Sum Squared Residuals 319.4

\begin{tabular}{lllllllll}
\hline
Multiple Linear Regression - Regression Statistics \tabularnewline
Multiple R &  0.844 \tabularnewline
R-squared &  0.7123 \tabularnewline
Adjusted R-squared &  0.7117 \tabularnewline
F-TEST (value) &  1051 \tabularnewline
F-TEST (DF numerator) & 2 \tabularnewline
F-TEST (DF denominator) & 849 \tabularnewline
p-value &  0 \tabularnewline
Multiple Linear Regression - Residual Statistics \tabularnewline
Residual Standard Deviation &  0.6134 \tabularnewline
Sum Squared Residuals &  319.4 \tabularnewline
\hline
\end{tabular}
%Source: https://freestatistics.org/blog/index.php?pk=310004&T=3

[TABLE]
[ROW][C]Multiple Linear Regression - Regression Statistics[/C][/ROW]
[ROW][C]Multiple R[/C][C] 0.844[/C][/ROW]
[ROW][C]R-squared[/C][C] 0.7123[/C][/ROW]
[ROW][C]Adjusted R-squared[/C][C] 0.7117[/C][/ROW]
[ROW][C]F-TEST (value)[/C][C] 1051[/C][/ROW]
[ROW][C]F-TEST (DF numerator)[/C][C]2[/C][/ROW]
[ROW][C]F-TEST (DF denominator)[/C][C]849[/C][/ROW]
[ROW][C]p-value[/C][C] 0[/C][/ROW]
[ROW][C]Multiple Linear Regression - Residual Statistics[/C][/ROW]
[ROW][C]Residual Standard Deviation[/C][C] 0.6134[/C][/ROW]
[ROW][C]Sum Squared Residuals[/C][C] 319.4[/C][/ROW]
[/TABLE]
Source: https://freestatistics.org/blog/index.php?pk=310004&T=3

Globally Unique Identifier (entire table): ba.freestatistics.org/blog/index.php?pk=310004&T=3

As an alternative you can also use a QR Code:  

The GUIDs for individual cells are displayed in the table below:

Multiple Linear Regression - Regression Statistics
Multiple R 0.844
R-squared 0.7123
Adjusted R-squared 0.7117
F-TEST (value) 1051
F-TEST (DF numerator)2
F-TEST (DF denominator)849
p-value 0
Multiple Linear Regression - Residual Statistics
Residual Standard Deviation 0.6134
Sum Squared Residuals 319.4


Menu of Residual Diagnostics
DescriptionLink
HistogramCompute
Central TendencyCompute
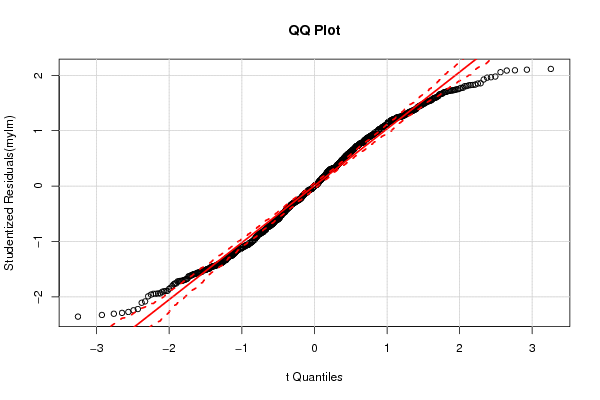
QQ PlotCompute
Kernel Density PlotCompute
Skewness/Kurtosis TestCompute
Skewness-Kurtosis PlotCompute
Harrell-Davis PlotCompute
Bootstrap Plot -- Central TendencyCompute
Blocked Bootstrap Plot -- Central TendencyCompute
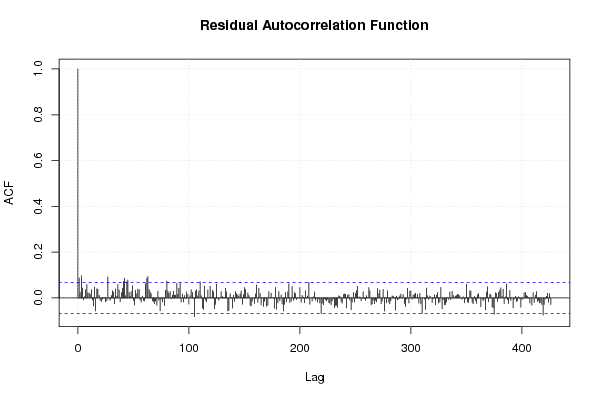
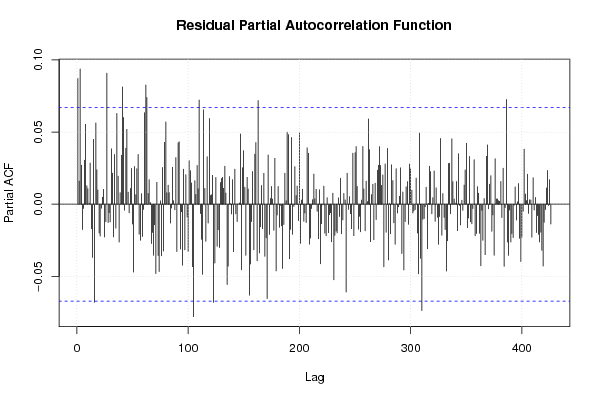
(Partial) Autocorrelation PlotCompute
Spectral AnalysisCompute
Tukey lambda PPCC PlotCompute
Box-Cox Normality PlotCompute
Summary StatisticsCompute

\begin{tabular}{lllllllll}
\hline
Menu of Residual Diagnostics \tabularnewline
Description & Link \tabularnewline
Histogram & Compute \tabularnewline
Central Tendency & Compute \tabularnewline
QQ Plot & Compute \tabularnewline
Kernel Density Plot & Compute \tabularnewline
Skewness/Kurtosis Test & Compute \tabularnewline
Skewness-Kurtosis Plot & Compute \tabularnewline
Harrell-Davis Plot & Compute \tabularnewline
Bootstrap Plot -- Central Tendency & Compute \tabularnewline
Blocked Bootstrap Plot -- Central Tendency & Compute \tabularnewline
(Partial) Autocorrelation Plot & Compute \tabularnewline
Spectral Analysis & Compute \tabularnewline
Tukey lambda PPCC Plot & Compute \tabularnewline
Box-Cox Normality Plot & Compute \tabularnewline
Summary Statistics & Compute \tabularnewline
\hline
\end{tabular}
%Source: https://freestatistics.org/blog/index.php?pk=310004&T=4

[TABLE]
[ROW][C]Menu of Residual Diagnostics[/C][/ROW]
[ROW][C]Description[/C][C]Link[/C][/ROW]
[ROW][C]Histogram[/C][C]Compute[/C][/ROW]
[ROW][C]Central Tendency[/C][C]Compute[/C][/ROW]
[ROW][C]QQ Plot[/C][C]Compute[/C][/ROW]
[ROW][C]Kernel Density Plot[/C][C]Compute[/C][/ROW]
[ROW][C]Skewness/Kurtosis Test[/C][C]Compute[/C][/ROW]
[ROW][C]Skewness-Kurtosis Plot[/C][C]Compute[/C][/ROW]
[ROW][C]Harrell-Davis Plot[/C][C]Compute[/C][/ROW]
[ROW][C]Bootstrap Plot -- Central Tendency[/C][C]Compute[/C][/ROW]
[ROW][C]Blocked Bootstrap Plot -- Central Tendency[/C][C]Compute[/C][/ROW]
[ROW][C](Partial) Autocorrelation Plot[/C][C]Compute[/C][/ROW]
[ROW][C]Spectral Analysis[/C][C]Compute[/C][/ROW]
[ROW][C]Tukey lambda PPCC Plot[/C][C]Compute[/C][/ROW]
[ROW][C]Box-Cox Normality Plot[/C][C]Compute[/C][/ROW]
[ROW][C]Summary Statistics[/C][C]Compute[/C][/ROW]
[/TABLE]
Source: https://freestatistics.org/blog/index.php?pk=310004&T=4

Globally Unique Identifier (entire table): ba.freestatistics.org/blog/index.php?pk=310004&T=4

As an alternative you can also use a QR Code:  

The GUIDs for individual cells are displayed in the table below:

Menu of Residual Diagnostics
DescriptionLink
HistogramCompute
Central TendencyCompute
QQ PlotCompute
Kernel Density PlotCompute
Skewness/Kurtosis TestCompute
Skewness-Kurtosis PlotCompute
Harrell-Davis PlotCompute
Bootstrap Plot -- Central TendencyCompute
Blocked Bootstrap Plot -- Central TendencyCompute
(Partial) Autocorrelation PlotCompute
Spectral AnalysisCompute
Tukey lambda PPCC PlotCompute
Box-Cox Normality PlotCompute
Summary StatisticsCompute


Ramsey RESET F-Test for powers (2 and 3) of fitted values
> reset_test_fitted
	RESET test
data:  mylm
RESET = 64.842, df1 = 2, df2 = 847, p-value < 2.2e-16
Ramsey RESET F-Test for powers (2 and 3) of regressors
> reset_test_regressors
	RESET test
data:  mylm
RESET = 30.888, df1 = 4, df2 = 845, p-value < 2.2e-16
Ramsey RESET F-Test for powers (2 and 3) of principal components
> reset_test_principal_components
	RESET test
data:  mylm
RESET = 30.857, df1 = 2, df2 = 847, p-value = 1.161e-13

\begin{tabular}{lllllllll}
\hline
Ramsey RESET F-Test for powers (2 and 3) of fitted values \tabularnewline
> reset_test_fitted
	RESET test
data:  mylm
RESET = 64.842, df1 = 2, df2 = 847, p-value < 2.2e-16
\tabularnewline Ramsey RESET F-Test for powers (2 and 3) of regressors \tabularnewline
> reset_test_regressors
	RESET test
data:  mylm
RESET = 30.888, df1 = 4, df2 = 845, p-value < 2.2e-16
\tabularnewline Ramsey RESET F-Test for powers (2 and 3) of principal components \tabularnewline
> reset_test_principal_components
	RESET test
data:  mylm
RESET = 30.857, df1 = 2, df2 = 847, p-value = 1.161e-13
\tabularnewline \hline \end{tabular} %Source: https://freestatistics.org/blog/index.php?pk=310004&T=5

[TABLE]
[ROW][C]Ramsey RESET F-Test for powers (2 and 3) of fitted values[/C][/ROW]
[ROW][C]
> reset_test_fitted
	RESET test
data:  mylm
RESET = 64.842, df1 = 2, df2 = 847, p-value < 2.2e-16
[/C][/ROW] [ROW][C]Ramsey RESET F-Test for powers (2 and 3) of regressors[/C][/ROW] [ROW][C]
> reset_test_regressors
	RESET test
data:  mylm
RESET = 30.888, df1 = 4, df2 = 845, p-value < 2.2e-16
[/C][/ROW] [ROW][C]Ramsey RESET F-Test for powers (2 and 3) of principal components[/C][/ROW] [ROW][C]
> reset_test_principal_components
	RESET test
data:  mylm
RESET = 30.857, df1 = 2, df2 = 847, p-value = 1.161e-13
[/C][/ROW] [/TABLE] Source: https://freestatistics.org/blog/index.php?pk=310004&T=5

Globally Unique Identifier (entire table): ba.freestatistics.org/blog/index.php?pk=310004&T=5

As an alternative you can also use a QR Code:  

The GUIDs for individual cells are displayed in the table below:

Ramsey RESET F-Test for powers (2 and 3) of fitted values
> reset_test_fitted
	RESET test
data:  mylm
RESET = 64.842, df1 = 2, df2 = 847, p-value < 2.2e-16
Ramsey RESET F-Test for powers (2 and 3) of regressors
> reset_test_regressors
	RESET test
data:  mylm
RESET = 30.888, df1 = 4, df2 = 845, p-value < 2.2e-16
Ramsey RESET F-Test for powers (2 and 3) of principal components
> reset_test_principal_components
	RESET test
data:  mylm
RESET = 30.857, df1 = 2, df2 = 847, p-value = 1.161e-13


Variance Inflation Factors (Multicollinearity)
> vif
   Regio  PtDiff4 
1.002329 1.002329 

\begin{tabular}{lllllllll}
\hline
Variance Inflation Factors (Multicollinearity) \tabularnewline
> vif
   Regio  PtDiff4 
1.002329 1.002329 
\tabularnewline \hline \end{tabular} %Source: https://freestatistics.org/blog/index.php?pk=310004&T=6

[TABLE]
[ROW][C]Variance Inflation Factors (Multicollinearity)[/C][/ROW]
[ROW][C]
> vif
   Regio  PtDiff4 
1.002329 1.002329 
[/C][/ROW] [/TABLE] Source: https://freestatistics.org/blog/index.php?pk=310004&T=6

Globally Unique Identifier (entire table): ba.freestatistics.org/blog/index.php?pk=310004&T=6

As an alternative you can also use a QR Code:  

The GUIDs for individual cells are displayed in the table below:

Variance Inflation Factors (Multicollinearity)
> vif
   Regio  PtDiff4 
1.002329 1.002329 


Parameters (Session):
Parameters (R input):
par1 = 2 ; par2 = Do not include Seasonal Dummies ; par3 = No Linear Trend ; par4 = ; par5 = ; par6 = 12 ;
R code (references can be found in the software module):
par6 <- '12'
par5 <- ''
par4 <- ''
par3 <- 'No Linear Trend'
par2 <- 'Do not include Seasonal Dummies'
par1 <- '2'
library(lattice)
library(lmtest)
library(car)
library(MASS)
n25 <- 25 #minimum number of obs. for Goldfeld-Quandt test
mywarning <- ''
par6 <- as.numeric(par6)
if(is.na(par6)) {
par6 <- 12
mywarning = 'Warning: you did not specify the seasonality. The seasonal period was set to s = 12.'
}
par1 <- as.numeric(par1)
if(is.na(par1)) {
par1 <- 1
mywarning = 'Warning: you did not specify the column number of the endogenous series! The first column was selected by default.'
}
if (par4=='') par4 <- 0
par4 <- as.numeric(par4)
if (!is.numeric(par4)) par4 <- 0
if (par5=='') par5 <- 0
par5 <- as.numeric(par5)
if (!is.numeric(par5)) par5 <- 0
x <- na.omit(t(y))
k <- length(x[1,])
n <- length(x[,1])
x1 <- cbind(x[,par1], x[,1:k!=par1])
mycolnames <- c(colnames(x)[par1], colnames(x)[1:k!=par1])
colnames(x1) <- mycolnames #colnames(x)[par1]
x <- x1
if (par3 == 'First Differences'){
(n <- n -1)
x2 <- array(0, dim=c(n,k), dimnames=list(1:n, paste('(1-B)',colnames(x),sep='')))
for (i in 1:n) {
for (j in 1:k) {
x2[i,j] <- x[i+1,j] - x[i,j]
}
}
x <- x2
}
if (par3 == 'Seasonal Differences (s)'){
(n <- n - par6)
x2 <- array(0, dim=c(n,k), dimnames=list(1:n, paste('(1-Bs)',colnames(x),sep='')))
for (i in 1:n) {
for (j in 1:k) {
x2[i,j] <- x[i+par6,j] - x[i,j]
}
}
x <- x2
}
if (par3 == 'First and Seasonal Differences (s)'){
(n <- n -1)
x2 <- array(0, dim=c(n,k), dimnames=list(1:n, paste('(1-B)',colnames(x),sep='')))
for (i in 1:n) {
for (j in 1:k) {
x2[i,j] <- x[i+1,j] - x[i,j]
}
}
x <- x2
(n <- n - par6)
x2 <- array(0, dim=c(n,k), dimnames=list(1:n, paste('(1-Bs)',colnames(x),sep='')))
for (i in 1:n) {
for (j in 1:k) {
x2[i,j] <- x[i+par6,j] - x[i,j]
}
}
x <- x2
}
if(par4 > 0) {
x2 <- array(0, dim=c(n-par4,par4), dimnames=list(1:(n-par4), paste(colnames(x)[par1],'(t-',1:par4,')',sep='')))
for (i in 1:(n-par4)) {
for (j in 1:par4) {
x2[i,j] <- x[i+par4-j,par1]
}
}
x <- cbind(x[(par4+1):n,], x2)
n <- n - par4
}
if(par5 > 0) {
x2 <- array(0, dim=c(n-par5*par6,par5), dimnames=list(1:(n-par5*par6), paste(colnames(x)[par1],'(t-',1:par5,'s)',sep='')))
for (i in 1:(n-par5*par6)) {
for (j in 1:par5) {
x2[i,j] <- x[i+par5*par6-j*par6,par1]
}
}
x <- cbind(x[(par5*par6+1):n,], x2)
n <- n - par5*par6
}
if (par2 == 'Include Seasonal Dummies'){
x2 <- array(0, dim=c(n,par6-1), dimnames=list(1:n, paste('M', seq(1:(par6-1)), sep ='')))
for (i in 1:(par6-1)){
x2[seq(i,n,par6),i] <- 1
}
x <- cbind(x, x2)
}
if (par2 == 'Include Monthly Dummies'){
x2 <- array(0, dim=c(n,11), dimnames=list(1:n, paste('M', seq(1:11), sep ='')))
for (i in 1:11){
x2[seq(i,n,12),i] <- 1
}
x <- cbind(x, x2)
}
if (par2 == 'Include Quarterly Dummies'){
x2 <- array(0, dim=c(n,3), dimnames=list(1:n, paste('Q', seq(1:3), sep ='')))
for (i in 1:3){
x2[seq(i,n,4),i] <- 1
}
x <- cbind(x, x2)
}
(k <- length(x[n,]))
if (par3 == 'Linear Trend'){
x <- cbind(x, c(1:n))
colnames(x)[k+1] <- 't'
}
print(x)
(k <- length(x[n,]))
head(x)
df <- as.data.frame(x)
(mylm <- lm(df))
(mysum <- summary(mylm))
if (n > n25) {
kp3 <- k + 3
nmkm3 <- n - k - 3
gqarr <- array(NA, dim=c(nmkm3-kp3+1,3))
numgqtests <- 0
numsignificant1 <- 0
numsignificant5 <- 0
numsignificant10 <- 0
for (mypoint in kp3:nmkm3) {
j <- 0
numgqtests <- numgqtests + 1
for (myalt in c('greater', 'two.sided', 'less')) {
j <- j + 1
gqarr[mypoint-kp3+1,j] <- gqtest(mylm, point=mypoint, alternative=myalt)$p.value
}
if (gqarr[mypoint-kp3+1,2] < 0.01) numsignificant1 <- numsignificant1 + 1
if (gqarr[mypoint-kp3+1,2] < 0.05) numsignificant5 <- numsignificant5 + 1
if (gqarr[mypoint-kp3+1,2] < 0.10) numsignificant10 <- numsignificant10 + 1
}
gqarr
}
bitmap(file='test0.png')
plot(x[,1], type='l', main='Actuals and Interpolation', ylab='value of Actuals and Interpolation (dots)', xlab='time or index')
points(x[,1]-mysum$resid)
grid()
dev.off()
bitmap(file='test1.png')
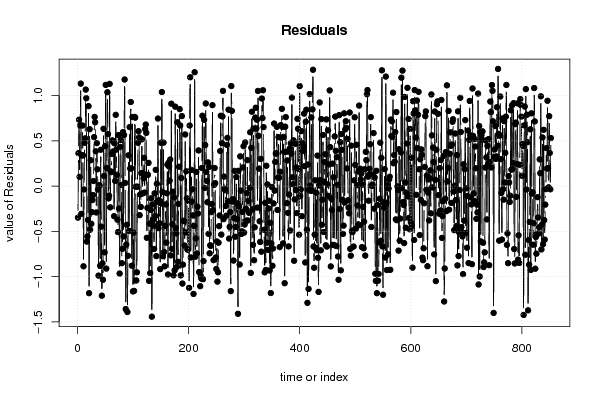
plot(mysum$resid, type='b', pch=19, main='Residuals', ylab='value of Residuals', xlab='time or index')
grid()
dev.off()
bitmap(file='test2.png')
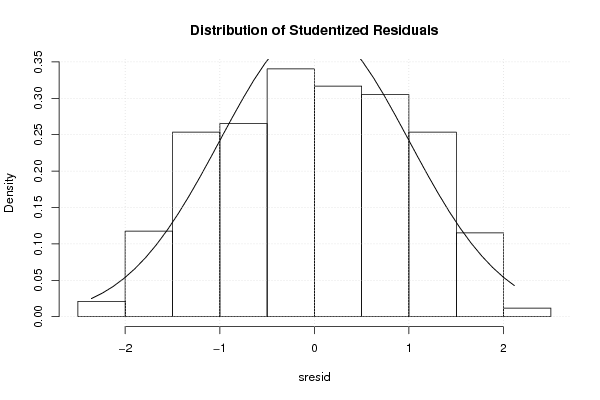
sresid <- studres(mylm)
hist(sresid, freq=FALSE, main='Distribution of Studentized Residuals')
xfit<-seq(min(sresid),max(sresid),length=40)
yfit<-dnorm(xfit)
lines(xfit, yfit)
grid()
dev.off()
bitmap(file='test3.png')
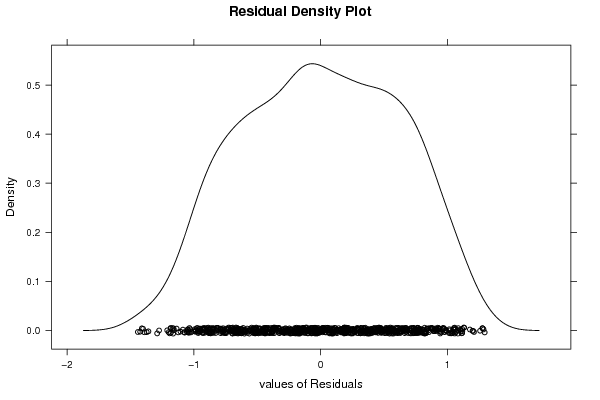
densityplot(~mysum$resid,col='black',main='Residual Density Plot', xlab='values of Residuals')
dev.off()
bitmap(file='test4.png')
qqPlot(mylm, main='QQ Plot')
grid()
dev.off()
(myerror <- as.ts(mysum$resid))
bitmap(file='test5.png')
dum <- cbind(lag(myerror,k=1),myerror)
dum
dum1 <- dum[2:length(myerror),]
dum1
z <- as.data.frame(dum1)
print(z)
plot(z,main=paste('Residual Lag plot, lowess, and regression line'), ylab='values of Residuals', xlab='lagged values of Residuals')
lines(lowess(z))
abline(lm(z))
grid()
dev.off()
bitmap(file='test6.png')
acf(mysum$resid, lag.max=length(mysum$resid)/2, main='Residual Autocorrelation Function')
grid()
dev.off()
bitmap(file='test7.png')
pacf(mysum$resid, lag.max=length(mysum$resid)/2, main='Residual Partial Autocorrelation Function')
grid()
dev.off()
bitmap(file='test8.png')
opar <- par(mfrow = c(2,2), oma = c(0, 0, 1.1, 0))
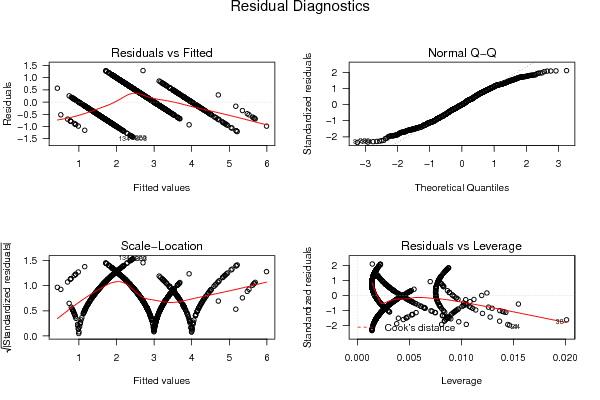
plot(mylm, las = 1, sub='Residual Diagnostics')
par(opar)
dev.off()
if (n > n25) {
bitmap(file='test9.png')
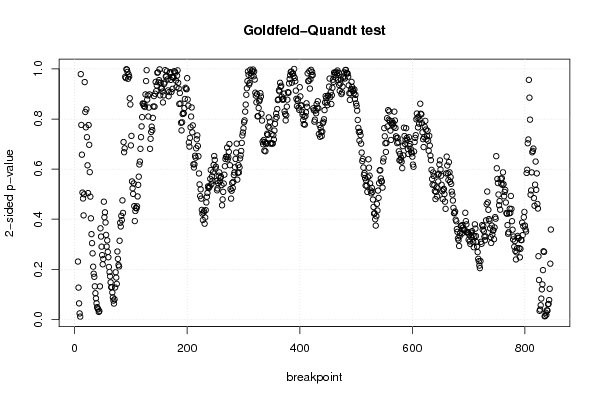
plot(kp3:nmkm3,gqarr[,2], main='Goldfeld-Quandt test',ylab='2-sided p-value',xlab='breakpoint')
grid()
dev.off()
}
load(file='createtable')
a<-table.start()
a<-table.row.start(a)
a<-table.element(a, 'Multiple Linear Regression - Estimated Regression Equation', 1, TRUE)
a<-table.row.end(a)
myeq <- colnames(x)[1]
myeq <- paste(myeq, '[t] = ', sep='')
for (i in 1:k){
if (mysum$coefficients[i,1] > 0) myeq <- paste(myeq, '+', '')
myeq <- paste(myeq, signif(mysum$coefficients[i,1],6), sep=' ')
if (rownames(mysum$coefficients)[i] != '(Intercept)') {
myeq <- paste(myeq, rownames(mysum$coefficients)[i], sep='')
if (rownames(mysum$coefficients)[i] != 't') myeq <- paste(myeq, '[t]', sep='')
}
}
myeq <- paste(myeq, ' + e[t]')
a<-table.row.start(a)
a<-table.element(a, myeq)
a<-table.row.end(a)
a<-table.row.start(a)
a<-table.element(a, mywarning)
a<-table.row.end(a)
a<-table.end(a)
table.save(a,file='mytable1.tab')
a<-table.start()
a<-table.row.start(a)
a<-table.element(a,'Multiple Linear Regression - Ordinary Least Squares', 6, TRUE)
a<-table.row.end(a)
a<-table.row.start(a)
a<-table.element(a,'Variable',header=TRUE)
a<-table.element(a,'Parameter',header=TRUE)
a<-table.element(a,'S.D.',header=TRUE)
a<-table.element(a,'T-STAT
H0: parameter = 0',header=TRUE)
a<-table.element(a,'2-tail p-value',header=TRUE)
a<-table.element(a,'1-tail p-value',header=TRUE)
a<-table.row.end(a)
for (i in 1:k){
a<-table.row.start(a)
a<-table.element(a,rownames(mysum$coefficients)[i],header=TRUE)
a<-table.element(a,formatC(signif(mysum$coefficients[i,1],5),format='g',flag='+'))
a<-table.element(a,formatC(signif(mysum$coefficients[i,2],5),format='g',flag=' '))
a<-table.element(a,formatC(signif(mysum$coefficients[i,3],4),format='e',flag='+'))
a<-table.element(a,formatC(signif(mysum$coefficients[i,4],4),format='g',flag=' '))
a<-table.element(a,formatC(signif(mysum$coefficients[i,4]/2,4),format='g',flag=' '))
a<-table.row.end(a)
}
a<-table.end(a)
table.save(a,file='mytable2.tab')
a<-table.start()
a<-table.row.start(a)
a<-table.element(a, 'Multiple Linear Regression - Regression Statistics', 2, TRUE)
a<-table.row.end(a)
a<-table.row.start(a)
a<-table.element(a, 'Multiple R',1,TRUE)
a<-table.element(a,formatC(signif(sqrt(mysum$r.squared),6),format='g',flag=' '))
a<-table.row.end(a)
a<-table.row.start(a)
a<-table.element(a, 'R-squared',1,TRUE)
a<-table.element(a,formatC(signif(mysum$r.squared,6),format='g',flag=' '))
a<-table.row.end(a)
a<-table.row.start(a)
a<-table.element(a, 'Adjusted R-squared',1,TRUE)
a<-table.element(a,formatC(signif(mysum$adj.r.squared,6),format='g',flag=' '))
a<-table.row.end(a)
a<-table.row.start(a)
a<-table.element(a, 'F-TEST (value)',1,TRUE)
a<-table.element(a,formatC(signif(mysum$fstatistic[1],6),format='g',flag=' '))
a<-table.row.end(a)
a<-table.row.start(a)
a<-table.element(a, 'F-TEST (DF numerator)',1,TRUE)
a<-table.element(a, signif(mysum$fstatistic[2],6))
a<-table.row.end(a)
a<-table.row.start(a)
a<-table.element(a, 'F-TEST (DF denominator)',1,TRUE)
a<-table.element(a, signif(mysum$fstatistic[3],6))
a<-table.row.end(a)
a<-table.row.start(a)
a<-table.element(a, 'p-value',1,TRUE)
a<-table.element(a,formatC(signif(1-pf(mysum$fstatistic[1],mysum$fstatistic[2],mysum$fstatistic[3]),6),format='g',flag=' '))
a<-table.row.end(a)
a<-table.row.start(a)
a<-table.element(a, 'Multiple Linear Regression - Residual Statistics', 2, TRUE)
a<-table.row.end(a)
a<-table.row.start(a)
a<-table.element(a, 'Residual Standard Deviation',1,TRUE)
a<-table.element(a,formatC(signif(mysum$sigma,6),format='g',flag=' '))
a<-table.row.end(a)
a<-table.row.start(a)
a<-table.element(a, 'Sum Squared Residuals',1,TRUE)
a<-table.element(a,formatC(signif(sum(myerror*myerror),6),format='g',flag=' '))
a<-table.row.end(a)
a<-table.end(a)
table.save(a,file='mytable3.tab')
myr <- as.numeric(mysum$resid)
myr
a <-table.start()
a <- table.row.start(a)
a <- table.element(a,'Menu of Residual Diagnostics',2,TRUE)
a <- table.row.end(a)
a <- table.row.start(a)
a <- table.element(a,'Description',1,TRUE)
a <- table.element(a,'Link',1,TRUE)
a <- table.row.end(a)
a <- table.row.start(a)
a <-table.element(a,'Histogram',1,header=TRUE)
a <- table.element(a,hyperlink( paste('https://supernova.wessa.net/rwasp_histogram.wasp?convertgetintopost=1&data=',paste(as.character(mysum$resid),sep='',collapse=' '),sep='') ,'Compute','Click here to examine the Residuals.'),1)
a <- table.row.end(a)
a <- table.row.start(a)
a <-table.element(a,'Central Tendency',1,header=TRUE)
a <- table.element(a,hyperlink( paste('https://supernova.wessa.net/rwasp_centraltendency.wasp?convertgetintopost=1&data=',paste(as.character(mysum$resid),sep='',collapse=' '),sep='') ,'Compute','Click here to examine the Residuals.'),1)
a <- table.row.end(a)
a <- table.row.start(a)
a <-table.element(a,'QQ Plot',1,header=TRUE)
a <- table.element(a,hyperlink( paste('https://supernova.wessa.net/rwasp_fitdistrnorm.wasp?convertgetintopost=1&data=',paste(as.character(mysum$resid),sep='',collapse=' '),sep='') ,'Compute','Click here to examine the Residuals.'),1)
a <- table.row.end(a)
a <- table.row.start(a)
a <-table.element(a,'Kernel Density Plot',1,header=TRUE)
a <- table.element(a,hyperlink( paste('https://supernova.wessa.net/rwasp_density.wasp?convertgetintopost=1&data=',paste(as.character(mysum$resid),sep='',collapse=' '),sep='') ,'Compute','Click here to examine the Residuals.'),1)
a <- table.row.end(a)
a <- table.row.start(a)
a <-table.element(a,'Skewness/Kurtosis Test',1,header=TRUE)
a <- table.element(a,hyperlink( paste('https://supernova.wessa.net/rwasp_skewness_kurtosis.wasp?convertgetintopost=1&data=',paste(as.character(mysum$resid),sep='',collapse=' '),sep='') ,'Compute','Click here to examine the Residuals.'),1)
a <- table.row.end(a)
a <- table.row.start(a)
a <-table.element(a,'Skewness-Kurtosis Plot',1,header=TRUE)
a <- table.element(a,hyperlink( paste('https://supernova.wessa.net/rwasp_skewness_kurtosis_plot.wasp?convertgetintopost=1&data=',paste(as.character(mysum$resid),sep='',collapse=' '),sep='') ,'Compute','Click here to examine the Residuals.'),1)
a <- table.row.end(a)
a <- table.row.start(a)
a <-table.element(a,'Harrell-Davis Plot',1,header=TRUE)
a <- table.element(a,hyperlink( paste('https://supernova.wessa.net/rwasp_harrell_davis.wasp?convertgetintopost=1&data=',paste(as.character(mysum$resid),sep='',collapse=' '),sep='') ,'Compute','Click here to examine the Residuals.'),1)
a <- table.row.end(a)
a <- table.row.start(a)
a <-table.element(a,'Bootstrap Plot -- Central Tendency',1,header=TRUE)
a <- table.element(a,hyperlink( paste('https://supernova.wessa.net/rwasp_bootstrapplot1.wasp?convertgetintopost=1&data=',paste(as.character(mysum$resid),sep='',collapse=' '),sep='') ,'Compute','Click here to examine the Residuals.'),1)
a <- table.row.end(a)
a <- table.row.start(a)
a <-table.element(a,'Blocked Bootstrap Plot -- Central Tendency',1,header=TRUE)
a <- table.element(a,hyperlink( paste('https://supernova.wessa.net/rwasp_bootstrapplot.wasp?convertgetintopost=1&data=',paste(as.character(mysum$resid),sep='',collapse=' '),sep='') ,'Compute','Click here to examine the Residuals.'),1)
a <- table.row.end(a)
a <- table.row.start(a)
a <-table.element(a,'(Partial) Autocorrelation Plot',1,header=TRUE)
a <- table.element(a,hyperlink( paste('https://supernova.wessa.net/rwasp_autocorrelation.wasp?convertgetintopost=1&data=',paste(as.character(mysum$resid),sep='',collapse=' '),sep='') ,'Compute','Click here to examine the Residuals.'),1)
a <- table.row.end(a)
a <- table.row.start(a)
a <-table.element(a,'Spectral Analysis',1,header=TRUE)
a <- table.element(a,hyperlink( paste('https://supernova.wessa.net/rwasp_spectrum.wasp?convertgetintopost=1&data=',paste(as.character(mysum$resid),sep='',collapse=' '),sep='') ,'Compute','Click here to examine the Residuals.'),1)
a <- table.row.end(a)
a <- table.row.start(a)
a <-table.element(a,'Tukey lambda PPCC Plot',1,header=TRUE)
a <- table.element(a,hyperlink( paste('https://supernova.wessa.net/rwasp_tukeylambda.wasp?convertgetintopost=1&data=',paste(as.character(mysum$resid),sep='',collapse=' '),sep='') ,'Compute','Click here to examine the Residuals.'),1)
a <- table.row.end(a)
a <- table.row.start(a)
a <-table.element(a,'Box-Cox Normality Plot',1,header=TRUE)
a <- table.element(a,hyperlink( paste('https://supernova.wessa.net/rwasp_boxcoxnorm.wasp?convertgetintopost=1&data=',paste(as.character(mysum$resid),sep='',collapse=' '),sep='') ,'Compute','Click here to examine the Residuals.'),1)
a <- table.row.end(a)
a <- table.row.start(a)
a <- table.element(a,'Summary Statistics',1,header=TRUE)
a <- table.element(a,hyperlink( paste('https://supernova.wessa.net/rwasp_summary1.wasp?convertgetintopost=1&data=',paste(as.character(mysum$resid),sep='',collapse=' '),sep='') ,'Compute','Click here to examine the Residuals.'),1)
a <- table.row.end(a)
a<-table.end(a)
table.save(a,file='mytable7.tab')
if(n < 200) {
a<-table.start()
a<-table.row.start(a)
a<-table.element(a, 'Multiple Linear Regression - Actuals, Interpolation, and Residuals', 4, TRUE)
a<-table.row.end(a)
a<-table.row.start(a)
a<-table.element(a, 'Time or Index', 1, TRUE)
a<-table.element(a, 'Actuals', 1, TRUE)
a<-table.element(a, 'Interpolation
Forecast', 1, TRUE)
a<-table.element(a, 'Residuals
Prediction Error', 1, TRUE)
a<-table.row.end(a)
for (i in 1:n) {
a<-table.row.start(a)
a<-table.element(a,i, 1, TRUE)
a<-table.element(a,formatC(signif(x[i],6),format='g',flag=' '))
a<-table.element(a,formatC(signif(x[i]-mysum$resid[i],6),format='g',flag=' '))
a<-table.element(a,formatC(signif(mysum$resid[i],6),format='g',flag=' '))
a<-table.row.end(a)
}
a<-table.end(a)
table.save(a,file='mytable4.tab')
if (n > n25) {
a<-table.start()
a<-table.row.start(a)
a<-table.element(a,'Goldfeld-Quandt test for Heteroskedasticity',4,TRUE)
a<-table.row.end(a)
a<-table.row.start(a)
a<-table.element(a,'p-values',header=TRUE)
a<-table.element(a,'Alternative Hypothesis',3,header=TRUE)
a<-table.row.end(a)
a<-table.row.start(a)
a<-table.element(a,'breakpoint index',header=TRUE)
a<-table.element(a,'greater',header=TRUE)
a<-table.element(a,'2-sided',header=TRUE)
a<-table.element(a,'less',header=TRUE)
a<-table.row.end(a)
for (mypoint in kp3:nmkm3) {
a<-table.row.start(a)
a<-table.element(a,mypoint,header=TRUE)
a<-table.element(a,formatC(signif(gqarr[mypoint-kp3+1,1],6),format='g',flag=' '))
a<-table.element(a,formatC(signif(gqarr[mypoint-kp3+1,2],6),format='g',flag=' '))
a<-table.element(a,formatC(signif(gqarr[mypoint-kp3+1,3],6),format='g',flag=' '))
a<-table.row.end(a)
}
a<-table.end(a)
table.save(a,file='mytable5.tab')
a<-table.start()
a<-table.row.start(a)
a<-table.element(a,'Meta Analysis of Goldfeld-Quandt test for Heteroskedasticity',4,TRUE)
a<-table.row.end(a)
a<-table.row.start(a)
a<-table.element(a,'Description',header=TRUE)
a<-table.element(a,'# significant tests',header=TRUE)
a<-table.element(a,'% significant tests',header=TRUE)
a<-table.element(a,'OK/NOK',header=TRUE)
a<-table.row.end(a)
a<-table.row.start(a)
a<-table.element(a,'1% type I error level',header=TRUE)
a<-table.element(a,signif(numsignificant1,6))
a<-table.element(a,formatC(signif(numsignificant1/numgqtests,6),format='g',flag=' '))
if (numsignificant1/numgqtests < 0.01) dum <- 'OK' else dum <- 'NOK'
a<-table.element(a,dum)
a<-table.row.end(a)
a<-table.row.start(a)
a<-table.element(a,'5% type I error level',header=TRUE)
a<-table.element(a,signif(numsignificant5,6))
a<-table.element(a,signif(numsignificant5/numgqtests,6))
if (numsignificant5/numgqtests < 0.05) dum <- 'OK' else dum <- 'NOK'
a<-table.element(a,dum)
a<-table.row.end(a)
a<-table.row.start(a)
a<-table.element(a,'10% type I error level',header=TRUE)
a<-table.element(a,signif(numsignificant10,6))
a<-table.element(a,signif(numsignificant10/numgqtests,6))
if (numsignificant10/numgqtests < 0.1) dum <- 'OK' else dum <- 'NOK'
a<-table.element(a,dum)
a<-table.row.end(a)
a<-table.end(a)
table.save(a,file='mytable6.tab')
}
}
a<-table.start()
a<-table.row.start(a)
a<-table.element(a,'Ramsey RESET F-Test for powers (2 and 3) of fitted values',1,TRUE)
a<-table.row.end(a)
a<-table.row.start(a)
reset_test_fitted <- resettest(mylm,power=2:3,type='fitted')
a<-table.element(a,paste('
',RC.texteval('reset_test_fitted'),'
',sep=''))
a<-table.row.end(a)
a<-table.row.start(a)
a<-table.element(a,'Ramsey RESET F-Test for powers (2 and 3) of regressors',1,TRUE)
a<-table.row.end(a)
a<-table.row.start(a)
reset_test_regressors <- resettest(mylm,power=2:3,type='regressor')
a<-table.element(a,paste('
',RC.texteval('reset_test_regressors'),'
',sep=''))
a<-table.row.end(a)
a<-table.row.start(a)
a<-table.element(a,'Ramsey RESET F-Test for powers (2 and 3) of principal components',1,TRUE)
a<-table.row.end(a)
a<-table.row.start(a)
reset_test_principal_components <- resettest(mylm,power=2:3,type='princomp')
a<-table.element(a,paste('
',RC.texteval('reset_test_principal_components'),'
',sep=''))
a<-table.row.end(a)
a<-table.end(a)
table.save(a,file='mytable8.tab')
a<-table.start()
a<-table.row.start(a)
a<-table.element(a,'Variance Inflation Factors (Multicollinearity)',1,TRUE)
a<-table.row.end(a)
a<-table.row.start(a)
vif <- vif(mylm)
a<-table.element(a,paste('
',RC.texteval('vif'),'
',sep=''))
a<-table.row.end(a)
a<-table.end(a)
table.save(a,file='mytable9.tab')