Free Statistics

of Irreproducible Research!

Author's title

Author*The author of this computation has been verified*
R Software Modulerwasp_Simple Regression Y ~ X.wasp
Title produced by softwareSimple Linear Regression
Date of computationSun, 17 Dec 2017 11:55:43 +0100
Cite this page as followsStatistical Computations at FreeStatistics.org, Office for Research Development and Education, URL https://freestatistics.org/blog/index.php?v=date/2017/Dec/17/t1513508340cdkr6wd37styujn.htm/, Retrieved Wed, 15 May 2024 05:15:22 +0000
Statistical Computations at FreeStatistics.org, Office for Research Development and Education, URL https://freestatistics.org/blog/index.php?pk=309956, Retrieved Wed, 15 May 2024 05:15:22 +0000
QR Codes:

Original text written by user:
IsPrivate?No (this computation is public)
User-defined keywords
Estimated Impact129
Family? (F = Feedback message, R = changed R code, M = changed R Module, P = changed Parameters, D = changed Data)
-       [Simple Linear Regression] [] [2017-12-17 10:55:43] [9a0500678ac6582dde72933c6904687c] [Current]
Feedback Forum

Post a new message
Dataseries X:
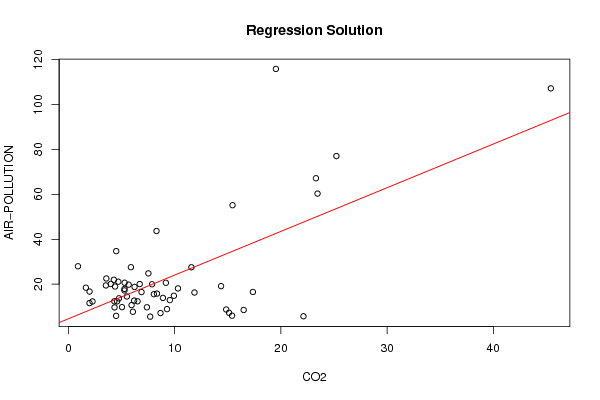
9.270945132	8.875483039
15.39859985	5.932051308
6.87371322	16.45924852
4.478182178	5.860588073
4.311562994	12.37209228
8.889370395	13.86261171
5.935712482	10.65521002
10.30633191	18.0980605
9.920138075	14.8193533
7.378117809	9.694570008
6.059657407	7.697073981
15.1132392	7.244536517
16.49366613	8.498542509
11.85752777	16.25309454
5.260352041	17.20774014
7.686575825	5.516300044
6.49744049	12.36645562
9.538706103	12.90119799
11.57034541	27.51764649
7.863181348	19.94741583
17.36212137	16.51841848
4.572088353	12.32044895
8.328159898	15.78042979
6.701957705	20.03426999
5.661581328	19.76513025
6.213686845	18.74940754
5.270866786	17.90572685
8.660721243	7.116471102
5.033824487	9.751187601
9.165978376	20.60073498
6.180337268	12.6601089
22.12470124	5.690909112
14.84881917	8.70329887
5.491524789	14.50619675
45.42323996	107.2304966
7.517151585	24.80509571
4.378090123	18.94196512
4.687376624	21.08723658
19.5292718	115.8722779
4.331554028	9.646636615
23.30202251	67.17545852
4.265574976	21.94633745
4.746797455	13.67861608
3.973804906	20.06918657
23.44975483	60.33412401
3.55607179	22.53063554
3.516153691	19.43552428
25.22386443	77.05769694
15.44316719	55.16104736
1.973150822	11.55973144
5.871615869	27.53486186
14.36238966	19.12674537
8.032991579	15.53289658
2.254311363	12.28873475
1.630951062	18.4170098
5.282521917	20.626713
8.283020787	43.67268667
4.491479026	34.71083264
0.885545809	27.96620125
1.978763312	16.69960729


Summary of computational transaction
Raw Input view raw input (R code)
Raw Outputview raw output of R engine
Computing time6 seconds
R ServerBig Analytics Cloud Computing Center

\begin{tabular}{lllllllll}
\hline
Summary of computational transaction \tabularnewline
Raw Input view raw input (R code)  \tabularnewline
Raw Outputview raw output of R engine  \tabularnewline
Computing time6 seconds \tabularnewline
R ServerBig Analytics Cloud Computing Center \tabularnewline
\hline
\end{tabular}
%Source: https://freestatistics.org/blog/index.php?pk=309956&T=0

[TABLE]
[ROW]
Summary of computational transaction[/C][/ROW] [ROW]Raw Input[/C] view raw input (R code) [/C][/ROW] [ROW]Raw Output[/C]view raw output of R engine [/C][/ROW] [ROW]Computing time[/C]6 seconds[/C][/ROW] [ROW]R Server[/C]Big Analytics Cloud Computing Center[/C][/ROW] [/TABLE] Source: https://freestatistics.org/blog/index.php?pk=309956&T=0

Globally Unique Identifier (entire table): ba.freestatistics.org/blog/index.php?pk=309956&T=0

As an alternative you can also use a QR Code:  

The GUIDs for individual cells are displayed in the table below:

Summary of computational transaction
Raw Input view raw input (R code)
Raw Outputview raw output of R engine
Computing time6 seconds
R ServerBig Analytics Cloud Computing Center


Linear Regression Model
Y ~ X
coefficients:
EstimateStd. Errort valuePr(>|t|)
(Intercept)4.5963.4291.340.185
X1.9460.2896.7220
- - -
Residual Std. Err. 16.611 on 58 df
Multiple R-sq. 0.438
95% CI Multiple R-sq. [0.11, 0.764]
Adjusted R-sq. 0.428

\begin{tabular}{lllllllll}
\hline
Linear Regression Model \tabularnewline
Y ~ X \tabularnewline
coefficients: &   \tabularnewline
  & Estimate & Std. Error & t value & Pr(>|t|) \tabularnewline
(Intercept) & 4.596 & 3.429 & 1.34 & 0.185 \tabularnewline
X & 1.946 & 0.289 & 6.722 & 0 \tabularnewline
- - -  &   \tabularnewline
Residual Std. Err.  & 16.611  on  58 df \tabularnewline
Multiple R-sq.  & 0.438 \tabularnewline
95% CI Multiple R-sq.  & [0.11, 0.764] \tabularnewline
Adjusted R-sq.  & 0.428 \tabularnewline
\hline
\end{tabular}
%Source: https://freestatistics.org/blog/index.php?pk=309956&T=1

[TABLE]
[ROW][C]Linear Regression Model[/C][/ROW]
[ROW][C]Y ~ X[/C][/ROW]
[ROW][C]coefficients:[/C][C] [/C][/ROW]
[ROW][C] [/C][C]Estimate[/C][C]Std. Error[/C][C]t value[/C][C]Pr(>|t|)[/C][/ROW]
[C](Intercept)[/C][C]4.596[/C][C]3.429[/C][C]1.34[/C][C]0.185[/C][/ROW]
[C]X[/C][C]1.946[/C][C]0.289[/C][C]6.722[/C][C]0[/C][/ROW]
[ROW][C]- - - [/C][C] [/C][/ROW]
[ROW][C]Residual Std. Err. [/C][C]16.611  on  58 df[/C][/ROW]
[ROW][C]Multiple R-sq. [/C][C]0.438[/C][/ROW]
[ROW][C]95% CI Multiple R-sq. [/C][C][0.11, 0.764][/C][/ROW]
[ROW][C]Adjusted R-sq. [/C][C]0.428[/C][/ROW]
[/TABLE]
Source: https://freestatistics.org/blog/index.php?pk=309956&T=1

Globally Unique Identifier (entire table): ba.freestatistics.org/blog/index.php?pk=309956&T=1

As an alternative you can also use a QR Code:  

The GUIDs for individual cells are displayed in the table below:

Linear Regression Model
Y ~ X
coefficients:
EstimateStd. Errort valuePr(>|t|)
(Intercept)4.5963.4291.340.185
X1.9460.2896.7220
- - -
Residual Std. Err. 16.611 on 58 df
Multiple R-sq. 0.438
95% CI Multiple R-sq. [0.11, 0.764]
Adjusted R-sq. 0.428


ANOVA Statistics
DfSum SqMean SqF valuePr(>F)
CO2112466.59212466.59245.1830
Residuals5816003.062275.915

\begin{tabular}{lllllllll}
\hline
ANOVA Statistics \tabularnewline
  & Df & Sum Sq & Mean Sq & F value & Pr(>F) \tabularnewline
CO2 & 1 & 12466.592 & 12466.592 & 45.183 & 0 \tabularnewline
Residuals & 58 & 16003.062 & 275.915 &   &   \tabularnewline
\hline
\end{tabular}
%Source: https://freestatistics.org/blog/index.php?pk=309956&T=2

[TABLE]
[ROW][C]ANOVA Statistics[/C][/ROW]
[ROW][C] [/C][C]Df[/C][C]Sum Sq[/C][C]Mean Sq[/C][C]F value[/C][C]Pr(>F)[/C][/ROW]
[ROW][C]CO2[/C][C]1[/C][C]12466.592[/C][C]12466.592[/C][C]45.183[/C][C]0[/C][/ROW]
[ROW][C]Residuals[/C][C]58[/C][C]16003.062[/C][C]275.915[/C][C] [/C][C] [/C][/ROW]
[/TABLE]
Source: https://freestatistics.org/blog/index.php?pk=309956&T=2

Globally Unique Identifier (entire table): ba.freestatistics.org/blog/index.php?pk=309956&T=2

As an alternative you can also use a QR Code:  

The GUIDs for individual cells are displayed in the table below:

ANOVA Statistics
DfSum SqMean SqF valuePr(>F)
CO2112466.59212466.59245.1830
Residuals5816003.062275.915


Parameters (Session):
par1 = 2 ; par2 = 1 ; par3 = TRUE ;
Parameters (R input):
par1 = 2 ; par2 = 1 ; par3 = TRUE ;
R code (references can be found in the software module):
library(boot)
cat1 <- as.numeric(par1)
cat2<- as.numeric(par2)
intercept<-as.logical(par3)
x <- na.omit(t(x))
rsq <- function(formula, data, indices) {
d <- data[indices,] # allows boot to select sample
fit <- lm(formula, data=d)
return(summary(fit)$r.square)
}
xdf<-data.frame(na.omit(t(y)))
(V1<-dimnames(y)[[1]][cat1])
(V2<-dimnames(y)[[1]][cat2])
xdf <- data.frame(xdf[[cat1]], xdf[[cat2]])
names(xdf)<-c('Y', 'X')
if(intercept == FALSE) (lmxdf<-lm(Y~ X - 1, data = xdf) ) else (lmxdf<-lm(Y~ X, data = xdf) )
(results <- boot(data=xdf, statistic=rsq, R=1000, formula=Y~X))
sumlmxdf<-summary(lmxdf)
(aov.xdf<-aov(lmxdf) )
(anova.xdf<-anova(lmxdf) )
load(file='createtable')
a<-table.start()
nc <- ncol(sumlmxdf$'coefficients')
nr <- nrow(sumlmxdf$'coefficients')
a<-table.row.start(a)
a<-table.element(a,'Linear Regression Model', nc+1,TRUE)
a<-table.row.end(a)
a<-table.row.start(a)
a<-table.element(a, lmxdf$call['formula'],nc+1)
a<-table.row.end(a)
a<-table.row.start(a)
a<-table.element(a, 'coefficients:',1,TRUE)
a<-table.element(a, ' ',nc,TRUE)
a<-table.row.end(a)
a<-table.row.start(a)
a<-table.element(a, ' ',1,TRUE)
for(i in 1 : nc){
a<-table.element(a, dimnames(sumlmxdf$'coefficients')[[2]][i],1,TRUE)
}#end header
a<-table.row.end(a)
for(i in 1: nr){
a<-table.element(a,dimnames(sumlmxdf$'coefficients')[[1]][i] ,1,TRUE)
for(j in 1 : nc){
a<-table.element(a, round(sumlmxdf$coefficients[i, j], digits=3), 1 ,FALSE)
}
a<-table.row.end(a)
}
a<-table.row.start(a)
a<-table.element(a, '- - - ',1,TRUE)
a<-table.element(a, ' ',nc,FALSE)
a<-table.row.end(a)
a<-table.row.start(a)
a<-table.element(a, 'Residual Std. Err. ',1,TRUE)
a<-table.element(a, paste(round(sumlmxdf$'sigma', digits=3), ' on ', sumlmxdf$'df'[2], 'df') ,nc, FALSE)
a<-table.row.end(a)
a<-table.row.start(a)
a<-table.element(a, 'Multiple R-sq. ',1,TRUE)
a<-table.element(a, round(sumlmxdf$'r.squared', digits=3) ,nc, FALSE)
a<-table.row.end(a)
a<-table.row.start(a)
a<-table.element(a, '95% CI Multiple R-sq. ',1,TRUE)
a<-table.element(a, paste('[',round(boot.ci(results,type='bca')$bca[1,4], digits=3),', ', round(boot.ci(results,type='bca')$bca[1,5], digits=3), ']',sep='') ,nc, FALSE)
a<-table.row.end(a)
a<-table.row.start(a)
a<-table.element(a, 'Adjusted R-sq. ',1,TRUE)
a<-table.element(a, round(sumlmxdf$'adj.r.squared', digits=3) ,nc, FALSE)
a<-table.row.end(a)
a<-table.end(a)
table.save(a,file='mytable.tab')
a<-table.start()
a<-table.row.start(a)
a<-table.element(a,'ANOVA Statistics', 5+1,TRUE)
a<-table.row.end(a)
a<-table.row.start(a)
a<-table.element(a, ' ',1,TRUE)
a<-table.element(a, 'Df',1,TRUE)
a<-table.element(a, 'Sum Sq',1,TRUE)
a<-table.element(a, 'Mean Sq',1,TRUE)
a<-table.element(a, 'F value',1,TRUE)
a<-table.element(a, 'Pr(>F)',1,TRUE)
a<-table.row.end(a)
a<-table.row.start(a)
a<-table.element(a, V2,1,TRUE)
a<-table.element(a, anova.xdf$Df[1])
a<-table.element(a, round(anova.xdf$'Sum Sq'[1], digits=3))
a<-table.element(a, round(anova.xdf$'Mean Sq'[1], digits=3))
a<-table.element(a, round(anova.xdf$'F value'[1], digits=3))
a<-table.element(a, round(anova.xdf$'Pr(>F)'[1], digits=3))
a<-table.row.end(a)
a<-table.row.start(a)
a<-table.element(a, 'Residuals',1,TRUE)
a<-table.element(a, anova.xdf$Df[2])
a<-table.element(a, round(anova.xdf$'Sum Sq'[2], digits=3))
a<-table.element(a, round(anova.xdf$'Mean Sq'[2], digits=3))
a<-table.element(a, ' ')
a<-table.row.end(a)
a<-table.end(a)
table.save(a,file='mytable1.tab')
bitmap(file='regressionplot.png')
plot(Y~ X, data=xdf, xlab=V2, ylab=V1, main='Regression Solution')
if(intercept == TRUE) abline(coef(lmxdf), col='red')
if(intercept == FALSE) abline(0.0, coef(lmxdf), col='red')
dev.off()
library(car)
bitmap(file='residualsQQplot.png')
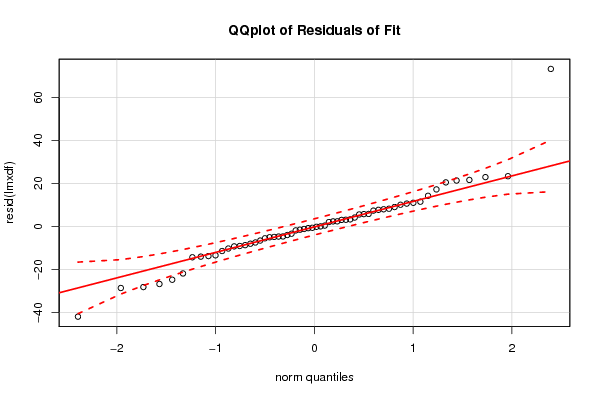
qqPlot(resid(lmxdf), main='QQplot of Residuals of Fit')
dev.off()
bitmap(file='residualsplot.png')
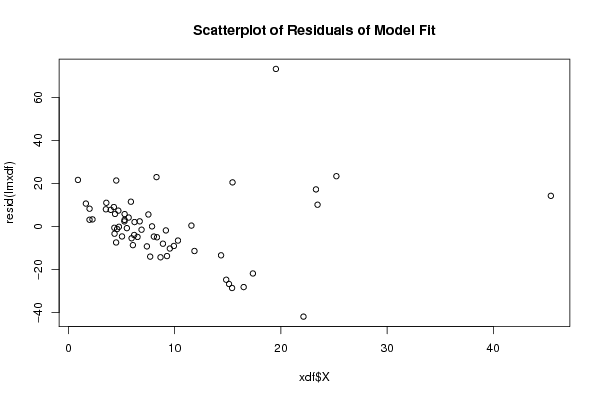
plot(xdf$X, resid(lmxdf), main='Scatterplot of Residuals of Model Fit')
dev.off()
bitmap(file='cooksDistanceLmplot.png')
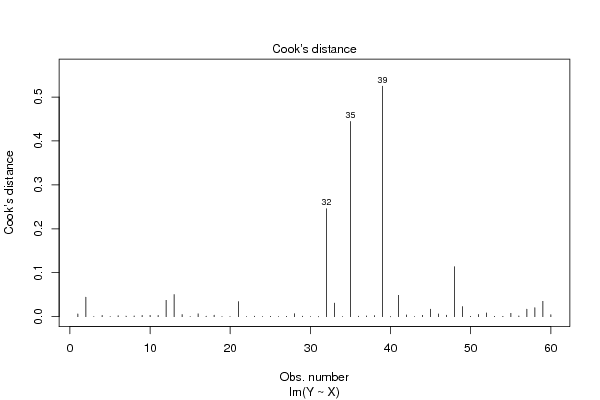
plot(lmxdf, which=4)
dev.off()