Free Statistics

of Irreproducible Research!

Author's title

Author*The author of this computation has been verified*
R Software Modulerwasp_multipleregression.wasp
Title produced by softwareMultiple Regression
Date of computationSat, 16 Dec 2017 16:14:17 +0100
Cite this page as followsStatistical Computations at FreeStatistics.org, Office for Research Development and Education, URL https://freestatistics.org/blog/index.php?v=date/2017/Dec/16/t15134374903kg0hqk96gnprli.htm/, Retrieved Thu, 16 May 2024 02:33:02 +0000
Statistical Computations at FreeStatistics.org, Office for Research Development and Education, URL https://freestatistics.org/blog/index.php?pk=309905, Retrieved Thu, 16 May 2024 02:33:02 +0000
QR Codes:

Original text written by user:
IsPrivate?No (this computation is public)
User-defined keywords
Estimated Impact77
Family? (F = Feedback message, R = changed R code, M = changed R Module, P = changed Parameters, D = changed Data)
-       [Multiple Regression] [] [2017-12-16 15:14:17] [d303646f018933692b665a59d945002e] [Current]
Feedback Forum

Post a new message
Dataseries X:
56,6	62,4
71,5	67,4
83,3	76,1
66,9	67,4
86,8	74,5
74,9	72,6
60,9	60,5
72,1	66,1
84,3	76,5
88,6	76,8
82,2	77
51,8	71
80,9	74,8
76,7	73,7
82,6	80,5
74,6	71,8
78,6	76,9
79	79,9
64,4	65,9
64	69,5
77,9	75,1
83,8	79,6
74,2	75,2
51,7	68
79,9	72,8
74,8	71,5
78	78,5
78,4	76,8
77,3	75,3
77,9	76,7
72	69,7
66,4	67,8
83,5	77,5
85,1	82,5
74,8	75,3
56,1	70,9
75,3	76
75,3	73,7
75,4	79,7
76,7	77,8
72,3	73,3
78,1	78,3
69,4	71,9
55	67
79,9	82
88,6	83,7
72,2	74,8
59,2	80
77,9	74,3
77,8	76,8
90,4	89
87,4	81,9
82,9	76,8
97,5	88,9
75,8	75,8
74	75,5
95,5	89,1
95,6	88
95,8	85,9
75,5	89,3
89,9	82,9
91,8	81,2
97	90,5
95,7	86,4
86	81,8
93,3	91,3
68,7	73,4
64,5	76,6
91	91
84,9	87
97,3	89,7
70,2	90,7
100,9	86,5
99,7	86,6
121,3	98,8
102,8	84,4
111,8	91,4
117,6	95,7
80,7	78,5
81,6	81,7
99,5	94,3
108,3	98,5
107,5	95,4
84,4	91,7
115,6	92,8
109,8	90,5
116,9	102,2
106,8	91,8
112,9	95
113,9	102
94,9	88,9
85,1	89,6
101	97,9
109,7	108,6
104,1	100,8
76,7	95,1
116,5	101
121,7	100,9
117,9	102,5
133,3	105,4
117,8	98,4
129,8	105,3
109,1	96,5
88	88,1
120,1	107,9
118,4	107
89,7	92,5
71,4	95,7
75,9	85,2
75,2	85,5
79,2	94,7
70,8	86,2
73,7	88,8
79,4	93,4
68,5	83,4
66,5	82,9
93	96,7
91,9	96,2
86,1	92,8
66,2	92,8
90,4	90
92,4	95,4
108,8	108,3
103,6	96,3
103	95
117,1	109
91,9	92
80,3	92,3
111,6	107
106,6	105,5
107	105,4
87,3	103,9
104,5	99,2
102,8	102,2
116,2	121,5
103,4	102,3
112,8	110
103	105,9
85,5	91,9
83,2	100
106,4	111,7
98,2	104,9
100,5	103,3
75,5	101,8
101,3	100,8
105,2	104,2
112,7	116,5
95,7	97,9
99,3	100,7
103	107
88,4	96,3
78,5	96
97	104,5
106,4	107,4
94,7	102,4
73,7	94,9
101,5	98,8
100,5	96,8
102,1	108,2
101,4	103,8
98,6	102,3
104,7	107,2
87,6	102
76	92,6
102,9	105,2
107,8	113
96	105,6
69,6	101,6
105,4	101,7
100,5	102,7
100,4	109
101,8	105,5
94,9	103,3
100,5	108,6
89,4	98,2
75,9	90
109,1	112,4
107,4	111,9
86,6	102,1
75,7	102,4
105,3	101,7
104,4	98,7
119,5	114
111,6	105,1
105,7	98,3
122,3	110
97,7	96,5
82,4	92,2
113,4	112
113,8	111,4
103,1	107,5
82,2	103,4
104,5	103,5
104,8	107,4
110,7	117,6
110,6	110,2
103,9	104,3
111,9	115,9
82,8	98,9
81,4	101,9
108,3	113,5
103,9	109,5
105,3	110
86	114,2
109,9	106,9
103,9	109,2
120,5	124,2
102,6	104,7
110,7	111,9
116,8	119
86,7	102,9
90,1	106,3


Summary of computational transaction
Raw Input view raw input (R code)
Raw Outputview raw output of R engine
Computing time10 seconds
R ServerBig Analytics Cloud Computing Center

\begin{tabular}{lllllllll}
\hline
Summary of computational transaction \tabularnewline
Raw Input view raw input (R code)  \tabularnewline
Raw Outputview raw output of R engine  \tabularnewline
Computing time10 seconds \tabularnewline
R ServerBig Analytics Cloud Computing Center \tabularnewline
\hline
\end{tabular}
%Source: https://freestatistics.org/blog/index.php?pk=309905&T=0

[TABLE]
[ROW]
Summary of computational transaction[/C][/ROW] [ROW]Raw Input[/C] view raw input (R code) [/C][/ROW] [ROW]Raw Output[/C]view raw output of R engine [/C][/ROW] [ROW]Computing time[/C]10 seconds[/C][/ROW] [ROW]R Server[/C]Big Analytics Cloud Computing Center[/C][/ROW] [/TABLE] Source: https://freestatistics.org/blog/index.php?pk=309905&T=0

Globally Unique Identifier (entire table): ba.freestatistics.org/blog/index.php?pk=309905&T=0

As an alternative you can also use a QR Code:  

The GUIDs for individual cells are displayed in the table below:

Summary of computational transaction
Raw Input view raw input (R code)
Raw Outputview raw output of R engine
Computing time10 seconds
R ServerBig Analytics Cloud Computing Center


Multiple Linear Regression - Estimated Regression Equation
(1-Bs)(1-B)bm[t] = + 0.025506 + 1.12203`(1-Bs)(1-B)tip`[t] -0.0929808`(1-Bs)(1-B)bm(t-1)`[t] + 0.0963623`(1-Bs)(1-B)bm(t-2)`[t] + 0.108221`(1-Bs)(1-B)bm(t-3)`[t] -0.238113`(1-Bs)(1-B)bm(t-1s)`[t] -0.00148715`(1-Bs)(1-B)bm(t-2s)`[t] + e[t]

\begin{tabular}{lllllllll}
\hline
Multiple Linear Regression - Estimated Regression Equation \tabularnewline
(1-Bs)(1-B)bm[t] =  +  0.025506 +  1.12203`(1-Bs)(1-B)tip`[t] -0.0929808`(1-Bs)(1-B)bm(t-1)`[t] +  0.0963623`(1-Bs)(1-B)bm(t-2)`[t] +  0.108221`(1-Bs)(1-B)bm(t-3)`[t] -0.238113`(1-Bs)(1-B)bm(t-1s)`[t] -0.00148715`(1-Bs)(1-B)bm(t-2s)`[t]  + e[t] \tabularnewline
 \tabularnewline
\hline
\end{tabular}
%Source: https://freestatistics.org/blog/index.php?pk=309905&T=1

[TABLE]
[ROW][C]Multiple Linear Regression - Estimated Regression Equation[/C][/ROW]
[ROW][C](1-Bs)(1-B)bm[t] =  +  0.025506 +  1.12203`(1-Bs)(1-B)tip`[t] -0.0929808`(1-Bs)(1-B)bm(t-1)`[t] +  0.0963623`(1-Bs)(1-B)bm(t-2)`[t] +  0.108221`(1-Bs)(1-B)bm(t-3)`[t] -0.238113`(1-Bs)(1-B)bm(t-1s)`[t] -0.00148715`(1-Bs)(1-B)bm(t-2s)`[t]  + e[t][/C][/ROW]
[ROW][C][/C][/ROW]
[/TABLE]
Source: https://freestatistics.org/blog/index.php?pk=309905&T=1

Globally Unique Identifier (entire table): ba.freestatistics.org/blog/index.php?pk=309905&T=1

As an alternative you can also use a QR Code:  

The GUIDs for individual cells are displayed in the table below:

Multiple Linear Regression - Estimated Regression Equation
(1-Bs)(1-B)bm[t] = + 0.025506 + 1.12203`(1-Bs)(1-B)tip`[t] -0.0929808`(1-Bs)(1-B)bm(t-1)`[t] + 0.0963623`(1-Bs)(1-B)bm(t-2)`[t] + 0.108221`(1-Bs)(1-B)bm(t-3)`[t] -0.238113`(1-Bs)(1-B)bm(t-1s)`[t] -0.00148715`(1-Bs)(1-B)bm(t-2s)`[t] + e[t]


Multiple Linear Regression - Ordinary Least Squares
VariableParameterS.D.T-STATH0: parameter = 02-tail p-value1-tail p-value
(Intercept)+0.02551 0.4303+5.9280e-02 0.9528 0.4764
`(1-Bs)(1-B)tip`+1.122 0.08571+1.3090e+01 2.594e-27 1.297e-27
`(1-Bs)(1-B)bm(t-1)`-0.09298 0.05457-1.7040e+00 0.09032 0.04516
`(1-Bs)(1-B)bm(t-2)`+0.09636 0.05483+1.7570e+00 0.0807 0.04035
`(1-Bs)(1-B)bm(t-3)`+0.1082 0.05133+2.1080e+00 0.03652 0.01826
`(1-Bs)(1-B)bm(t-1s)`-0.2381 0.05112-4.6580e+00 6.554e-06 3.277e-06
`(1-Bs)(1-B)bm(t-2s)`-0.001487 0.05011-2.9680e-02 0.9764 0.4882

\begin{tabular}{lllllllll}
\hline
Multiple Linear Regression - Ordinary Least Squares \tabularnewline
Variable & Parameter & S.D. & T-STATH0: parameter = 0 & 2-tail p-value & 1-tail p-value \tabularnewline
(Intercept) & +0.02551 &  0.4303 & +5.9280e-02 &  0.9528 &  0.4764 \tabularnewline
`(1-Bs)(1-B)tip` & +1.122 &  0.08571 & +1.3090e+01 &  2.594e-27 &  1.297e-27 \tabularnewline
`(1-Bs)(1-B)bm(t-1)` & -0.09298 &  0.05457 & -1.7040e+00 &  0.09032 &  0.04516 \tabularnewline
`(1-Bs)(1-B)bm(t-2)` & +0.09636 &  0.05483 & +1.7570e+00 &  0.0807 &  0.04035 \tabularnewline
`(1-Bs)(1-B)bm(t-3)` & +0.1082 &  0.05133 & +2.1080e+00 &  0.03652 &  0.01826 \tabularnewline
`(1-Bs)(1-B)bm(t-1s)` & -0.2381 &  0.05112 & -4.6580e+00 &  6.554e-06 &  3.277e-06 \tabularnewline
`(1-Bs)(1-B)bm(t-2s)` & -0.001487 &  0.05011 & -2.9680e-02 &  0.9764 &  0.4882 \tabularnewline
\hline
\end{tabular}
%Source: https://freestatistics.org/blog/index.php?pk=309905&T=2

[TABLE]
[ROW][C]Multiple Linear Regression - Ordinary Least Squares[/C][/ROW]
[ROW][C]Variable[/C][C]Parameter[/C][C]S.D.[/C][C]T-STATH0: parameter = 0[/C][C]2-tail p-value[/C][C]1-tail p-value[/C][/ROW]
[ROW][C](Intercept)[/C][C]+0.02551[/C][C] 0.4303[/C][C]+5.9280e-02[/C][C] 0.9528[/C][C] 0.4764[/C][/ROW]
[ROW][C]`(1-Bs)(1-B)tip`[/C][C]+1.122[/C][C] 0.08571[/C][C]+1.3090e+01[/C][C] 2.594e-27[/C][C] 1.297e-27[/C][/ROW]
[ROW][C]`(1-Bs)(1-B)bm(t-1)`[/C][C]-0.09298[/C][C] 0.05457[/C][C]-1.7040e+00[/C][C] 0.09032[/C][C] 0.04516[/C][/ROW]
[ROW][C]`(1-Bs)(1-B)bm(t-2)`[/C][C]+0.09636[/C][C] 0.05483[/C][C]+1.7570e+00[/C][C] 0.0807[/C][C] 0.04035[/C][/ROW]
[ROW][C]`(1-Bs)(1-B)bm(t-3)`[/C][C]+0.1082[/C][C] 0.05133[/C][C]+2.1080e+00[/C][C] 0.03652[/C][C] 0.01826[/C][/ROW]
[ROW][C]`(1-Bs)(1-B)bm(t-1s)`[/C][C]-0.2381[/C][C] 0.05112[/C][C]-4.6580e+00[/C][C] 6.554e-06[/C][C] 3.277e-06[/C][/ROW]
[ROW][C]`(1-Bs)(1-B)bm(t-2s)`[/C][C]-0.001487[/C][C] 0.05011[/C][C]-2.9680e-02[/C][C] 0.9764[/C][C] 0.4882[/C][/ROW]
[/TABLE]
Source: https://freestatistics.org/blog/index.php?pk=309905&T=2

Globally Unique Identifier (entire table): ba.freestatistics.org/blog/index.php?pk=309905&T=2

As an alternative you can also use a QR Code:  

The GUIDs for individual cells are displayed in the table below:

Multiple Linear Regression - Ordinary Least Squares
VariableParameterS.D.T-STATH0: parameter = 02-tail p-value1-tail p-value
(Intercept)+0.02551 0.4303+5.9280e-02 0.9528 0.4764
`(1-Bs)(1-B)tip`+1.122 0.08571+1.3090e+01 2.594e-27 1.297e-27
`(1-Bs)(1-B)bm(t-1)`-0.09298 0.05457-1.7040e+00 0.09032 0.04516
`(1-Bs)(1-B)bm(t-2)`+0.09636 0.05483+1.7570e+00 0.0807 0.04035
`(1-Bs)(1-B)bm(t-3)`+0.1082 0.05133+2.1080e+00 0.03652 0.01826
`(1-Bs)(1-B)bm(t-1s)`-0.2381 0.05112-4.6580e+00 6.554e-06 3.277e-06
`(1-Bs)(1-B)bm(t-2s)`-0.001487 0.05011-2.9680e-02 0.9764 0.4882


Multiple Linear Regression - Regression Statistics
Multiple R 0.8287
R-squared 0.6867
Adjusted R-squared 0.6753
F-TEST (value) 60.28
F-TEST (DF numerator)6
F-TEST (DF denominator)165
p-value 0
Multiple Linear Regression - Residual Statistics
Residual Standard Deviation 5.643
Sum Squared Residuals 5254

\begin{tabular}{lllllllll}
\hline
Multiple Linear Regression - Regression Statistics \tabularnewline
Multiple R &  0.8287 \tabularnewline
R-squared &  0.6867 \tabularnewline
Adjusted R-squared &  0.6753 \tabularnewline
F-TEST (value) &  60.28 \tabularnewline
F-TEST (DF numerator) & 6 \tabularnewline
F-TEST (DF denominator) & 165 \tabularnewline
p-value &  0 \tabularnewline
Multiple Linear Regression - Residual Statistics \tabularnewline
Residual Standard Deviation &  5.643 \tabularnewline
Sum Squared Residuals &  5254 \tabularnewline
\hline
\end{tabular}
%Source: https://freestatistics.org/blog/index.php?pk=309905&T=3

[TABLE]
[ROW][C]Multiple Linear Regression - Regression Statistics[/C][/ROW]
[ROW][C]Multiple R[/C][C] 0.8287[/C][/ROW]
[ROW][C]R-squared[/C][C] 0.6867[/C][/ROW]
[ROW][C]Adjusted R-squared[/C][C] 0.6753[/C][/ROW]
[ROW][C]F-TEST (value)[/C][C] 60.28[/C][/ROW]
[ROW][C]F-TEST (DF numerator)[/C][C]6[/C][/ROW]
[ROW][C]F-TEST (DF denominator)[/C][C]165[/C][/ROW]
[ROW][C]p-value[/C][C] 0[/C][/ROW]
[ROW][C]Multiple Linear Regression - Residual Statistics[/C][/ROW]
[ROW][C]Residual Standard Deviation[/C][C] 5.643[/C][/ROW]
[ROW][C]Sum Squared Residuals[/C][C] 5254[/C][/ROW]
[/TABLE]
Source: https://freestatistics.org/blog/index.php?pk=309905&T=3

Globally Unique Identifier (entire table): ba.freestatistics.org/blog/index.php?pk=309905&T=3

As an alternative you can also use a QR Code:  

The GUIDs for individual cells are displayed in the table below:

Multiple Linear Regression - Regression Statistics
Multiple R 0.8287
R-squared 0.6867
Adjusted R-squared 0.6753
F-TEST (value) 60.28
F-TEST (DF numerator)6
F-TEST (DF denominator)165
p-value 0
Multiple Linear Regression - Residual Statistics
Residual Standard Deviation 5.643
Sum Squared Residuals 5254


Menu of Residual Diagnostics
DescriptionLink
HistogramCompute
Central TendencyCompute
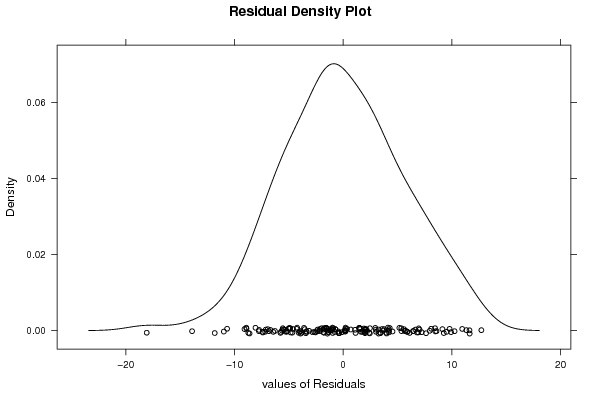
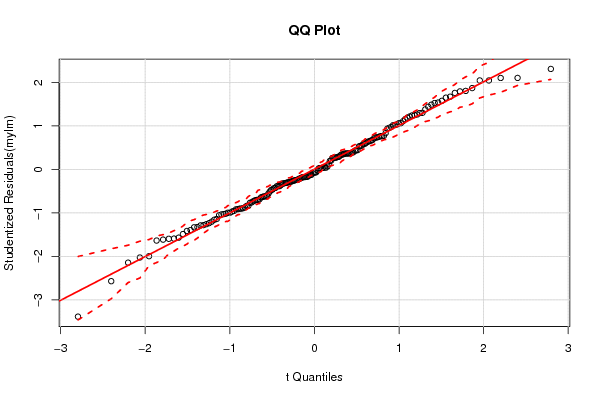
QQ PlotCompute
Kernel Density PlotCompute
Skewness/Kurtosis TestCompute
Skewness-Kurtosis PlotCompute
Harrell-Davis PlotCompute
Bootstrap Plot -- Central TendencyCompute
Blocked Bootstrap Plot -- Central TendencyCompute
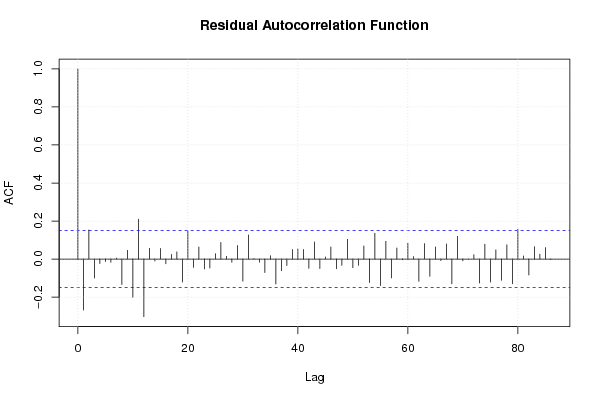
(Partial) Autocorrelation PlotCompute
Spectral AnalysisCompute
Tukey lambda PPCC PlotCompute
Box-Cox Normality PlotCompute
Summary StatisticsCompute

\begin{tabular}{lllllllll}
\hline
Menu of Residual Diagnostics \tabularnewline
Description & Link \tabularnewline
Histogram & Compute \tabularnewline
Central Tendency & Compute \tabularnewline
QQ Plot & Compute \tabularnewline
Kernel Density Plot & Compute \tabularnewline
Skewness/Kurtosis Test & Compute \tabularnewline
Skewness-Kurtosis Plot & Compute \tabularnewline
Harrell-Davis Plot & Compute \tabularnewline
Bootstrap Plot -- Central Tendency & Compute \tabularnewline
Blocked Bootstrap Plot -- Central Tendency & Compute \tabularnewline
(Partial) Autocorrelation Plot & Compute \tabularnewline
Spectral Analysis & Compute \tabularnewline
Tukey lambda PPCC Plot & Compute \tabularnewline
Box-Cox Normality Plot & Compute \tabularnewline
Summary Statistics & Compute \tabularnewline
\hline
\end{tabular}
%Source: https://freestatistics.org/blog/index.php?pk=309905&T=4

[TABLE]
[ROW][C]Menu of Residual Diagnostics[/C][/ROW]
[ROW][C]Description[/C][C]Link[/C][/ROW]
[ROW][C]Histogram[/C][C]Compute[/C][/ROW]
[ROW][C]Central Tendency[/C][C]Compute[/C][/ROW]
[ROW][C]QQ Plot[/C][C]Compute[/C][/ROW]
[ROW][C]Kernel Density Plot[/C][C]Compute[/C][/ROW]
[ROW][C]Skewness/Kurtosis Test[/C][C]Compute[/C][/ROW]
[ROW][C]Skewness-Kurtosis Plot[/C][C]Compute[/C][/ROW]
[ROW][C]Harrell-Davis Plot[/C][C]Compute[/C][/ROW]
[ROW][C]Bootstrap Plot -- Central Tendency[/C][C]Compute[/C][/ROW]
[ROW][C]Blocked Bootstrap Plot -- Central Tendency[/C][C]Compute[/C][/ROW]
[ROW][C](Partial) Autocorrelation Plot[/C][C]Compute[/C][/ROW]
[ROW][C]Spectral Analysis[/C][C]Compute[/C][/ROW]
[ROW][C]Tukey lambda PPCC Plot[/C][C]Compute[/C][/ROW]
[ROW][C]Box-Cox Normality Plot[/C][C]Compute[/C][/ROW]
[ROW][C]Summary Statistics[/C][C]Compute[/C][/ROW]
[/TABLE]
Source: https://freestatistics.org/blog/index.php?pk=309905&T=4

Globally Unique Identifier (entire table): ba.freestatistics.org/blog/index.php?pk=309905&T=4

As an alternative you can also use a QR Code:  

The GUIDs for individual cells are displayed in the table below:

Menu of Residual Diagnostics
DescriptionLink
HistogramCompute
Central TendencyCompute
QQ PlotCompute
Kernel Density PlotCompute
Skewness/Kurtosis TestCompute
Skewness-Kurtosis PlotCompute
Harrell-Davis PlotCompute
Bootstrap Plot -- Central TendencyCompute
Blocked Bootstrap Plot -- Central TendencyCompute
(Partial) Autocorrelation PlotCompute
Spectral AnalysisCompute
Tukey lambda PPCC PlotCompute
Box-Cox Normality PlotCompute
Summary StatisticsCompute


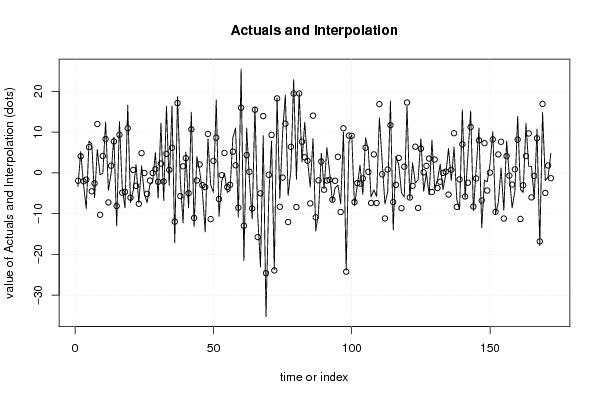
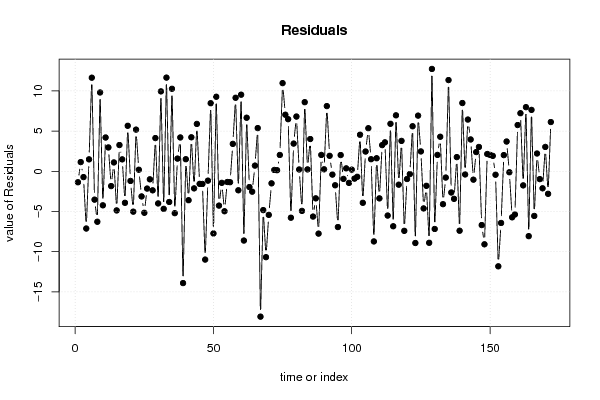
Multiple Linear Regression - Actuals, Interpolation, and Residuals
Time or IndexActualsInterpolationForecastResidualsPrediction Error
1-3.3-1.933-1.367
2 5.2 4.057 1.143
3-2.8-2.076-0.7239
4-8.8-1.681-7.119
5 7.8 6.319 1.481
6 7.1-4.532 11.63
7-6.1-2.571-3.529
8 5.7 11.98-6.276
9-0.5-10.3 9.797
10-0.1 4.134-4.234
11 12.5 8.302 4.198
12-4.3-7.262 2.962
13-0.1 1.739-1.839
14 8.8 7.701 1.099
15-13-8.132-4.868
16 12.6 9.336 3.264
17-3.4-4.879 1.479
18-8.6-4.677-3.923
19 16.6 10.94 5.656
20-7.3-6.097-1.203
21-4.3 0.7202-5.02
22 2-3.178 5.178
23-7.4-7.591 0.1905
24 1.7 4.83-3.13
25-5.2-0.03947-5.161
26-7.3-5.148-2.152
27-2.9-1.899-1.001
28-2.4-0.03108-2.369
29 5 0.8748 4.125
30-6.2-2.201-3.999
31 12.2 2.266 9.934
32-6.8-2.128-4.672
33 16.3 4.656 11.64
34-3.1 0.7185-3.819
35 16.4 6.146 10.25
36-17.2-11.99-5.211
37 18.7 17.12 1.576
38-1.5-5.705 4.205
39-12.3 1.601-13.9
40 5.1 3.601 1.499
41-8.6-5.001-3.599
42 14.9 10.68 4.225
43-13.2-11.07-2.126
44 4-1.886 5.886
45 0.5 2.066-1.566
46-4.6-3.022-1.578
47-14.5-3.521-10.98
48 8.4 9.566-1.166
49-2.9-11.36 8.459
50-4.8 2.933-7.733
51 17.9 8.635 9.265
52-10.7-6.431-4.269
53-2-0.5586-1.441
54-0.1 4.872-4.972
55-4.8-3.464-1.336
56-4.3-2.941-1.359
57 8.6 5.194 3.406
58 11 1.86 9.14
59-10.9-8.538-2.362
60 25.5 15.98 9.522
61-21.6-12.99-8.613
62 11 4.344 6.656
63-1.7 0.2617-1.962
64-11.3-8.764-2.536
65 16.2 15.5 0.7048
66-10.4-15.77 5.368
67-23.1-5.024-18.08
68 9.1 13.93-4.828
69-35.3-24.62-10.68
70-5.9-0.4789-5.421
71 7.8 9.302-1.502
72-23.8-23.96 0.164
73 18.4 18.27 0.1294
74-6.3-8.327 2.027
75 9.8-1.16 10.96
76 19.1 12.07 7.031
77-5.6-12.07 6.475
78 0.6 6.373-5.773
79 22.9 19.46 3.441
80-1.6-8.403 6.803
81 19.7 19.48 0.2219
82 2.7 7.629-4.929
83 12.4 3.81 8.59
84 3.2 2.967 0.2332
85-3.5-7.51 4.01
86 8.4 14.03-5.632
87-14.3-10.93-3.368
88-9.6-1.848-7.752
89 4.8 2.768 2.032
90-3.9-4.143 0.2429
91 6.2-1.904 8.104
92 0.2-1.723 1.923
93-7-6.588-0.4121
94-3.7-1.96-1.74
95-3 3.933-6.933
96-7.6-9.615 2.015
97 10 10.95-0.9469
98-23.9-24.26 0.3608
99 7.7 9.145-1.445
100 9.3 9.098 0.202
101-8.1-7.184-0.9156
102-3.2-2.511-0.6891
103 1.9-2.644 4.544
104-5.3-1.381-3.919
105 8.6 6.144 2.456
106 5.6 0.2466 5.353
107-5.9-7.398 1.498
108-4.2 4.523-8.723
109-5.8-7.42 1.62
110 13.5 16.87-3.369
111 2.9-0.3527 3.253
112-7.6-11.2 3.596
113-4.7 0.8037-5.504
114 17.6 11.7 5.905
115-14-7.163-6.837
116 4-2.956 6.956
117 2 3.67-1.67
118-4.9-8.677 3.777
119-5.9 1.506-7.406
120 16.3 17.26-0.9626
121-6.4-6.047-0.3526
122 2.4-3.197 5.597
123-2.5 6.419-8.919
124-1.7-8.618 6.918
125 8.4 5.934 2.466
126-4.5 0.122-4.622
127-0.1 1.707-1.807
128-5.4 3.493-8.893
129 8-4.722 12.72
130-3.9 3.275-7.175
131-1.7-3.734 2.034
132 2.1-2.192 4.292
133-4.1-0.008504-4.091
134-0.5 0.2824-0.7824
135 6-5.339 11.34
136-1.9 0.7383-2.638
137 6.3 9.729-3.429
138-6.6-8.362 1.762
139-9-1.608-7.392
140 15.5 7.013 8.487
141-6.2-5.803-0.3973
142 4-2.431 6.431
143 15.2 11.25 3.955
144-9.3-8.257-1.043
145 1-1.388 2.388
146 11 7.978 3.022
147-13.5-6.811-6.689
148-1.8 7.28-9.08
149-2.2-4.347 2.147
150 2.1 0.06166 2.038
151 10.1 8.187 1.913
152-10-9.569-0.431
153-7.3 4.518-11.82
154 1.2 7.629-6.429
155-9.2-11.21 2.011
156 7.8 4.101 3.699
157-0.8-0.6786-0.1214
158-8.6-2.875-5.725
159-4.5 0.8707-5.371
160 13.9 8.151 5.749
161-4.1-11.32 7.217
162-4.8-3.046-1.754
163 12.1 4.126 7.974
164 1.6 9.665-8.065
165 1.6-6.032 7.632
166-6.3-0.7465-5.553
167 10.7 8.492 2.208
168-17.8-16.82-0.9767
169 14.8 16.92-2.117
170-1.9-4.926 3.026
171-1 1.803-2.803
172 4.8-1.321 6.121

\begin{tabular}{lllllllll}
\hline
Multiple Linear Regression - Actuals, Interpolation, and Residuals \tabularnewline
Time or Index & Actuals & InterpolationForecast & ResidualsPrediction Error \tabularnewline
1 & -3.3 & -1.933 & -1.367 \tabularnewline
2 &  5.2 &  4.057 &  1.143 \tabularnewline
3 & -2.8 & -2.076 & -0.7239 \tabularnewline
4 & -8.8 & -1.681 & -7.119 \tabularnewline
5 &  7.8 &  6.319 &  1.481 \tabularnewline
6 &  7.1 & -4.532 &  11.63 \tabularnewline
7 & -6.1 & -2.571 & -3.529 \tabularnewline
8 &  5.7 &  11.98 & -6.276 \tabularnewline
9 & -0.5 & -10.3 &  9.797 \tabularnewline
10 & -0.1 &  4.134 & -4.234 \tabularnewline
11 &  12.5 &  8.302 &  4.198 \tabularnewline
12 & -4.3 & -7.262 &  2.962 \tabularnewline
13 & -0.1 &  1.739 & -1.839 \tabularnewline
14 &  8.8 &  7.701 &  1.099 \tabularnewline
15 & -13 & -8.132 & -4.868 \tabularnewline
16 &  12.6 &  9.336 &  3.264 \tabularnewline
17 & -3.4 & -4.879 &  1.479 \tabularnewline
18 & -8.6 & -4.677 & -3.923 \tabularnewline
19 &  16.6 &  10.94 &  5.656 \tabularnewline
20 & -7.3 & -6.097 & -1.203 \tabularnewline
21 & -4.3 &  0.7202 & -5.02 \tabularnewline
22 &  2 & -3.178 &  5.178 \tabularnewline
23 & -7.4 & -7.591 &  0.1905 \tabularnewline
24 &  1.7 &  4.83 & -3.13 \tabularnewline
25 & -5.2 & -0.03947 & -5.161 \tabularnewline
26 & -7.3 & -5.148 & -2.152 \tabularnewline
27 & -2.9 & -1.899 & -1.001 \tabularnewline
28 & -2.4 & -0.03108 & -2.369 \tabularnewline
29 &  5 &  0.8748 &  4.125 \tabularnewline
30 & -6.2 & -2.201 & -3.999 \tabularnewline
31 &  12.2 &  2.266 &  9.934 \tabularnewline
32 & -6.8 & -2.128 & -4.672 \tabularnewline
33 &  16.3 &  4.656 &  11.64 \tabularnewline
34 & -3.1 &  0.7185 & -3.819 \tabularnewline
35 &  16.4 &  6.146 &  10.25 \tabularnewline
36 & -17.2 & -11.99 & -5.211 \tabularnewline
37 &  18.7 &  17.12 &  1.576 \tabularnewline
38 & -1.5 & -5.705 &  4.205 \tabularnewline
39 & -12.3 &  1.601 & -13.9 \tabularnewline
40 &  5.1 &  3.601 &  1.499 \tabularnewline
41 & -8.6 & -5.001 & -3.599 \tabularnewline
42 &  14.9 &  10.68 &  4.225 \tabularnewline
43 & -13.2 & -11.07 & -2.126 \tabularnewline
44 &  4 & -1.886 &  5.886 \tabularnewline
45 &  0.5 &  2.066 & -1.566 \tabularnewline
46 & -4.6 & -3.022 & -1.578 \tabularnewline
47 & -14.5 & -3.521 & -10.98 \tabularnewline
48 &  8.4 &  9.566 & -1.166 \tabularnewline
49 & -2.9 & -11.36 &  8.459 \tabularnewline
50 & -4.8 &  2.933 & -7.733 \tabularnewline
51 &  17.9 &  8.635 &  9.265 \tabularnewline
52 & -10.7 & -6.431 & -4.269 \tabularnewline
53 & -2 & -0.5586 & -1.441 \tabularnewline
54 & -0.1 &  4.872 & -4.972 \tabularnewline
55 & -4.8 & -3.464 & -1.336 \tabularnewline
56 & -4.3 & -2.941 & -1.359 \tabularnewline
57 &  8.6 &  5.194 &  3.406 \tabularnewline
58 &  11 &  1.86 &  9.14 \tabularnewline
59 & -10.9 & -8.538 & -2.362 \tabularnewline
60 &  25.5 &  15.98 &  9.522 \tabularnewline
61 & -21.6 & -12.99 & -8.613 \tabularnewline
62 &  11 &  4.344 &  6.656 \tabularnewline
63 & -1.7 &  0.2617 & -1.962 \tabularnewline
64 & -11.3 & -8.764 & -2.536 \tabularnewline
65 &  16.2 &  15.5 &  0.7048 \tabularnewline
66 & -10.4 & -15.77 &  5.368 \tabularnewline
67 & -23.1 & -5.024 & -18.08 \tabularnewline
68 &  9.1 &  13.93 & -4.828 \tabularnewline
69 & -35.3 & -24.62 & -10.68 \tabularnewline
70 & -5.9 & -0.4789 & -5.421 \tabularnewline
71 &  7.8 &  9.302 & -1.502 \tabularnewline
72 & -23.8 & -23.96 &  0.164 \tabularnewline
73 &  18.4 &  18.27 &  0.1294 \tabularnewline
74 & -6.3 & -8.327 &  2.027 \tabularnewline
75 &  9.8 & -1.16 &  10.96 \tabularnewline
76 &  19.1 &  12.07 &  7.031 \tabularnewline
77 & -5.6 & -12.07 &  6.475 \tabularnewline
78 &  0.6 &  6.373 & -5.773 \tabularnewline
79 &  22.9 &  19.46 &  3.441 \tabularnewline
80 & -1.6 & -8.403 &  6.803 \tabularnewline
81 &  19.7 &  19.48 &  0.2219 \tabularnewline
82 &  2.7 &  7.629 & -4.929 \tabularnewline
83 &  12.4 &  3.81 &  8.59 \tabularnewline
84 &  3.2 &  2.967 &  0.2332 \tabularnewline
85 & -3.5 & -7.51 &  4.01 \tabularnewline
86 &  8.4 &  14.03 & -5.632 \tabularnewline
87 & -14.3 & -10.93 & -3.368 \tabularnewline
88 & -9.6 & -1.848 & -7.752 \tabularnewline
89 &  4.8 &  2.768 &  2.032 \tabularnewline
90 & -3.9 & -4.143 &  0.2429 \tabularnewline
91 &  6.2 & -1.904 &  8.104 \tabularnewline
92 &  0.2 & -1.723 &  1.923 \tabularnewline
93 & -7 & -6.588 & -0.4121 \tabularnewline
94 & -3.7 & -1.96 & -1.74 \tabularnewline
95 & -3 &  3.933 & -6.933 \tabularnewline
96 & -7.6 & -9.615 &  2.015 \tabularnewline
97 &  10 &  10.95 & -0.9469 \tabularnewline
98 & -23.9 & -24.26 &  0.3608 \tabularnewline
99 &  7.7 &  9.145 & -1.445 \tabularnewline
100 &  9.3 &  9.098 &  0.202 \tabularnewline
101 & -8.1 & -7.184 & -0.9156 \tabularnewline
102 & -3.2 & -2.511 & -0.6891 \tabularnewline
103 &  1.9 & -2.644 &  4.544 \tabularnewline
104 & -5.3 & -1.381 & -3.919 \tabularnewline
105 &  8.6 &  6.144 &  2.456 \tabularnewline
106 &  5.6 &  0.2466 &  5.353 \tabularnewline
107 & -5.9 & -7.398 &  1.498 \tabularnewline
108 & -4.2 &  4.523 & -8.723 \tabularnewline
109 & -5.8 & -7.42 &  1.62 \tabularnewline
110 &  13.5 &  16.87 & -3.369 \tabularnewline
111 &  2.9 & -0.3527 &  3.253 \tabularnewline
112 & -7.6 & -11.2 &  3.596 \tabularnewline
113 & -4.7 &  0.8037 & -5.504 \tabularnewline
114 &  17.6 &  11.7 &  5.905 \tabularnewline
115 & -14 & -7.163 & -6.837 \tabularnewline
116 &  4 & -2.956 &  6.956 \tabularnewline
117 &  2 &  3.67 & -1.67 \tabularnewline
118 & -4.9 & -8.677 &  3.777 \tabularnewline
119 & -5.9 &  1.506 & -7.406 \tabularnewline
120 &  16.3 &  17.26 & -0.9626 \tabularnewline
121 & -6.4 & -6.047 & -0.3526 \tabularnewline
122 &  2.4 & -3.197 &  5.597 \tabularnewline
123 & -2.5 &  6.419 & -8.919 \tabularnewline
124 & -1.7 & -8.618 &  6.918 \tabularnewline
125 &  8.4 &  5.934 &  2.466 \tabularnewline
126 & -4.5 &  0.122 & -4.622 \tabularnewline
127 & -0.1 &  1.707 & -1.807 \tabularnewline
128 & -5.4 &  3.493 & -8.893 \tabularnewline
129 &  8 & -4.722 &  12.72 \tabularnewline
130 & -3.9 &  3.275 & -7.175 \tabularnewline
131 & -1.7 & -3.734 &  2.034 \tabularnewline
132 &  2.1 & -2.192 &  4.292 \tabularnewline
133 & -4.1 & -0.008504 & -4.091 \tabularnewline
134 & -0.5 &  0.2824 & -0.7824 \tabularnewline
135 &  6 & -5.339 &  11.34 \tabularnewline
136 & -1.9 &  0.7383 & -2.638 \tabularnewline
137 &  6.3 &  9.729 & -3.429 \tabularnewline
138 & -6.6 & -8.362 &  1.762 \tabularnewline
139 & -9 & -1.608 & -7.392 \tabularnewline
140 &  15.5 &  7.013 &  8.487 \tabularnewline
141 & -6.2 & -5.803 & -0.3973 \tabularnewline
142 &  4 & -2.431 &  6.431 \tabularnewline
143 &  15.2 &  11.25 &  3.955 \tabularnewline
144 & -9.3 & -8.257 & -1.043 \tabularnewline
145 &  1 & -1.388 &  2.388 \tabularnewline
146 &  11 &  7.978 &  3.022 \tabularnewline
147 & -13.5 & -6.811 & -6.689 \tabularnewline
148 & -1.8 &  7.28 & -9.08 \tabularnewline
149 & -2.2 & -4.347 &  2.147 \tabularnewline
150 &  2.1 &  0.06166 &  2.038 \tabularnewline
151 &  10.1 &  8.187 &  1.913 \tabularnewline
152 & -10 & -9.569 & -0.431 \tabularnewline
153 & -7.3 &  4.518 & -11.82 \tabularnewline
154 &  1.2 &  7.629 & -6.429 \tabularnewline
155 & -9.2 & -11.21 &  2.011 \tabularnewline
156 &  7.8 &  4.101 &  3.699 \tabularnewline
157 & -0.8 & -0.6786 & -0.1214 \tabularnewline
158 & -8.6 & -2.875 & -5.725 \tabularnewline
159 & -4.5 &  0.8707 & -5.371 \tabularnewline
160 &  13.9 &  8.151 &  5.749 \tabularnewline
161 & -4.1 & -11.32 &  7.217 \tabularnewline
162 & -4.8 & -3.046 & -1.754 \tabularnewline
163 &  12.1 &  4.126 &  7.974 \tabularnewline
164 &  1.6 &  9.665 & -8.065 \tabularnewline
165 &  1.6 & -6.032 &  7.632 \tabularnewline
166 & -6.3 & -0.7465 & -5.553 \tabularnewline
167 &  10.7 &  8.492 &  2.208 \tabularnewline
168 & -17.8 & -16.82 & -0.9767 \tabularnewline
169 &  14.8 &  16.92 & -2.117 \tabularnewline
170 & -1.9 & -4.926 &  3.026 \tabularnewline
171 & -1 &  1.803 & -2.803 \tabularnewline
172 &  4.8 & -1.321 &  6.121 \tabularnewline
\hline
\end{tabular}
%Source: https://freestatistics.org/blog/index.php?pk=309905&T=5

[TABLE]
[ROW][C]Multiple Linear Regression - Actuals, Interpolation, and Residuals[/C][/ROW]
[ROW][C]Time or Index[/C][C]Actuals[/C][C]InterpolationForecast[/C][C]ResidualsPrediction Error[/C][/ROW]
[ROW][C]1[/C][C]-3.3[/C][C]-1.933[/C][C]-1.367[/C][/ROW]
[ROW][C]2[/C][C] 5.2[/C][C] 4.057[/C][C] 1.143[/C][/ROW]
[ROW][C]3[/C][C]-2.8[/C][C]-2.076[/C][C]-0.7239[/C][/ROW]
[ROW][C]4[/C][C]-8.8[/C][C]-1.681[/C][C]-7.119[/C][/ROW]
[ROW][C]5[/C][C] 7.8[/C][C] 6.319[/C][C] 1.481[/C][/ROW]
[ROW][C]6[/C][C] 7.1[/C][C]-4.532[/C][C] 11.63[/C][/ROW]
[ROW][C]7[/C][C]-6.1[/C][C]-2.571[/C][C]-3.529[/C][/ROW]
[ROW][C]8[/C][C] 5.7[/C][C] 11.98[/C][C]-6.276[/C][/ROW]
[ROW][C]9[/C][C]-0.5[/C][C]-10.3[/C][C] 9.797[/C][/ROW]
[ROW][C]10[/C][C]-0.1[/C][C] 4.134[/C][C]-4.234[/C][/ROW]
[ROW][C]11[/C][C] 12.5[/C][C] 8.302[/C][C] 4.198[/C][/ROW]
[ROW][C]12[/C][C]-4.3[/C][C]-7.262[/C][C] 2.962[/C][/ROW]
[ROW][C]13[/C][C]-0.1[/C][C] 1.739[/C][C]-1.839[/C][/ROW]
[ROW][C]14[/C][C] 8.8[/C][C] 7.701[/C][C] 1.099[/C][/ROW]
[ROW][C]15[/C][C]-13[/C][C]-8.132[/C][C]-4.868[/C][/ROW]
[ROW][C]16[/C][C] 12.6[/C][C] 9.336[/C][C] 3.264[/C][/ROW]
[ROW][C]17[/C][C]-3.4[/C][C]-4.879[/C][C] 1.479[/C][/ROW]
[ROW][C]18[/C][C]-8.6[/C][C]-4.677[/C][C]-3.923[/C][/ROW]
[ROW][C]19[/C][C] 16.6[/C][C] 10.94[/C][C] 5.656[/C][/ROW]
[ROW][C]20[/C][C]-7.3[/C][C]-6.097[/C][C]-1.203[/C][/ROW]
[ROW][C]21[/C][C]-4.3[/C][C] 0.7202[/C][C]-5.02[/C][/ROW]
[ROW][C]22[/C][C] 2[/C][C]-3.178[/C][C] 5.178[/C][/ROW]
[ROW][C]23[/C][C]-7.4[/C][C]-7.591[/C][C] 0.1905[/C][/ROW]
[ROW][C]24[/C][C] 1.7[/C][C] 4.83[/C][C]-3.13[/C][/ROW]
[ROW][C]25[/C][C]-5.2[/C][C]-0.03947[/C][C]-5.161[/C][/ROW]
[ROW][C]26[/C][C]-7.3[/C][C]-5.148[/C][C]-2.152[/C][/ROW]
[ROW][C]27[/C][C]-2.9[/C][C]-1.899[/C][C]-1.001[/C][/ROW]
[ROW][C]28[/C][C]-2.4[/C][C]-0.03108[/C][C]-2.369[/C][/ROW]
[ROW][C]29[/C][C] 5[/C][C] 0.8748[/C][C] 4.125[/C][/ROW]
[ROW][C]30[/C][C]-6.2[/C][C]-2.201[/C][C]-3.999[/C][/ROW]
[ROW][C]31[/C][C] 12.2[/C][C] 2.266[/C][C] 9.934[/C][/ROW]
[ROW][C]32[/C][C]-6.8[/C][C]-2.128[/C][C]-4.672[/C][/ROW]
[ROW][C]33[/C][C] 16.3[/C][C] 4.656[/C][C] 11.64[/C][/ROW]
[ROW][C]34[/C][C]-3.1[/C][C] 0.7185[/C][C]-3.819[/C][/ROW]
[ROW][C]35[/C][C] 16.4[/C][C] 6.146[/C][C] 10.25[/C][/ROW]
[ROW][C]36[/C][C]-17.2[/C][C]-11.99[/C][C]-5.211[/C][/ROW]
[ROW][C]37[/C][C] 18.7[/C][C] 17.12[/C][C] 1.576[/C][/ROW]
[ROW][C]38[/C][C]-1.5[/C][C]-5.705[/C][C] 4.205[/C][/ROW]
[ROW][C]39[/C][C]-12.3[/C][C] 1.601[/C][C]-13.9[/C][/ROW]
[ROW][C]40[/C][C] 5.1[/C][C] 3.601[/C][C] 1.499[/C][/ROW]
[ROW][C]41[/C][C]-8.6[/C][C]-5.001[/C][C]-3.599[/C][/ROW]
[ROW][C]42[/C][C] 14.9[/C][C] 10.68[/C][C] 4.225[/C][/ROW]
[ROW][C]43[/C][C]-13.2[/C][C]-11.07[/C][C]-2.126[/C][/ROW]
[ROW][C]44[/C][C] 4[/C][C]-1.886[/C][C] 5.886[/C][/ROW]
[ROW][C]45[/C][C] 0.5[/C][C] 2.066[/C][C]-1.566[/C][/ROW]
[ROW][C]46[/C][C]-4.6[/C][C]-3.022[/C][C]-1.578[/C][/ROW]
[ROW][C]47[/C][C]-14.5[/C][C]-3.521[/C][C]-10.98[/C][/ROW]
[ROW][C]48[/C][C] 8.4[/C][C] 9.566[/C][C]-1.166[/C][/ROW]
[ROW][C]49[/C][C]-2.9[/C][C]-11.36[/C][C] 8.459[/C][/ROW]
[ROW][C]50[/C][C]-4.8[/C][C] 2.933[/C][C]-7.733[/C][/ROW]
[ROW][C]51[/C][C] 17.9[/C][C] 8.635[/C][C] 9.265[/C][/ROW]
[ROW][C]52[/C][C]-10.7[/C][C]-6.431[/C][C]-4.269[/C][/ROW]
[ROW][C]53[/C][C]-2[/C][C]-0.5586[/C][C]-1.441[/C][/ROW]
[ROW][C]54[/C][C]-0.1[/C][C] 4.872[/C][C]-4.972[/C][/ROW]
[ROW][C]55[/C][C]-4.8[/C][C]-3.464[/C][C]-1.336[/C][/ROW]
[ROW][C]56[/C][C]-4.3[/C][C]-2.941[/C][C]-1.359[/C][/ROW]
[ROW][C]57[/C][C] 8.6[/C][C] 5.194[/C][C] 3.406[/C][/ROW]
[ROW][C]58[/C][C] 11[/C][C] 1.86[/C][C] 9.14[/C][/ROW]
[ROW][C]59[/C][C]-10.9[/C][C]-8.538[/C][C]-2.362[/C][/ROW]
[ROW][C]60[/C][C] 25.5[/C][C] 15.98[/C][C] 9.522[/C][/ROW]
[ROW][C]61[/C][C]-21.6[/C][C]-12.99[/C][C]-8.613[/C][/ROW]
[ROW][C]62[/C][C] 11[/C][C] 4.344[/C][C] 6.656[/C][/ROW]
[ROW][C]63[/C][C]-1.7[/C][C] 0.2617[/C][C]-1.962[/C][/ROW]
[ROW][C]64[/C][C]-11.3[/C][C]-8.764[/C][C]-2.536[/C][/ROW]
[ROW][C]65[/C][C] 16.2[/C][C] 15.5[/C][C] 0.7048[/C][/ROW]
[ROW][C]66[/C][C]-10.4[/C][C]-15.77[/C][C] 5.368[/C][/ROW]
[ROW][C]67[/C][C]-23.1[/C][C]-5.024[/C][C]-18.08[/C][/ROW]
[ROW][C]68[/C][C] 9.1[/C][C] 13.93[/C][C]-4.828[/C][/ROW]
[ROW][C]69[/C][C]-35.3[/C][C]-24.62[/C][C]-10.68[/C][/ROW]
[ROW][C]70[/C][C]-5.9[/C][C]-0.4789[/C][C]-5.421[/C][/ROW]
[ROW][C]71[/C][C] 7.8[/C][C] 9.302[/C][C]-1.502[/C][/ROW]
[ROW][C]72[/C][C]-23.8[/C][C]-23.96[/C][C] 0.164[/C][/ROW]
[ROW][C]73[/C][C] 18.4[/C][C] 18.27[/C][C] 0.1294[/C][/ROW]
[ROW][C]74[/C][C]-6.3[/C][C]-8.327[/C][C] 2.027[/C][/ROW]
[ROW][C]75[/C][C] 9.8[/C][C]-1.16[/C][C] 10.96[/C][/ROW]
[ROW][C]76[/C][C] 19.1[/C][C] 12.07[/C][C] 7.031[/C][/ROW]
[ROW][C]77[/C][C]-5.6[/C][C]-12.07[/C][C] 6.475[/C][/ROW]
[ROW][C]78[/C][C] 0.6[/C][C] 6.373[/C][C]-5.773[/C][/ROW]
[ROW][C]79[/C][C] 22.9[/C][C] 19.46[/C][C] 3.441[/C][/ROW]
[ROW][C]80[/C][C]-1.6[/C][C]-8.403[/C][C] 6.803[/C][/ROW]
[ROW][C]81[/C][C] 19.7[/C][C] 19.48[/C][C] 0.2219[/C][/ROW]
[ROW][C]82[/C][C] 2.7[/C][C] 7.629[/C][C]-4.929[/C][/ROW]
[ROW][C]83[/C][C] 12.4[/C][C] 3.81[/C][C] 8.59[/C][/ROW]
[ROW][C]84[/C][C] 3.2[/C][C] 2.967[/C][C] 0.2332[/C][/ROW]
[ROW][C]85[/C][C]-3.5[/C][C]-7.51[/C][C] 4.01[/C][/ROW]
[ROW][C]86[/C][C] 8.4[/C][C] 14.03[/C][C]-5.632[/C][/ROW]
[ROW][C]87[/C][C]-14.3[/C][C]-10.93[/C][C]-3.368[/C][/ROW]
[ROW][C]88[/C][C]-9.6[/C][C]-1.848[/C][C]-7.752[/C][/ROW]
[ROW][C]89[/C][C] 4.8[/C][C] 2.768[/C][C] 2.032[/C][/ROW]
[ROW][C]90[/C][C]-3.9[/C][C]-4.143[/C][C] 0.2429[/C][/ROW]
[ROW][C]91[/C][C] 6.2[/C][C]-1.904[/C][C] 8.104[/C][/ROW]
[ROW][C]92[/C][C] 0.2[/C][C]-1.723[/C][C] 1.923[/C][/ROW]
[ROW][C]93[/C][C]-7[/C][C]-6.588[/C][C]-0.4121[/C][/ROW]
[ROW][C]94[/C][C]-3.7[/C][C]-1.96[/C][C]-1.74[/C][/ROW]
[ROW][C]95[/C][C]-3[/C][C] 3.933[/C][C]-6.933[/C][/ROW]
[ROW][C]96[/C][C]-7.6[/C][C]-9.615[/C][C] 2.015[/C][/ROW]
[ROW][C]97[/C][C] 10[/C][C] 10.95[/C][C]-0.9469[/C][/ROW]
[ROW][C]98[/C][C]-23.9[/C][C]-24.26[/C][C] 0.3608[/C][/ROW]
[ROW][C]99[/C][C] 7.7[/C][C] 9.145[/C][C]-1.445[/C][/ROW]
[ROW][C]100[/C][C] 9.3[/C][C] 9.098[/C][C] 0.202[/C][/ROW]
[ROW][C]101[/C][C]-8.1[/C][C]-7.184[/C][C]-0.9156[/C][/ROW]
[ROW][C]102[/C][C]-3.2[/C][C]-2.511[/C][C]-0.6891[/C][/ROW]
[ROW][C]103[/C][C] 1.9[/C][C]-2.644[/C][C] 4.544[/C][/ROW]
[ROW][C]104[/C][C]-5.3[/C][C]-1.381[/C][C]-3.919[/C][/ROW]
[ROW][C]105[/C][C] 8.6[/C][C] 6.144[/C][C] 2.456[/C][/ROW]
[ROW][C]106[/C][C] 5.6[/C][C] 0.2466[/C][C] 5.353[/C][/ROW]
[ROW][C]107[/C][C]-5.9[/C][C]-7.398[/C][C] 1.498[/C][/ROW]
[ROW][C]108[/C][C]-4.2[/C][C] 4.523[/C][C]-8.723[/C][/ROW]
[ROW][C]109[/C][C]-5.8[/C][C]-7.42[/C][C] 1.62[/C][/ROW]
[ROW][C]110[/C][C] 13.5[/C][C] 16.87[/C][C]-3.369[/C][/ROW]
[ROW][C]111[/C][C] 2.9[/C][C]-0.3527[/C][C] 3.253[/C][/ROW]
[ROW][C]112[/C][C]-7.6[/C][C]-11.2[/C][C] 3.596[/C][/ROW]
[ROW][C]113[/C][C]-4.7[/C][C] 0.8037[/C][C]-5.504[/C][/ROW]
[ROW][C]114[/C][C] 17.6[/C][C] 11.7[/C][C] 5.905[/C][/ROW]
[ROW][C]115[/C][C]-14[/C][C]-7.163[/C][C]-6.837[/C][/ROW]
[ROW][C]116[/C][C] 4[/C][C]-2.956[/C][C] 6.956[/C][/ROW]
[ROW][C]117[/C][C] 2[/C][C] 3.67[/C][C]-1.67[/C][/ROW]
[ROW][C]118[/C][C]-4.9[/C][C]-8.677[/C][C] 3.777[/C][/ROW]
[ROW][C]119[/C][C]-5.9[/C][C] 1.506[/C][C]-7.406[/C][/ROW]
[ROW][C]120[/C][C] 16.3[/C][C] 17.26[/C][C]-0.9626[/C][/ROW]
[ROW][C]121[/C][C]-6.4[/C][C]-6.047[/C][C]-0.3526[/C][/ROW]
[ROW][C]122[/C][C] 2.4[/C][C]-3.197[/C][C] 5.597[/C][/ROW]
[ROW][C]123[/C][C]-2.5[/C][C] 6.419[/C][C]-8.919[/C][/ROW]
[ROW][C]124[/C][C]-1.7[/C][C]-8.618[/C][C] 6.918[/C][/ROW]
[ROW][C]125[/C][C] 8.4[/C][C] 5.934[/C][C] 2.466[/C][/ROW]
[ROW][C]126[/C][C]-4.5[/C][C] 0.122[/C][C]-4.622[/C][/ROW]
[ROW][C]127[/C][C]-0.1[/C][C] 1.707[/C][C]-1.807[/C][/ROW]
[ROW][C]128[/C][C]-5.4[/C][C] 3.493[/C][C]-8.893[/C][/ROW]
[ROW][C]129[/C][C] 8[/C][C]-4.722[/C][C] 12.72[/C][/ROW]
[ROW][C]130[/C][C]-3.9[/C][C] 3.275[/C][C]-7.175[/C][/ROW]
[ROW][C]131[/C][C]-1.7[/C][C]-3.734[/C][C] 2.034[/C][/ROW]
[ROW][C]132[/C][C] 2.1[/C][C]-2.192[/C][C] 4.292[/C][/ROW]
[ROW][C]133[/C][C]-4.1[/C][C]-0.008504[/C][C]-4.091[/C][/ROW]
[ROW][C]134[/C][C]-0.5[/C][C] 0.2824[/C][C]-0.7824[/C][/ROW]
[ROW][C]135[/C][C] 6[/C][C]-5.339[/C][C] 11.34[/C][/ROW]
[ROW][C]136[/C][C]-1.9[/C][C] 0.7383[/C][C]-2.638[/C][/ROW]
[ROW][C]137[/C][C] 6.3[/C][C] 9.729[/C][C]-3.429[/C][/ROW]
[ROW][C]138[/C][C]-6.6[/C][C]-8.362[/C][C] 1.762[/C][/ROW]
[ROW][C]139[/C][C]-9[/C][C]-1.608[/C][C]-7.392[/C][/ROW]
[ROW][C]140[/C][C] 15.5[/C][C] 7.013[/C][C] 8.487[/C][/ROW]
[ROW][C]141[/C][C]-6.2[/C][C]-5.803[/C][C]-0.3973[/C][/ROW]
[ROW][C]142[/C][C] 4[/C][C]-2.431[/C][C] 6.431[/C][/ROW]
[ROW][C]143[/C][C] 15.2[/C][C] 11.25[/C][C] 3.955[/C][/ROW]
[ROW][C]144[/C][C]-9.3[/C][C]-8.257[/C][C]-1.043[/C][/ROW]
[ROW][C]145[/C][C] 1[/C][C]-1.388[/C][C] 2.388[/C][/ROW]
[ROW][C]146[/C][C] 11[/C][C] 7.978[/C][C] 3.022[/C][/ROW]
[ROW][C]147[/C][C]-13.5[/C][C]-6.811[/C][C]-6.689[/C][/ROW]
[ROW][C]148[/C][C]-1.8[/C][C] 7.28[/C][C]-9.08[/C][/ROW]
[ROW][C]149[/C][C]-2.2[/C][C]-4.347[/C][C] 2.147[/C][/ROW]
[ROW][C]150[/C][C] 2.1[/C][C] 0.06166[/C][C] 2.038[/C][/ROW]
[ROW][C]151[/C][C] 10.1[/C][C] 8.187[/C][C] 1.913[/C][/ROW]
[ROW][C]152[/C][C]-10[/C][C]-9.569[/C][C]-0.431[/C][/ROW]
[ROW][C]153[/C][C]-7.3[/C][C] 4.518[/C][C]-11.82[/C][/ROW]
[ROW][C]154[/C][C] 1.2[/C][C] 7.629[/C][C]-6.429[/C][/ROW]
[ROW][C]155[/C][C]-9.2[/C][C]-11.21[/C][C] 2.011[/C][/ROW]
[ROW][C]156[/C][C] 7.8[/C][C] 4.101[/C][C] 3.699[/C][/ROW]
[ROW][C]157[/C][C]-0.8[/C][C]-0.6786[/C][C]-0.1214[/C][/ROW]
[ROW][C]158[/C][C]-8.6[/C][C]-2.875[/C][C]-5.725[/C][/ROW]
[ROW][C]159[/C][C]-4.5[/C][C] 0.8707[/C][C]-5.371[/C][/ROW]
[ROW][C]160[/C][C] 13.9[/C][C] 8.151[/C][C] 5.749[/C][/ROW]
[ROW][C]161[/C][C]-4.1[/C][C]-11.32[/C][C] 7.217[/C][/ROW]
[ROW][C]162[/C][C]-4.8[/C][C]-3.046[/C][C]-1.754[/C][/ROW]
[ROW][C]163[/C][C] 12.1[/C][C] 4.126[/C][C] 7.974[/C][/ROW]
[ROW][C]164[/C][C] 1.6[/C][C] 9.665[/C][C]-8.065[/C][/ROW]
[ROW][C]165[/C][C] 1.6[/C][C]-6.032[/C][C] 7.632[/C][/ROW]
[ROW][C]166[/C][C]-6.3[/C][C]-0.7465[/C][C]-5.553[/C][/ROW]
[ROW][C]167[/C][C] 10.7[/C][C] 8.492[/C][C] 2.208[/C][/ROW]
[ROW][C]168[/C][C]-17.8[/C][C]-16.82[/C][C]-0.9767[/C][/ROW]
[ROW][C]169[/C][C] 14.8[/C][C] 16.92[/C][C]-2.117[/C][/ROW]
[ROW][C]170[/C][C]-1.9[/C][C]-4.926[/C][C] 3.026[/C][/ROW]
[ROW][C]171[/C][C]-1[/C][C] 1.803[/C][C]-2.803[/C][/ROW]
[ROW][C]172[/C][C] 4.8[/C][C]-1.321[/C][C] 6.121[/C][/ROW]
[/TABLE]
Source: https://freestatistics.org/blog/index.php?pk=309905&T=5

Globally Unique Identifier (entire table): ba.freestatistics.org/blog/index.php?pk=309905&T=5

As an alternative you can also use a QR Code:  

The GUIDs for individual cells are displayed in the table below:

Multiple Linear Regression - Actuals, Interpolation, and Residuals
Time or IndexActualsInterpolationForecastResidualsPrediction Error
1-3.3-1.933-1.367
2 5.2 4.057 1.143
3-2.8-2.076-0.7239
4-8.8-1.681-7.119
5 7.8 6.319 1.481
6 7.1-4.532 11.63
7-6.1-2.571-3.529
8 5.7 11.98-6.276
9-0.5-10.3 9.797
10-0.1 4.134-4.234
11 12.5 8.302 4.198
12-4.3-7.262 2.962
13-0.1 1.739-1.839
14 8.8 7.701 1.099
15-13-8.132-4.868
16 12.6 9.336 3.264
17-3.4-4.879 1.479
18-8.6-4.677-3.923
19 16.6 10.94 5.656
20-7.3-6.097-1.203
21-4.3 0.7202-5.02
22 2-3.178 5.178
23-7.4-7.591 0.1905
24 1.7 4.83-3.13
25-5.2-0.03947-5.161
26-7.3-5.148-2.152
27-2.9-1.899-1.001
28-2.4-0.03108-2.369
29 5 0.8748 4.125
30-6.2-2.201-3.999
31 12.2 2.266 9.934
32-6.8-2.128-4.672
33 16.3 4.656 11.64
34-3.1 0.7185-3.819
35 16.4 6.146 10.25
36-17.2-11.99-5.211
37 18.7 17.12 1.576
38-1.5-5.705 4.205
39-12.3 1.601-13.9
40 5.1 3.601 1.499
41-8.6-5.001-3.599
42 14.9 10.68 4.225
43-13.2-11.07-2.126
44 4-1.886 5.886
45 0.5 2.066-1.566
46-4.6-3.022-1.578
47-14.5-3.521-10.98
48 8.4 9.566-1.166
49-2.9-11.36 8.459
50-4.8 2.933-7.733
51 17.9 8.635 9.265
52-10.7-6.431-4.269
53-2-0.5586-1.441
54-0.1 4.872-4.972
55-4.8-3.464-1.336
56-4.3-2.941-1.359
57 8.6 5.194 3.406
58 11 1.86 9.14
59-10.9-8.538-2.362
60 25.5 15.98 9.522
61-21.6-12.99-8.613
62 11 4.344 6.656
63-1.7 0.2617-1.962
64-11.3-8.764-2.536
65 16.2 15.5 0.7048
66-10.4-15.77 5.368
67-23.1-5.024-18.08
68 9.1 13.93-4.828
69-35.3-24.62-10.68
70-5.9-0.4789-5.421
71 7.8 9.302-1.502
72-23.8-23.96 0.164
73 18.4 18.27 0.1294
74-6.3-8.327 2.027
75 9.8-1.16 10.96
76 19.1 12.07 7.031
77-5.6-12.07 6.475
78 0.6 6.373-5.773
79 22.9 19.46 3.441
80-1.6-8.403 6.803
81 19.7 19.48 0.2219
82 2.7 7.629-4.929
83 12.4 3.81 8.59
84 3.2 2.967 0.2332
85-3.5-7.51 4.01
86 8.4 14.03-5.632
87-14.3-10.93-3.368
88-9.6-1.848-7.752
89 4.8 2.768 2.032
90-3.9-4.143 0.2429
91 6.2-1.904 8.104
92 0.2-1.723 1.923
93-7-6.588-0.4121
94-3.7-1.96-1.74
95-3 3.933-6.933
96-7.6-9.615 2.015
97 10 10.95-0.9469
98-23.9-24.26 0.3608
99 7.7 9.145-1.445
100 9.3 9.098 0.202
101-8.1-7.184-0.9156
102-3.2-2.511-0.6891
103 1.9-2.644 4.544
104-5.3-1.381-3.919
105 8.6 6.144 2.456
106 5.6 0.2466 5.353
107-5.9-7.398 1.498
108-4.2 4.523-8.723
109-5.8-7.42 1.62
110 13.5 16.87-3.369
111 2.9-0.3527 3.253
112-7.6-11.2 3.596
113-4.7 0.8037-5.504
114 17.6 11.7 5.905
115-14-7.163-6.837
116 4-2.956 6.956
117 2 3.67-1.67
118-4.9-8.677 3.777
119-5.9 1.506-7.406
120 16.3 17.26-0.9626
121-6.4-6.047-0.3526
122 2.4-3.197 5.597
123-2.5 6.419-8.919
124-1.7-8.618 6.918
125 8.4 5.934 2.466
126-4.5 0.122-4.622
127-0.1 1.707-1.807
128-5.4 3.493-8.893
129 8-4.722 12.72
130-3.9 3.275-7.175
131-1.7-3.734 2.034
132 2.1-2.192 4.292
133-4.1-0.008504-4.091
134-0.5 0.2824-0.7824
135 6-5.339 11.34
136-1.9 0.7383-2.638
137 6.3 9.729-3.429
138-6.6-8.362 1.762
139-9-1.608-7.392
140 15.5 7.013 8.487
141-6.2-5.803-0.3973
142 4-2.431 6.431
143 15.2 11.25 3.955
144-9.3-8.257-1.043
145 1-1.388 2.388
146 11 7.978 3.022
147-13.5-6.811-6.689
148-1.8 7.28-9.08
149-2.2-4.347 2.147
150 2.1 0.06166 2.038
151 10.1 8.187 1.913
152-10-9.569-0.431
153-7.3 4.518-11.82
154 1.2 7.629-6.429
155-9.2-11.21 2.011
156 7.8 4.101 3.699
157-0.8-0.6786-0.1214
158-8.6-2.875-5.725
159-4.5 0.8707-5.371
160 13.9 8.151 5.749
161-4.1-11.32 7.217
162-4.8-3.046-1.754
163 12.1 4.126 7.974
164 1.6 9.665-8.065
165 1.6-6.032 7.632
166-6.3-0.7465-5.553
167 10.7 8.492 2.208
168-17.8-16.82-0.9767
169 14.8 16.92-2.117
170-1.9-4.926 3.026
171-1 1.803-2.803
172 4.8-1.321 6.121


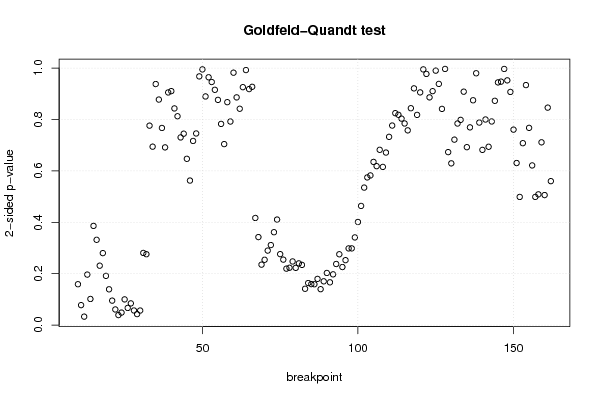
Goldfeld-Quandt test for Heteroskedasticity
p-valuesAlternative Hypothesis
breakpoint indexgreater2-sidedless
10 0.07944 0.1589 0.9206
11 0.03876 0.07753 0.9612
12 0.01633 0.03267 0.9837
13 0.09818 0.1964 0.9018
14 0.05075 0.1015 0.9492
15 0.1929 0.3857 0.8071
16 0.1659 0.3317 0.8341
17 0.1154 0.2309 0.8846
18 0.14 0.2799 0.86
19 0.09567 0.1913 0.9043
20 0.06954 0.1391 0.9305
21 0.04747 0.09495 0.9525
22 0.03033 0.06065 0.9697
23 0.01936 0.03873 0.9806
24 0.0242 0.04841 0.9758
25 0.04992 0.09984 0.9501
26 0.03327 0.06654 0.9667
27 0.04218 0.08437 0.9578
28 0.02834 0.05667 0.9717
29 0.02131 0.04262 0.9787
30 0.02826 0.05651 0.9717
31 0.1403 0.2806 0.8597
32 0.1378 0.2756 0.8622
33 0.3879 0.7759 0.6121
34 0.347 0.694 0.653
35 0.4689 0.9379 0.5311
36 0.4387 0.8774 0.5613
37 0.3834 0.7669 0.6166
38 0.3457 0.6914 0.6543
39 0.4525 0.9051 0.5475
40 0.4551 0.9103 0.5449
41 0.4215 0.843 0.5785
42 0.4063 0.8125 0.5937
43 0.3651 0.7301 0.6349
44 0.3723 0.7445 0.6277
45 0.3234 0.6469 0.6766
46 0.2811 0.5622 0.7189
47 0.3582 0.7163 0.6418
48 0.3727 0.7455 0.6273
49 0.4838 0.9677 0.5162
50 0.5026 0.9949 0.4974
51 0.5552 0.8895 0.4448
52 0.5179 0.9641 0.4821
53 0.4728 0.9457 0.5272
54 0.4577 0.9154 0.5423
55 0.4381 0.8761 0.5619
56 0.3913 0.7827 0.6087
57 0.3521 0.7042 0.6479
58 0.4336 0.8673 0.5664
59 0.396 0.792 0.604
60 0.509 0.982 0.491
61 0.557 0.886 0.443
62 0.5791 0.8417 0.4209
63 0.5372 0.9256 0.4628
64 0.4961 0.9923 0.5039
65 0.4591 0.9183 0.5409
66 0.4635 0.927 0.5365
67 0.7917 0.4167 0.2083
68 0.8289 0.3423 0.1711
69 0.8825 0.2349 0.1175
70 0.873 0.254 0.127
71 0.8551 0.2898 0.1449
72 0.8444 0.3113 0.1556
73 0.8194 0.3613 0.1806
74 0.7948 0.4104 0.2052
75 0.862 0.2759 0.138
76 0.8727 0.2546 0.1273
77 0.8903 0.2194 0.1097
78 0.8885 0.223 0.1115
79 0.8763 0.2475 0.1237
80 0.8887 0.2225 0.1113
81 0.88 0.24 0.12
82 0.883 0.2341 0.117
83 0.9294 0.1411 0.07057
84 0.9183 0.1635 0.08173
85 0.9203 0.1593 0.07965
86 0.9206 0.1588 0.07938
87 0.9102 0.1796 0.08982
88 0.9302 0.1396 0.06981
89 0.9149 0.1702 0.0851
90 0.8987 0.2026 0.1013
91 0.9168 0.1663 0.08316
92 0.9013 0.1973 0.09867
93 0.8812 0.2376 0.1188
94 0.8623 0.2755 0.1377
95 0.8871 0.2257 0.1129
96 0.8738 0.2525 0.1262
97 0.8509 0.2983 0.1491
98 0.8508 0.2984 0.1492
99 0.8295 0.341 0.1705
100 0.7995 0.401 0.2005
101 0.7683 0.4635 0.2317
102 0.7326 0.5349 0.2674
103 0.7128 0.5745 0.2872
104 0.7089 0.5822 0.2911
105 0.6826 0.6348 0.3174
106 0.6909 0.6183 0.3091
107 0.6591 0.6819 0.3409
108 0.6923 0.6153 0.3077
109 0.6644 0.6712 0.3356
110 0.6338 0.7323 0.3662
111 0.6118 0.7763 0.3882
112 0.5877 0.8245 0.4123
113 0.5909 0.8181 0.4091
114 0.5984 0.8032 0.4016
115 0.6078 0.7843 0.3922
116 0.6212 0.7577 0.3788
117 0.5782 0.8437 0.4218
118 0.5395 0.921 0.4605
119 0.5911 0.8177 0.4089
120 0.5473 0.9054 0.4527
121 0.4974 0.9949 0.5026
122 0.5114 0.9772 0.4886
123 0.557 0.8861 0.443
124 0.5449 0.9102 0.4551
125 0.505 0.99 0.495
126 0.4692 0.9383 0.5308
127 0.4205 0.8411 0.5795
128 0.5017 0.9966 0.4983
129 0.6635 0.673 0.3365
130 0.6854 0.6293 0.3146
131 0.6393 0.7214 0.3607
132 0.6079 0.7842 0.3921
133 0.6008 0.7984 0.3992
134 0.546 0.9081 0.454
135 0.6539 0.6921 0.3461
136 0.6154 0.7693 0.3846
137 0.5626 0.8747 0.4374
138 0.5101 0.9798 0.4899
139 0.606 0.7879 0.394
140 0.6592 0.6817 0.3408
141 0.6001 0.7999 0.3999
142 0.6531 0.6938 0.3469
143 0.6039 0.7921 0.3961
144 0.5637 0.8726 0.4363
145 0.5279 0.9442 0.4721
146 0.4736 0.9471 0.5264
147 0.5018 0.9964 0.4982
148 0.5239 0.9522 0.4761
149 0.4536 0.9072 0.5464
150 0.3802 0.7604 0.6198
151 0.3153 0.6305 0.6847
152 0.2493 0.4985 0.7507
153 0.3538 0.7077 0.6462
154 0.4669 0.9338 0.5331
155 0.3836 0.7673 0.6164
156 0.3106 0.6211 0.6894
157 0.2493 0.4986 0.7507
158 0.2543 0.5086 0.7457
159 0.3555 0.7111 0.6445
160 0.2529 0.5058 0.7471
161 0.423 0.8461 0.577
162 0.28 0.56 0.72

\begin{tabular}{lllllllll}
\hline
Goldfeld-Quandt test for Heteroskedasticity \tabularnewline
p-values & Alternative Hypothesis \tabularnewline
breakpoint index & greater & 2-sided & less \tabularnewline
10 &  0.07944 &  0.1589 &  0.9206 \tabularnewline
11 &  0.03876 &  0.07753 &  0.9612 \tabularnewline
12 &  0.01633 &  0.03267 &  0.9837 \tabularnewline
13 &  0.09818 &  0.1964 &  0.9018 \tabularnewline
14 &  0.05075 &  0.1015 &  0.9492 \tabularnewline
15 &  0.1929 &  0.3857 &  0.8071 \tabularnewline
16 &  0.1659 &  0.3317 &  0.8341 \tabularnewline
17 &  0.1154 &  0.2309 &  0.8846 \tabularnewline
18 &  0.14 &  0.2799 &  0.86 \tabularnewline
19 &  0.09567 &  0.1913 &  0.9043 \tabularnewline
20 &  0.06954 &  0.1391 &  0.9305 \tabularnewline
21 &  0.04747 &  0.09495 &  0.9525 \tabularnewline
22 &  0.03033 &  0.06065 &  0.9697 \tabularnewline
23 &  0.01936 &  0.03873 &  0.9806 \tabularnewline
24 &  0.0242 &  0.04841 &  0.9758 \tabularnewline
25 &  0.04992 &  0.09984 &  0.9501 \tabularnewline
26 &  0.03327 &  0.06654 &  0.9667 \tabularnewline
27 &  0.04218 &  0.08437 &  0.9578 \tabularnewline
28 &  0.02834 &  0.05667 &  0.9717 \tabularnewline
29 &  0.02131 &  0.04262 &  0.9787 \tabularnewline
30 &  0.02826 &  0.05651 &  0.9717 \tabularnewline
31 &  0.1403 &  0.2806 &  0.8597 \tabularnewline
32 &  0.1378 &  0.2756 &  0.8622 \tabularnewline
33 &  0.3879 &  0.7759 &  0.6121 \tabularnewline
34 &  0.347 &  0.694 &  0.653 \tabularnewline
35 &  0.4689 &  0.9379 &  0.5311 \tabularnewline
36 &  0.4387 &  0.8774 &  0.5613 \tabularnewline
37 &  0.3834 &  0.7669 &  0.6166 \tabularnewline
38 &  0.3457 &  0.6914 &  0.6543 \tabularnewline
39 &  0.4525 &  0.9051 &  0.5475 \tabularnewline
40 &  0.4551 &  0.9103 &  0.5449 \tabularnewline
41 &  0.4215 &  0.843 &  0.5785 \tabularnewline
42 &  0.4063 &  0.8125 &  0.5937 \tabularnewline
43 &  0.3651 &  0.7301 &  0.6349 \tabularnewline
44 &  0.3723 &  0.7445 &  0.6277 \tabularnewline
45 &  0.3234 &  0.6469 &  0.6766 \tabularnewline
46 &  0.2811 &  0.5622 &  0.7189 \tabularnewline
47 &  0.3582 &  0.7163 &  0.6418 \tabularnewline
48 &  0.3727 &  0.7455 &  0.6273 \tabularnewline
49 &  0.4838 &  0.9677 &  0.5162 \tabularnewline
50 &  0.5026 &  0.9949 &  0.4974 \tabularnewline
51 &  0.5552 &  0.8895 &  0.4448 \tabularnewline
52 &  0.5179 &  0.9641 &  0.4821 \tabularnewline
53 &  0.4728 &  0.9457 &  0.5272 \tabularnewline
54 &  0.4577 &  0.9154 &  0.5423 \tabularnewline
55 &  0.4381 &  0.8761 &  0.5619 \tabularnewline
56 &  0.3913 &  0.7827 &  0.6087 \tabularnewline
57 &  0.3521 &  0.7042 &  0.6479 \tabularnewline
58 &  0.4336 &  0.8673 &  0.5664 \tabularnewline
59 &  0.396 &  0.792 &  0.604 \tabularnewline
60 &  0.509 &  0.982 &  0.491 \tabularnewline
61 &  0.557 &  0.886 &  0.443 \tabularnewline
62 &  0.5791 &  0.8417 &  0.4209 \tabularnewline
63 &  0.5372 &  0.9256 &  0.4628 \tabularnewline
64 &  0.4961 &  0.9923 &  0.5039 \tabularnewline
65 &  0.4591 &  0.9183 &  0.5409 \tabularnewline
66 &  0.4635 &  0.927 &  0.5365 \tabularnewline
67 &  0.7917 &  0.4167 &  0.2083 \tabularnewline
68 &  0.8289 &  0.3423 &  0.1711 \tabularnewline
69 &  0.8825 &  0.2349 &  0.1175 \tabularnewline
70 &  0.873 &  0.254 &  0.127 \tabularnewline
71 &  0.8551 &  0.2898 &  0.1449 \tabularnewline
72 &  0.8444 &  0.3113 &  0.1556 \tabularnewline
73 &  0.8194 &  0.3613 &  0.1806 \tabularnewline
74 &  0.7948 &  0.4104 &  0.2052 \tabularnewline
75 &  0.862 &  0.2759 &  0.138 \tabularnewline
76 &  0.8727 &  0.2546 &  0.1273 \tabularnewline
77 &  0.8903 &  0.2194 &  0.1097 \tabularnewline
78 &  0.8885 &  0.223 &  0.1115 \tabularnewline
79 &  0.8763 &  0.2475 &  0.1237 \tabularnewline
80 &  0.8887 &  0.2225 &  0.1113 \tabularnewline
81 &  0.88 &  0.24 &  0.12 \tabularnewline
82 &  0.883 &  0.2341 &  0.117 \tabularnewline
83 &  0.9294 &  0.1411 &  0.07057 \tabularnewline
84 &  0.9183 &  0.1635 &  0.08173 \tabularnewline
85 &  0.9203 &  0.1593 &  0.07965 \tabularnewline
86 &  0.9206 &  0.1588 &  0.07938 \tabularnewline
87 &  0.9102 &  0.1796 &  0.08982 \tabularnewline
88 &  0.9302 &  0.1396 &  0.06981 \tabularnewline
89 &  0.9149 &  0.1702 &  0.0851 \tabularnewline
90 &  0.8987 &  0.2026 &  0.1013 \tabularnewline
91 &  0.9168 &  0.1663 &  0.08316 \tabularnewline
92 &  0.9013 &  0.1973 &  0.09867 \tabularnewline
93 &  0.8812 &  0.2376 &  0.1188 \tabularnewline
94 &  0.8623 &  0.2755 &  0.1377 \tabularnewline
95 &  0.8871 &  0.2257 &  0.1129 \tabularnewline
96 &  0.8738 &  0.2525 &  0.1262 \tabularnewline
97 &  0.8509 &  0.2983 &  0.1491 \tabularnewline
98 &  0.8508 &  0.2984 &  0.1492 \tabularnewline
99 &  0.8295 &  0.341 &  0.1705 \tabularnewline
100 &  0.7995 &  0.401 &  0.2005 \tabularnewline
101 &  0.7683 &  0.4635 &  0.2317 \tabularnewline
102 &  0.7326 &  0.5349 &  0.2674 \tabularnewline
103 &  0.7128 &  0.5745 &  0.2872 \tabularnewline
104 &  0.7089 &  0.5822 &  0.2911 \tabularnewline
105 &  0.6826 &  0.6348 &  0.3174 \tabularnewline
106 &  0.6909 &  0.6183 &  0.3091 \tabularnewline
107 &  0.6591 &  0.6819 &  0.3409 \tabularnewline
108 &  0.6923 &  0.6153 &  0.3077 \tabularnewline
109 &  0.6644 &  0.6712 &  0.3356 \tabularnewline
110 &  0.6338 &  0.7323 &  0.3662 \tabularnewline
111 &  0.6118 &  0.7763 &  0.3882 \tabularnewline
112 &  0.5877 &  0.8245 &  0.4123 \tabularnewline
113 &  0.5909 &  0.8181 &  0.4091 \tabularnewline
114 &  0.5984 &  0.8032 &  0.4016 \tabularnewline
115 &  0.6078 &  0.7843 &  0.3922 \tabularnewline
116 &  0.6212 &  0.7577 &  0.3788 \tabularnewline
117 &  0.5782 &  0.8437 &  0.4218 \tabularnewline
118 &  0.5395 &  0.921 &  0.4605 \tabularnewline
119 &  0.5911 &  0.8177 &  0.4089 \tabularnewline
120 &  0.5473 &  0.9054 &  0.4527 \tabularnewline
121 &  0.4974 &  0.9949 &  0.5026 \tabularnewline
122 &  0.5114 &  0.9772 &  0.4886 \tabularnewline
123 &  0.557 &  0.8861 &  0.443 \tabularnewline
124 &  0.5449 &  0.9102 &  0.4551 \tabularnewline
125 &  0.505 &  0.99 &  0.495 \tabularnewline
126 &  0.4692 &  0.9383 &  0.5308 \tabularnewline
127 &  0.4205 &  0.8411 &  0.5795 \tabularnewline
128 &  0.5017 &  0.9966 &  0.4983 \tabularnewline
129 &  0.6635 &  0.673 &  0.3365 \tabularnewline
130 &  0.6854 &  0.6293 &  0.3146 \tabularnewline
131 &  0.6393 &  0.7214 &  0.3607 \tabularnewline
132 &  0.6079 &  0.7842 &  0.3921 \tabularnewline
133 &  0.6008 &  0.7984 &  0.3992 \tabularnewline
134 &  0.546 &  0.9081 &  0.454 \tabularnewline
135 &  0.6539 &  0.6921 &  0.3461 \tabularnewline
136 &  0.6154 &  0.7693 &  0.3846 \tabularnewline
137 &  0.5626 &  0.8747 &  0.4374 \tabularnewline
138 &  0.5101 &  0.9798 &  0.4899 \tabularnewline
139 &  0.606 &  0.7879 &  0.394 \tabularnewline
140 &  0.6592 &  0.6817 &  0.3408 \tabularnewline
141 &  0.6001 &  0.7999 &  0.3999 \tabularnewline
142 &  0.6531 &  0.6938 &  0.3469 \tabularnewline
143 &  0.6039 &  0.7921 &  0.3961 \tabularnewline
144 &  0.5637 &  0.8726 &  0.4363 \tabularnewline
145 &  0.5279 &  0.9442 &  0.4721 \tabularnewline
146 &  0.4736 &  0.9471 &  0.5264 \tabularnewline
147 &  0.5018 &  0.9964 &  0.4982 \tabularnewline
148 &  0.5239 &  0.9522 &  0.4761 \tabularnewline
149 &  0.4536 &  0.9072 &  0.5464 \tabularnewline
150 &  0.3802 &  0.7604 &  0.6198 \tabularnewline
151 &  0.3153 &  0.6305 &  0.6847 \tabularnewline
152 &  0.2493 &  0.4985 &  0.7507 \tabularnewline
153 &  0.3538 &  0.7077 &  0.6462 \tabularnewline
154 &  0.4669 &  0.9338 &  0.5331 \tabularnewline
155 &  0.3836 &  0.7673 &  0.6164 \tabularnewline
156 &  0.3106 &  0.6211 &  0.6894 \tabularnewline
157 &  0.2493 &  0.4986 &  0.7507 \tabularnewline
158 &  0.2543 &  0.5086 &  0.7457 \tabularnewline
159 &  0.3555 &  0.7111 &  0.6445 \tabularnewline
160 &  0.2529 &  0.5058 &  0.7471 \tabularnewline
161 &  0.423 &  0.8461 &  0.577 \tabularnewline
162 &  0.28 &  0.56 &  0.72 \tabularnewline
\hline
\end{tabular}
%Source: https://freestatistics.org/blog/index.php?pk=309905&T=6

[TABLE]
[ROW][C]Goldfeld-Quandt test for Heteroskedasticity[/C][/ROW]
[ROW][C]p-values[/C][C]Alternative Hypothesis[/C][/ROW]
[ROW][C]breakpoint index[/C][C]greater[/C][C]2-sided[/C][C]less[/C][/ROW]
[ROW][C]10[/C][C] 0.07944[/C][C] 0.1589[/C][C] 0.9206[/C][/ROW]
[ROW][C]11[/C][C] 0.03876[/C][C] 0.07753[/C][C] 0.9612[/C][/ROW]
[ROW][C]12[/C][C] 0.01633[/C][C] 0.03267[/C][C] 0.9837[/C][/ROW]
[ROW][C]13[/C][C] 0.09818[/C][C] 0.1964[/C][C] 0.9018[/C][/ROW]
[ROW][C]14[/C][C] 0.05075[/C][C] 0.1015[/C][C] 0.9492[/C][/ROW]
[ROW][C]15[/C][C] 0.1929[/C][C] 0.3857[/C][C] 0.8071[/C][/ROW]
[ROW][C]16[/C][C] 0.1659[/C][C] 0.3317[/C][C] 0.8341[/C][/ROW]
[ROW][C]17[/C][C] 0.1154[/C][C] 0.2309[/C][C] 0.8846[/C][/ROW]
[ROW][C]18[/C][C] 0.14[/C][C] 0.2799[/C][C] 0.86[/C][/ROW]
[ROW][C]19[/C][C] 0.09567[/C][C] 0.1913[/C][C] 0.9043[/C][/ROW]
[ROW][C]20[/C][C] 0.06954[/C][C] 0.1391[/C][C] 0.9305[/C][/ROW]
[ROW][C]21[/C][C] 0.04747[/C][C] 0.09495[/C][C] 0.9525[/C][/ROW]
[ROW][C]22[/C][C] 0.03033[/C][C] 0.06065[/C][C] 0.9697[/C][/ROW]
[ROW][C]23[/C][C] 0.01936[/C][C] 0.03873[/C][C] 0.9806[/C][/ROW]
[ROW][C]24[/C][C] 0.0242[/C][C] 0.04841[/C][C] 0.9758[/C][/ROW]
[ROW][C]25[/C][C] 0.04992[/C][C] 0.09984[/C][C] 0.9501[/C][/ROW]
[ROW][C]26[/C][C] 0.03327[/C][C] 0.06654[/C][C] 0.9667[/C][/ROW]
[ROW][C]27[/C][C] 0.04218[/C][C] 0.08437[/C][C] 0.9578[/C][/ROW]
[ROW][C]28[/C][C] 0.02834[/C][C] 0.05667[/C][C] 0.9717[/C][/ROW]
[ROW][C]29[/C][C] 0.02131[/C][C] 0.04262[/C][C] 0.9787[/C][/ROW]
[ROW][C]30[/C][C] 0.02826[/C][C] 0.05651[/C][C] 0.9717[/C][/ROW]
[ROW][C]31[/C][C] 0.1403[/C][C] 0.2806[/C][C] 0.8597[/C][/ROW]
[ROW][C]32[/C][C] 0.1378[/C][C] 0.2756[/C][C] 0.8622[/C][/ROW]
[ROW][C]33[/C][C] 0.3879[/C][C] 0.7759[/C][C] 0.6121[/C][/ROW]
[ROW][C]34[/C][C] 0.347[/C][C] 0.694[/C][C] 0.653[/C][/ROW]
[ROW][C]35[/C][C] 0.4689[/C][C] 0.9379[/C][C] 0.5311[/C][/ROW]
[ROW][C]36[/C][C] 0.4387[/C][C] 0.8774[/C][C] 0.5613[/C][/ROW]
[ROW][C]37[/C][C] 0.3834[/C][C] 0.7669[/C][C] 0.6166[/C][/ROW]
[ROW][C]38[/C][C] 0.3457[/C][C] 0.6914[/C][C] 0.6543[/C][/ROW]
[ROW][C]39[/C][C] 0.4525[/C][C] 0.9051[/C][C] 0.5475[/C][/ROW]
[ROW][C]40[/C][C] 0.4551[/C][C] 0.9103[/C][C] 0.5449[/C][/ROW]
[ROW][C]41[/C][C] 0.4215[/C][C] 0.843[/C][C] 0.5785[/C][/ROW]
[ROW][C]42[/C][C] 0.4063[/C][C] 0.8125[/C][C] 0.5937[/C][/ROW]
[ROW][C]43[/C][C] 0.3651[/C][C] 0.7301[/C][C] 0.6349[/C][/ROW]
[ROW][C]44[/C][C] 0.3723[/C][C] 0.7445[/C][C] 0.6277[/C][/ROW]
[ROW][C]45[/C][C] 0.3234[/C][C] 0.6469[/C][C] 0.6766[/C][/ROW]
[ROW][C]46[/C][C] 0.2811[/C][C] 0.5622[/C][C] 0.7189[/C][/ROW]
[ROW][C]47[/C][C] 0.3582[/C][C] 0.7163[/C][C] 0.6418[/C][/ROW]
[ROW][C]48[/C][C] 0.3727[/C][C] 0.7455[/C][C] 0.6273[/C][/ROW]
[ROW][C]49[/C][C] 0.4838[/C][C] 0.9677[/C][C] 0.5162[/C][/ROW]
[ROW][C]50[/C][C] 0.5026[/C][C] 0.9949[/C][C] 0.4974[/C][/ROW]
[ROW][C]51[/C][C] 0.5552[/C][C] 0.8895[/C][C] 0.4448[/C][/ROW]
[ROW][C]52[/C][C] 0.5179[/C][C] 0.9641[/C][C] 0.4821[/C][/ROW]
[ROW][C]53[/C][C] 0.4728[/C][C] 0.9457[/C][C] 0.5272[/C][/ROW]
[ROW][C]54[/C][C] 0.4577[/C][C] 0.9154[/C][C] 0.5423[/C][/ROW]
[ROW][C]55[/C][C] 0.4381[/C][C] 0.8761[/C][C] 0.5619[/C][/ROW]
[ROW][C]56[/C][C] 0.3913[/C][C] 0.7827[/C][C] 0.6087[/C][/ROW]
[ROW][C]57[/C][C] 0.3521[/C][C] 0.7042[/C][C] 0.6479[/C][/ROW]
[ROW][C]58[/C][C] 0.4336[/C][C] 0.8673[/C][C] 0.5664[/C][/ROW]
[ROW][C]59[/C][C] 0.396[/C][C] 0.792[/C][C] 0.604[/C][/ROW]
[ROW][C]60[/C][C] 0.509[/C][C] 0.982[/C][C] 0.491[/C][/ROW]
[ROW][C]61[/C][C] 0.557[/C][C] 0.886[/C][C] 0.443[/C][/ROW]
[ROW][C]62[/C][C] 0.5791[/C][C] 0.8417[/C][C] 0.4209[/C][/ROW]
[ROW][C]63[/C][C] 0.5372[/C][C] 0.9256[/C][C] 0.4628[/C][/ROW]
[ROW][C]64[/C][C] 0.4961[/C][C] 0.9923[/C][C] 0.5039[/C][/ROW]
[ROW][C]65[/C][C] 0.4591[/C][C] 0.9183[/C][C] 0.5409[/C][/ROW]
[ROW][C]66[/C][C] 0.4635[/C][C] 0.927[/C][C] 0.5365[/C][/ROW]
[ROW][C]67[/C][C] 0.7917[/C][C] 0.4167[/C][C] 0.2083[/C][/ROW]
[ROW][C]68[/C][C] 0.8289[/C][C] 0.3423[/C][C] 0.1711[/C][/ROW]
[ROW][C]69[/C][C] 0.8825[/C][C] 0.2349[/C][C] 0.1175[/C][/ROW]
[ROW][C]70[/C][C] 0.873[/C][C] 0.254[/C][C] 0.127[/C][/ROW]
[ROW][C]71[/C][C] 0.8551[/C][C] 0.2898[/C][C] 0.1449[/C][/ROW]
[ROW][C]72[/C][C] 0.8444[/C][C] 0.3113[/C][C] 0.1556[/C][/ROW]
[ROW][C]73[/C][C] 0.8194[/C][C] 0.3613[/C][C] 0.1806[/C][/ROW]
[ROW][C]74[/C][C] 0.7948[/C][C] 0.4104[/C][C] 0.2052[/C][/ROW]
[ROW][C]75[/C][C] 0.862[/C][C] 0.2759[/C][C] 0.138[/C][/ROW]
[ROW][C]76[/C][C] 0.8727[/C][C] 0.2546[/C][C] 0.1273[/C][/ROW]
[ROW][C]77[/C][C] 0.8903[/C][C] 0.2194[/C][C] 0.1097[/C][/ROW]
[ROW][C]78[/C][C] 0.8885[/C][C] 0.223[/C][C] 0.1115[/C][/ROW]
[ROW][C]79[/C][C] 0.8763[/C][C] 0.2475[/C][C] 0.1237[/C][/ROW]
[ROW][C]80[/C][C] 0.8887[/C][C] 0.2225[/C][C] 0.1113[/C][/ROW]
[ROW][C]81[/C][C] 0.88[/C][C] 0.24[/C][C] 0.12[/C][/ROW]
[ROW][C]82[/C][C] 0.883[/C][C] 0.2341[/C][C] 0.117[/C][/ROW]
[ROW][C]83[/C][C] 0.9294[/C][C] 0.1411[/C][C] 0.07057[/C][/ROW]
[ROW][C]84[/C][C] 0.9183[/C][C] 0.1635[/C][C] 0.08173[/C][/ROW]
[ROW][C]85[/C][C] 0.9203[/C][C] 0.1593[/C][C] 0.07965[/C][/ROW]
[ROW][C]86[/C][C] 0.9206[/C][C] 0.1588[/C][C] 0.07938[/C][/ROW]
[ROW][C]87[/C][C] 0.9102[/C][C] 0.1796[/C][C] 0.08982[/C][/ROW]
[ROW][C]88[/C][C] 0.9302[/C][C] 0.1396[/C][C] 0.06981[/C][/ROW]
[ROW][C]89[/C][C] 0.9149[/C][C] 0.1702[/C][C] 0.0851[/C][/ROW]
[ROW][C]90[/C][C] 0.8987[/C][C] 0.2026[/C][C] 0.1013[/C][/ROW]
[ROW][C]91[/C][C] 0.9168[/C][C] 0.1663[/C][C] 0.08316[/C][/ROW]
[ROW][C]92[/C][C] 0.9013[/C][C] 0.1973[/C][C] 0.09867[/C][/ROW]
[ROW][C]93[/C][C] 0.8812[/C][C] 0.2376[/C][C] 0.1188[/C][/ROW]
[ROW][C]94[/C][C] 0.8623[/C][C] 0.2755[/C][C] 0.1377[/C][/ROW]
[ROW][C]95[/C][C] 0.8871[/C][C] 0.2257[/C][C] 0.1129[/C][/ROW]
[ROW][C]96[/C][C] 0.8738[/C][C] 0.2525[/C][C] 0.1262[/C][/ROW]
[ROW][C]97[/C][C] 0.8509[/C][C] 0.2983[/C][C] 0.1491[/C][/ROW]
[ROW][C]98[/C][C] 0.8508[/C][C] 0.2984[/C][C] 0.1492[/C][/ROW]
[ROW][C]99[/C][C] 0.8295[/C][C] 0.341[/C][C] 0.1705[/C][/ROW]
[ROW][C]100[/C][C] 0.7995[/C][C] 0.401[/C][C] 0.2005[/C][/ROW]
[ROW][C]101[/C][C] 0.7683[/C][C] 0.4635[/C][C] 0.2317[/C][/ROW]
[ROW][C]102[/C][C] 0.7326[/C][C] 0.5349[/C][C] 0.2674[/C][/ROW]
[ROW][C]103[/C][C] 0.7128[/C][C] 0.5745[/C][C] 0.2872[/C][/ROW]
[ROW][C]104[/C][C] 0.7089[/C][C] 0.5822[/C][C] 0.2911[/C][/ROW]
[ROW][C]105[/C][C] 0.6826[/C][C] 0.6348[/C][C] 0.3174[/C][/ROW]
[ROW][C]106[/C][C] 0.6909[/C][C] 0.6183[/C][C] 0.3091[/C][/ROW]
[ROW][C]107[/C][C] 0.6591[/C][C] 0.6819[/C][C] 0.3409[/C][/ROW]
[ROW][C]108[/C][C] 0.6923[/C][C] 0.6153[/C][C] 0.3077[/C][/ROW]
[ROW][C]109[/C][C] 0.6644[/C][C] 0.6712[/C][C] 0.3356[/C][/ROW]
[ROW][C]110[/C][C] 0.6338[/C][C] 0.7323[/C][C] 0.3662[/C][/ROW]
[ROW][C]111[/C][C] 0.6118[/C][C] 0.7763[/C][C] 0.3882[/C][/ROW]
[ROW][C]112[/C][C] 0.5877[/C][C] 0.8245[/C][C] 0.4123[/C][/ROW]
[ROW][C]113[/C][C] 0.5909[/C][C] 0.8181[/C][C] 0.4091[/C][/ROW]
[ROW][C]114[/C][C] 0.5984[/C][C] 0.8032[/C][C] 0.4016[/C][/ROW]
[ROW][C]115[/C][C] 0.6078[/C][C] 0.7843[/C][C] 0.3922[/C][/ROW]
[ROW][C]116[/C][C] 0.6212[/C][C] 0.7577[/C][C] 0.3788[/C][/ROW]
[ROW][C]117[/C][C] 0.5782[/C][C] 0.8437[/C][C] 0.4218[/C][/ROW]
[ROW][C]118[/C][C] 0.5395[/C][C] 0.921[/C][C] 0.4605[/C][/ROW]
[ROW][C]119[/C][C] 0.5911[/C][C] 0.8177[/C][C] 0.4089[/C][/ROW]
[ROW][C]120[/C][C] 0.5473[/C][C] 0.9054[/C][C] 0.4527[/C][/ROW]
[ROW][C]121[/C][C] 0.4974[/C][C] 0.9949[/C][C] 0.5026[/C][/ROW]
[ROW][C]122[/C][C] 0.5114[/C][C] 0.9772[/C][C] 0.4886[/C][/ROW]
[ROW][C]123[/C][C] 0.557[/C][C] 0.8861[/C][C] 0.443[/C][/ROW]
[ROW][C]124[/C][C] 0.5449[/C][C] 0.9102[/C][C] 0.4551[/C][/ROW]
[ROW][C]125[/C][C] 0.505[/C][C] 0.99[/C][C] 0.495[/C][/ROW]
[ROW][C]126[/C][C] 0.4692[/C][C] 0.9383[/C][C] 0.5308[/C][/ROW]
[ROW][C]127[/C][C] 0.4205[/C][C] 0.8411[/C][C] 0.5795[/C][/ROW]
[ROW][C]128[/C][C] 0.5017[/C][C] 0.9966[/C][C] 0.4983[/C][/ROW]
[ROW][C]129[/C][C] 0.6635[/C][C] 0.673[/C][C] 0.3365[/C][/ROW]
[ROW][C]130[/C][C] 0.6854[/C][C] 0.6293[/C][C] 0.3146[/C][/ROW]
[ROW][C]131[/C][C] 0.6393[/C][C] 0.7214[/C][C] 0.3607[/C][/ROW]
[ROW][C]132[/C][C] 0.6079[/C][C] 0.7842[/C][C] 0.3921[/C][/ROW]
[ROW][C]133[/C][C] 0.6008[/C][C] 0.7984[/C][C] 0.3992[/C][/ROW]
[ROW][C]134[/C][C] 0.546[/C][C] 0.9081[/C][C] 0.454[/C][/ROW]
[ROW][C]135[/C][C] 0.6539[/C][C] 0.6921[/C][C] 0.3461[/C][/ROW]
[ROW][C]136[/C][C] 0.6154[/C][C] 0.7693[/C][C] 0.3846[/C][/ROW]
[ROW][C]137[/C][C] 0.5626[/C][C] 0.8747[/C][C] 0.4374[/C][/ROW]
[ROW][C]138[/C][C] 0.5101[/C][C] 0.9798[/C][C] 0.4899[/C][/ROW]
[ROW][C]139[/C][C] 0.606[/C][C] 0.7879[/C][C] 0.394[/C][/ROW]
[ROW][C]140[/C][C] 0.6592[/C][C] 0.6817[/C][C] 0.3408[/C][/ROW]
[ROW][C]141[/C][C] 0.6001[/C][C] 0.7999[/C][C] 0.3999[/C][/ROW]
[ROW][C]142[/C][C] 0.6531[/C][C] 0.6938[/C][C] 0.3469[/C][/ROW]
[ROW][C]143[/C][C] 0.6039[/C][C] 0.7921[/C][C] 0.3961[/C][/ROW]
[ROW][C]144[/C][C] 0.5637[/C][C] 0.8726[/C][C] 0.4363[/C][/ROW]
[ROW][C]145[/C][C] 0.5279[/C][C] 0.9442[/C][C] 0.4721[/C][/ROW]
[ROW][C]146[/C][C] 0.4736[/C][C] 0.9471[/C][C] 0.5264[/C][/ROW]
[ROW][C]147[/C][C] 0.5018[/C][C] 0.9964[/C][C] 0.4982[/C][/ROW]
[ROW][C]148[/C][C] 0.5239[/C][C] 0.9522[/C][C] 0.4761[/C][/ROW]
[ROW][C]149[/C][C] 0.4536[/C][C] 0.9072[/C][C] 0.5464[/C][/ROW]
[ROW][C]150[/C][C] 0.3802[/C][C] 0.7604[/C][C] 0.6198[/C][/ROW]
[ROW][C]151[/C][C] 0.3153[/C][C] 0.6305[/C][C] 0.6847[/C][/ROW]
[ROW][C]152[/C][C] 0.2493[/C][C] 0.4985[/C][C] 0.7507[/C][/ROW]
[ROW][C]153[/C][C] 0.3538[/C][C] 0.7077[/C][C] 0.6462[/C][/ROW]
[ROW][C]154[/C][C] 0.4669[/C][C] 0.9338[/C][C] 0.5331[/C][/ROW]
[ROW][C]155[/C][C] 0.3836[/C][C] 0.7673[/C][C] 0.6164[/C][/ROW]
[ROW][C]156[/C][C] 0.3106[/C][C] 0.6211[/C][C] 0.6894[/C][/ROW]
[ROW][C]157[/C][C] 0.2493[/C][C] 0.4986[/C][C] 0.7507[/C][/ROW]
[ROW][C]158[/C][C] 0.2543[/C][C] 0.5086[/C][C] 0.7457[/C][/ROW]
[ROW][C]159[/C][C] 0.3555[/C][C] 0.7111[/C][C] 0.6445[/C][/ROW]
[ROW][C]160[/C][C] 0.2529[/C][C] 0.5058[/C][C] 0.7471[/C][/ROW]
[ROW][C]161[/C][C] 0.423[/C][C] 0.8461[/C][C] 0.577[/C][/ROW]
[ROW][C]162[/C][C] 0.28[/C][C] 0.56[/C][C] 0.72[/C][/ROW]
[/TABLE]
Source: https://freestatistics.org/blog/index.php?pk=309905&T=6

Globally Unique Identifier (entire table): ba.freestatistics.org/blog/index.php?pk=309905&T=6

As an alternative you can also use a QR Code:  

The GUIDs for individual cells are displayed in the table below:

Goldfeld-Quandt test for Heteroskedasticity
p-valuesAlternative Hypothesis
breakpoint indexgreater2-sidedless
10 0.07944 0.1589 0.9206
11 0.03876 0.07753 0.9612
12 0.01633 0.03267 0.9837
13 0.09818 0.1964 0.9018
14 0.05075 0.1015 0.9492
15 0.1929 0.3857 0.8071
16 0.1659 0.3317 0.8341
17 0.1154 0.2309 0.8846
18 0.14 0.2799 0.86
19 0.09567 0.1913 0.9043
20 0.06954 0.1391 0.9305
21 0.04747 0.09495 0.9525
22 0.03033 0.06065 0.9697
23 0.01936 0.03873 0.9806
24 0.0242 0.04841 0.9758
25 0.04992 0.09984 0.9501
26 0.03327 0.06654 0.9667
27 0.04218 0.08437 0.9578
28 0.02834 0.05667 0.9717
29 0.02131 0.04262 0.9787
30 0.02826 0.05651 0.9717
31 0.1403 0.2806 0.8597
32 0.1378 0.2756 0.8622
33 0.3879 0.7759 0.6121
34 0.347 0.694 0.653
35 0.4689 0.9379 0.5311
36 0.4387 0.8774 0.5613
37 0.3834 0.7669 0.6166
38 0.3457 0.6914 0.6543
39 0.4525 0.9051 0.5475
40 0.4551 0.9103 0.5449
41 0.4215 0.843 0.5785
42 0.4063 0.8125 0.5937
43 0.3651 0.7301 0.6349
44 0.3723 0.7445 0.6277
45 0.3234 0.6469 0.6766
46 0.2811 0.5622 0.7189
47 0.3582 0.7163 0.6418
48 0.3727 0.7455 0.6273
49 0.4838 0.9677 0.5162
50 0.5026 0.9949 0.4974
51 0.5552 0.8895 0.4448
52 0.5179 0.9641 0.4821
53 0.4728 0.9457 0.5272
54 0.4577 0.9154 0.5423
55 0.4381 0.8761 0.5619
56 0.3913 0.7827 0.6087
57 0.3521 0.7042 0.6479
58 0.4336 0.8673 0.5664
59 0.396 0.792 0.604
60 0.509 0.982 0.491
61 0.557 0.886 0.443
62 0.5791 0.8417 0.4209
63 0.5372 0.9256 0.4628
64 0.4961 0.9923 0.5039
65 0.4591 0.9183 0.5409
66 0.4635 0.927 0.5365
67 0.7917 0.4167 0.2083
68 0.8289 0.3423 0.1711
69 0.8825 0.2349 0.1175
70 0.873 0.254 0.127
71 0.8551 0.2898 0.1449
72 0.8444 0.3113 0.1556
73 0.8194 0.3613 0.1806
74 0.7948 0.4104 0.2052
75 0.862 0.2759 0.138
76 0.8727 0.2546 0.1273
77 0.8903 0.2194 0.1097
78 0.8885 0.223 0.1115
79 0.8763 0.2475 0.1237
80 0.8887 0.2225 0.1113
81 0.88 0.24 0.12
82 0.883 0.2341 0.117
83 0.9294 0.1411 0.07057
84 0.9183 0.1635 0.08173
85 0.9203 0.1593 0.07965
86 0.9206 0.1588 0.07938
87 0.9102 0.1796 0.08982
88 0.9302 0.1396 0.06981
89 0.9149 0.1702 0.0851
90 0.8987 0.2026 0.1013
91 0.9168 0.1663 0.08316
92 0.9013 0.1973 0.09867
93 0.8812 0.2376 0.1188
94 0.8623 0.2755 0.1377
95 0.8871 0.2257 0.1129
96 0.8738 0.2525 0.1262
97 0.8509 0.2983 0.1491
98 0.8508 0.2984 0.1492
99 0.8295 0.341 0.1705
100 0.7995 0.401 0.2005
101 0.7683 0.4635 0.2317
102 0.7326 0.5349 0.2674
103 0.7128 0.5745 0.2872
104 0.7089 0.5822 0.2911
105 0.6826 0.6348 0.3174
106 0.6909 0.6183 0.3091
107 0.6591 0.6819 0.3409
108 0.6923 0.6153 0.3077
109 0.6644 0.6712 0.3356
110 0.6338 0.7323 0.3662
111 0.6118 0.7763 0.3882
112 0.5877 0.8245 0.4123
113 0.5909 0.8181 0.4091
114 0.5984 0.8032 0.4016
115 0.6078 0.7843 0.3922
116 0.6212 0.7577 0.3788
117 0.5782 0.8437 0.4218
118 0.5395 0.921 0.4605
119 0.5911 0.8177 0.4089
120 0.5473 0.9054 0.4527
121 0.4974 0.9949 0.5026
122 0.5114 0.9772 0.4886
123 0.557 0.8861 0.443
124 0.5449 0.9102 0.4551
125 0.505 0.99 0.495
126 0.4692 0.9383 0.5308
127 0.4205 0.8411 0.5795
128 0.5017 0.9966 0.4983
129 0.6635 0.673 0.3365
130 0.6854 0.6293 0.3146
131 0.6393 0.7214 0.3607
132 0.6079 0.7842 0.3921
133 0.6008 0.7984 0.3992
134 0.546 0.9081 0.454
135 0.6539 0.6921 0.3461
136 0.6154 0.7693 0.3846
137 0.5626 0.8747 0.4374
138 0.5101 0.9798 0.4899
139 0.606 0.7879 0.394
140 0.6592 0.6817 0.3408
141 0.6001 0.7999 0.3999
142 0.6531 0.6938 0.3469
143 0.6039 0.7921 0.3961
144 0.5637 0.8726 0.4363
145 0.5279 0.9442 0.4721
146 0.4736 0.9471 0.5264
147 0.5018 0.9964 0.4982
148 0.5239 0.9522 0.4761
149 0.4536 0.9072 0.5464
150 0.3802 0.7604 0.6198
151 0.3153 0.6305 0.6847
152 0.2493 0.4985 0.7507
153 0.3538 0.7077 0.6462
154 0.4669 0.9338 0.5331
155 0.3836 0.7673 0.6164
156 0.3106 0.6211 0.6894
157 0.2493 0.4986 0.7507
158 0.2543 0.5086 0.7457
159 0.3555 0.7111 0.6445
160 0.2529 0.5058 0.7471
161 0.423 0.8461 0.577
162 0.28 0.56 0.72


Meta Analysis of Goldfeld-Quandt test for Heteroskedasticity
Description# significant tests% significant testsOK/NOK
1% type I error level0 0OK
5% type I error level40.0261438OK
10% type I error level120.0784314OK

\begin{tabular}{lllllllll}
\hline
Meta Analysis of Goldfeld-Quandt test for Heteroskedasticity \tabularnewline
Description & # significant tests & % significant tests & OK/NOK \tabularnewline
1% type I error level & 0 &  0 & OK \tabularnewline
5% type I error level & 4 & 0.0261438 & OK \tabularnewline
10% type I error level & 12 & 0.0784314 & OK \tabularnewline
\hline
\end{tabular}
%Source: https://freestatistics.org/blog/index.php?pk=309905&T=7

[TABLE]
[ROW][C]Meta Analysis of Goldfeld-Quandt test for Heteroskedasticity[/C][/ROW]
[ROW][C]Description[/C][C]# significant tests[/C][C]% significant tests[/C][C]OK/NOK[/C][/ROW]
[ROW][C]1% type I error level[/C][C]0[/C][C] 0[/C][C]OK[/C][/ROW]
[ROW][C]5% type I error level[/C][C]4[/C][C]0.0261438[/C][C]OK[/C][/ROW]
[ROW][C]10% type I error level[/C][C]12[/C][C]0.0784314[/C][C]OK[/C][/ROW]
[/TABLE]
Source: https://freestatistics.org/blog/index.php?pk=309905&T=7

Globally Unique Identifier (entire table): ba.freestatistics.org/blog/index.php?pk=309905&T=7

As an alternative you can also use a QR Code:  

The GUIDs for individual cells are displayed in the table below:

Meta Analysis of Goldfeld-Quandt test for Heteroskedasticity
Description# significant tests% significant testsOK/NOK
1% type I error level0 0OK
5% type I error level40.0261438OK
10% type I error level120.0784314OK


Ramsey RESET F-Test for powers (2 and 3) of fitted values
> reset_test_fitted
	RESET test
data:  mylm
RESET = 1.3015, df1 = 2, df2 = 163, p-value = 0.2749
Ramsey RESET F-Test for powers (2 and 3) of regressors
> reset_test_regressors
	RESET test
data:  mylm
RESET = 0.91244, df1 = 12, df2 = 153, p-value = 0.5361
Ramsey RESET F-Test for powers (2 and 3) of principal components
> reset_test_principal_components
	RESET test
data:  mylm
RESET = 0.31939, df1 = 2, df2 = 163, p-value = 0.727

\begin{tabular}{lllllllll}
\hline
Ramsey RESET F-Test for powers (2 and 3) of fitted values \tabularnewline
> reset_test_fitted
	RESET test
data:  mylm
RESET = 1.3015, df1 = 2, df2 = 163, p-value = 0.2749
\tabularnewline Ramsey RESET F-Test for powers (2 and 3) of regressors \tabularnewline
> reset_test_regressors
	RESET test
data:  mylm
RESET = 0.91244, df1 = 12, df2 = 153, p-value = 0.5361
\tabularnewline Ramsey RESET F-Test for powers (2 and 3) of principal components \tabularnewline
> reset_test_principal_components
	RESET test
data:  mylm
RESET = 0.31939, df1 = 2, df2 = 163, p-value = 0.727
\tabularnewline \hline \end{tabular} %Source: https://freestatistics.org/blog/index.php?pk=309905&T=8

[TABLE]
[ROW][C]Ramsey RESET F-Test for powers (2 and 3) of fitted values[/C][/ROW]
[ROW][C]
> reset_test_fitted
	RESET test
data:  mylm
RESET = 1.3015, df1 = 2, df2 = 163, p-value = 0.2749
[/C][/ROW] [ROW][C]Ramsey RESET F-Test for powers (2 and 3) of regressors[/C][/ROW] [ROW][C]
> reset_test_regressors
	RESET test
data:  mylm
RESET = 0.91244, df1 = 12, df2 = 153, p-value = 0.5361
[/C][/ROW] [ROW][C]Ramsey RESET F-Test for powers (2 and 3) of principal components[/C][/ROW] [ROW][C]
> reset_test_principal_components
	RESET test
data:  mylm
RESET = 0.31939, df1 = 2, df2 = 163, p-value = 0.727
[/C][/ROW] [/TABLE] Source: https://freestatistics.org/blog/index.php?pk=309905&T=8

Globally Unique Identifier (entire table): ba.freestatistics.org/blog/index.php?pk=309905&T=8

As an alternative you can also use a QR Code:  

The GUIDs for individual cells are displayed in the table below:

Ramsey RESET F-Test for powers (2 and 3) of fitted values
> reset_test_fitted
	RESET test
data:  mylm
RESET = 1.3015, df1 = 2, df2 = 163, p-value = 0.2749
Ramsey RESET F-Test for powers (2 and 3) of regressors
> reset_test_regressors
	RESET test
data:  mylm
RESET = 0.91244, df1 = 12, df2 = 153, p-value = 0.5361
Ramsey RESET F-Test for powers (2 and 3) of principal components
> reset_test_principal_components
	RESET test
data:  mylm
RESET = 0.31939, df1 = 2, df2 = 163, p-value = 0.727


Variance Inflation Factors (Multicollinearity)
> vif
     `(1-Bs)(1-B)tip`  `(1-Bs)(1-B)bm(t-1)`  `(1-Bs)(1-B)bm(t-2)` 
             1.382912              1.566668              1.582208 
 `(1-Bs)(1-B)bm(t-3)` `(1-Bs)(1-B)bm(t-1s)` `(1-Bs)(1-B)bm(t-2s)` 
             1.388466              1.325808              1.273557 

\begin{tabular}{lllllllll}
\hline
Variance Inflation Factors (Multicollinearity) \tabularnewline
> vif
     `(1-Bs)(1-B)tip`  `(1-Bs)(1-B)bm(t-1)`  `(1-Bs)(1-B)bm(t-2)` 
             1.382912              1.566668              1.582208 
 `(1-Bs)(1-B)bm(t-3)` `(1-Bs)(1-B)bm(t-1s)` `(1-Bs)(1-B)bm(t-2s)` 
             1.388466              1.325808              1.273557 
\tabularnewline \hline \end{tabular} %Source: https://freestatistics.org/blog/index.php?pk=309905&T=9

[TABLE]
[ROW][C]Variance Inflation Factors (Multicollinearity)[/C][/ROW]
[ROW][C]
> vif
     `(1-Bs)(1-B)tip`  `(1-Bs)(1-B)bm(t-1)`  `(1-Bs)(1-B)bm(t-2)` 
             1.382912              1.566668              1.582208 
 `(1-Bs)(1-B)bm(t-3)` `(1-Bs)(1-B)bm(t-1s)` `(1-Bs)(1-B)bm(t-2s)` 
             1.388466              1.325808              1.273557 
[/C][/ROW] [/TABLE] Source: https://freestatistics.org/blog/index.php?pk=309905&T=9

Globally Unique Identifier (entire table): ba.freestatistics.org/blog/index.php?pk=309905&T=9

As an alternative you can also use a QR Code:  

The GUIDs for individual cells are displayed in the table below:

Variance Inflation Factors (Multicollinearity)
> vif
     `(1-Bs)(1-B)tip`  `(1-Bs)(1-B)bm(t-1)`  `(1-Bs)(1-B)bm(t-2)` 
             1.382912              1.566668              1.582208 
 `(1-Bs)(1-B)bm(t-3)` `(1-Bs)(1-B)bm(t-1s)` `(1-Bs)(1-B)bm(t-2s)` 
             1.388466              1.325808              1.273557 


Parameters (Session):
par1 = 1 ; par2 = Do not include Seasonal Dummies ; par3 = First and Seasonal Differences (s) ; par4 = 3 ; par5 = 2 ; par6 = 12 ;
Parameters (R input):
par1 = 1 ; par2 = Do not include Seasonal Dummies ; par3 = First and Seasonal Differences (s) ; par4 = 3 ; par5 = 2 ; par6 = 12 ;
R code (references can be found in the software module):
library(lattice)
library(lmtest)
library(car)
library(MASS)
n25 <- 25 #minimum number of obs. for Goldfeld-Quandt test
mywarning <- ''
par6 <- as.numeric(par6)
if(is.na(par6)) {
par6 <- 12
mywarning = 'Warning: you did not specify the seasonality. The seasonal period was set to s = 12.'
}
par1 <- as.numeric(par1)
if(is.na(par1)) {
par1 <- 1
mywarning = 'Warning: you did not specify the column number of the endogenous series! The first column was selected by default.'
}
if (par4=='') par4 <- 0
par4 <- as.numeric(par4)
if (!is.numeric(par4)) par4 <- 0
if (par5=='') par5 <- 0
par5 <- as.numeric(par5)
if (!is.numeric(par5)) par5 <- 0
x <- na.omit(t(y))
k <- length(x[1,])
n <- length(x[,1])
x1 <- cbind(x[,par1], x[,1:k!=par1])
mycolnames <- c(colnames(x)[par1], colnames(x)[1:k!=par1])
colnames(x1) <- mycolnames #colnames(x)[par1]
x <- x1
if (par3 == 'First Differences'){
(n <- n -1)
x2 <- array(0, dim=c(n,k), dimnames=list(1:n, paste('(1-B)',colnames(x),sep='')))
for (i in 1:n) {
for (j in 1:k) {
x2[i,j] <- x[i+1,j] - x[i,j]
}
}
x <- x2
}
if (par3 == 'Seasonal Differences (s)'){
(n <- n - par6)
x2 <- array(0, dim=c(n,k), dimnames=list(1:n, paste('(1-Bs)',colnames(x),sep='')))
for (i in 1:n) {
for (j in 1:k) {
x2[i,j] <- x[i+par6,j] - x[i,j]
}
}
x <- x2
}
if (par3 == 'First and Seasonal Differences (s)'){
(n <- n -1)
x2 <- array(0, dim=c(n,k), dimnames=list(1:n, paste('(1-B)',colnames(x),sep='')))
for (i in 1:n) {
for (j in 1:k) {
x2[i,j] <- x[i+1,j] - x[i,j]
}
}
x <- x2
(n <- n - par6)
x2 <- array(0, dim=c(n,k), dimnames=list(1:n, paste('(1-Bs)',colnames(x),sep='')))
for (i in 1:n) {
for (j in 1:k) {
x2[i,j] <- x[i+par6,j] - x[i,j]
}
}
x <- x2
}
if(par4 > 0) {
x2 <- array(0, dim=c(n-par4,par4), dimnames=list(1:(n-par4), paste(colnames(x)[par1],'(t-',1:par4,')',sep='')))
for (i in 1:(n-par4)) {
for (j in 1:par4) {
x2[i,j] <- x[i+par4-j,par1]
}
}
x <- cbind(x[(par4+1):n,], x2)
n <- n - par4
}
if(par5 > 0) {
x2 <- array(0, dim=c(n-par5*par6,par5), dimnames=list(1:(n-par5*par6), paste(colnames(x)[par1],'(t-',1:par5,'s)',sep='')))
for (i in 1:(n-par5*par6)) {
for (j in 1:par5) {
x2[i,j] <- x[i+par5*par6-j*par6,par1]
}
}
x <- cbind(x[(par5*par6+1):n,], x2)
n <- n - par5*par6
}
if (par2 == 'Include Seasonal Dummies'){
x2 <- array(0, dim=c(n,par6-1), dimnames=list(1:n, paste('M', seq(1:(par6-1)), sep ='')))
for (i in 1:(par6-1)){
x2[seq(i,n,par6),i] <- 1
}
x <- cbind(x, x2)
}
if (par2 == 'Include Monthly Dummies'){
x2 <- array(0, dim=c(n,11), dimnames=list(1:n, paste('M', seq(1:11), sep ='')))
for (i in 1:11){
x2[seq(i,n,12),i] <- 1
}
x <- cbind(x, x2)
}
if (par2 == 'Include Quarterly Dummies'){
x2 <- array(0, dim=c(n,3), dimnames=list(1:n, paste('Q', seq(1:3), sep ='')))
for (i in 1:3){
x2[seq(i,n,4),i] <- 1
}
x <- cbind(x, x2)
}
(k <- length(x[n,]))
if (par3 == 'Linear Trend'){
x <- cbind(x, c(1:n))
colnames(x)[k+1] <- 't'
}
print(x)
(k <- length(x[n,]))
head(x)
df <- as.data.frame(x)
(mylm <- lm(df))
(mysum <- summary(mylm))
if (n > n25) {
kp3 <- k + 3
nmkm3 <- n - k - 3
gqarr <- array(NA, dim=c(nmkm3-kp3+1,3))
numgqtests <- 0
numsignificant1 <- 0
numsignificant5 <- 0
numsignificant10 <- 0
for (mypoint in kp3:nmkm3) {
j <- 0
numgqtests <- numgqtests + 1
for (myalt in c('greater', 'two.sided', 'less')) {
j <- j + 1
gqarr[mypoint-kp3+1,j] <- gqtest(mylm, point=mypoint, alternative=myalt)$p.value
}
if (gqarr[mypoint-kp3+1,2] < 0.01) numsignificant1 <- numsignificant1 + 1
if (gqarr[mypoint-kp3+1,2] < 0.05) numsignificant5 <- numsignificant5 + 1
if (gqarr[mypoint-kp3+1,2] < 0.10) numsignificant10 <- numsignificant10 + 1
}
gqarr
}
bitmap(file='test0.png')
plot(x[,1], type='l', main='Actuals and Interpolation', ylab='value of Actuals and Interpolation (dots)', xlab='time or index')
points(x[,1]-mysum$resid)
grid()
dev.off()
bitmap(file='test1.png')
plot(mysum$resid, type='b', pch=19, main='Residuals', ylab='value of Residuals', xlab='time or index')
grid()
dev.off()
bitmap(file='test2.png')
sresid <- studres(mylm)
hist(sresid, freq=FALSE, main='Distribution of Studentized Residuals')
xfit<-seq(min(sresid),max(sresid),length=40)
yfit<-dnorm(xfit)
lines(xfit, yfit)
grid()
dev.off()
bitmap(file='test3.png')
densityplot(~mysum$resid,col='black',main='Residual Density Plot', xlab='values of Residuals')
dev.off()
bitmap(file='test4.png')
qqPlot(mylm, main='QQ Plot')
grid()
dev.off()
(myerror <- as.ts(mysum$resid))
bitmap(file='test5.png')
dum <- cbind(lag(myerror,k=1),myerror)
dum
dum1 <- dum[2:length(myerror),]
dum1
z <- as.data.frame(dum1)
print(z)
plot(z,main=paste('Residual Lag plot, lowess, and regression line'), ylab='values of Residuals', xlab='lagged values of Residuals')
lines(lowess(z))
abline(lm(z))
grid()
dev.off()
bitmap(file='test6.png')
acf(mysum$resid, lag.max=length(mysum$resid)/2, main='Residual Autocorrelation Function')
grid()
dev.off()
bitmap(file='test7.png')
pacf(mysum$resid, lag.max=length(mysum$resid)/2, main='Residual Partial Autocorrelation Function')
grid()
dev.off()
bitmap(file='test8.png')
opar <- par(mfrow = c(2,2), oma = c(0, 0, 1.1, 0))
plot(mylm, las = 1, sub='Residual Diagnostics')
par(opar)
dev.off()
if (n > n25) {
bitmap(file='test9.png')
plot(kp3:nmkm3,gqarr[,2], main='Goldfeld-Quandt test',ylab='2-sided p-value',xlab='breakpoint')
grid()
dev.off()
}
load(file='createtable')
a<-table.start()
a<-table.row.start(a)
a<-table.element(a, 'Multiple Linear Regression - Estimated Regression Equation', 1, TRUE)
a<-table.row.end(a)
myeq <- colnames(x)[1]
myeq <- paste(myeq, '[t] = ', sep='')
for (i in 1:k){
if (mysum$coefficients[i,1] > 0) myeq <- paste(myeq, '+', '')
myeq <- paste(myeq, signif(mysum$coefficients[i,1],6), sep=' ')
if (rownames(mysum$coefficients)[i] != '(Intercept)') {
myeq <- paste(myeq, rownames(mysum$coefficients)[i], sep='')
if (rownames(mysum$coefficients)[i] != 't') myeq <- paste(myeq, '[t]', sep='')
}
}
myeq <- paste(myeq, ' + e[t]')
a<-table.row.start(a)
a<-table.element(a, myeq)
a<-table.row.end(a)
a<-table.row.start(a)
a<-table.element(a, mywarning)
a<-table.row.end(a)
a<-table.end(a)
table.save(a,file='mytable1.tab')
a<-table.start()
a<-table.row.start(a)
a<-table.element(a,'Multiple Linear Regression - Ordinary Least Squares', 6, TRUE)
a<-table.row.end(a)
a<-table.row.start(a)
a<-table.element(a,'Variable',header=TRUE)
a<-table.element(a,'Parameter',header=TRUE)
a<-table.element(a,'S.D.',header=TRUE)
a<-table.element(a,'T-STAT
H0: parameter = 0',header=TRUE)
a<-table.element(a,'2-tail p-value',header=TRUE)
a<-table.element(a,'1-tail p-value',header=TRUE)
a<-table.row.end(a)
for (i in 1:k){
a<-table.row.start(a)
a<-table.element(a,rownames(mysum$coefficients)[i],header=TRUE)
a<-table.element(a,formatC(signif(mysum$coefficients[i,1],5),format='g',flag='+'))
a<-table.element(a,formatC(signif(mysum$coefficients[i,2],5),format='g',flag=' '))
a<-table.element(a,formatC(signif(mysum$coefficients[i,3],4),format='e',flag='+'))
a<-table.element(a,formatC(signif(mysum$coefficients[i,4],4),format='g',flag=' '))
a<-table.element(a,formatC(signif(mysum$coefficients[i,4]/2,4),format='g',flag=' '))
a<-table.row.end(a)
}
a<-table.end(a)
table.save(a,file='mytable2.tab')
a<-table.start()
a<-table.row.start(a)
a<-table.element(a, 'Multiple Linear Regression - Regression Statistics', 2, TRUE)
a<-table.row.end(a)
a<-table.row.start(a)
a<-table.element(a, 'Multiple R',1,TRUE)
a<-table.element(a,formatC(signif(sqrt(mysum$r.squared),6),format='g',flag=' '))
a<-table.row.end(a)
a<-table.row.start(a)
a<-table.element(a, 'R-squared',1,TRUE)
a<-table.element(a,formatC(signif(mysum$r.squared,6),format='g',flag=' '))
a<-table.row.end(a)
a<-table.row.start(a)
a<-table.element(a, 'Adjusted R-squared',1,TRUE)
a<-table.element(a,formatC(signif(mysum$adj.r.squared,6),format='g',flag=' '))
a<-table.row.end(a)
a<-table.row.start(a)
a<-table.element(a, 'F-TEST (value)',1,TRUE)
a<-table.element(a,formatC(signif(mysum$fstatistic[1],6),format='g',flag=' '))
a<-table.row.end(a)
a<-table.row.start(a)
a<-table.element(a, 'F-TEST (DF numerator)',1,TRUE)
a<-table.element(a, signif(mysum$fstatistic[2],6))
a<-table.row.end(a)
a<-table.row.start(a)
a<-table.element(a, 'F-TEST (DF denominator)',1,TRUE)
a<-table.element(a, signif(mysum$fstatistic[3],6))
a<-table.row.end(a)
a<-table.row.start(a)
a<-table.element(a, 'p-value',1,TRUE)
a<-table.element(a,formatC(signif(1-pf(mysum$fstatistic[1],mysum$fstatistic[2],mysum$fstatistic[3]),6),format='g',flag=' '))
a<-table.row.end(a)
a<-table.row.start(a)
a<-table.element(a, 'Multiple Linear Regression - Residual Statistics', 2, TRUE)
a<-table.row.end(a)
a<-table.row.start(a)
a<-table.element(a, 'Residual Standard Deviation',1,TRUE)
a<-table.element(a,formatC(signif(mysum$sigma,6),format='g',flag=' '))
a<-table.row.end(a)
a<-table.row.start(a)
a<-table.element(a, 'Sum Squared Residuals',1,TRUE)
a<-table.element(a,formatC(signif(sum(myerror*myerror),6),format='g',flag=' '))
a<-table.row.end(a)
a<-table.end(a)
table.save(a,file='mytable3.tab')
myr <- as.numeric(mysum$resid)
myr
a <-table.start()
a <- table.row.start(a)
a <- table.element(a,'Menu of Residual Diagnostics',2,TRUE)
a <- table.row.end(a)
a <- table.row.start(a)
a <- table.element(a,'Description',1,TRUE)
a <- table.element(a,'Link',1,TRUE)
a <- table.row.end(a)
a <- table.row.start(a)
a <-table.element(a,'Histogram',1,header=TRUE)
a <- table.element(a,hyperlink( paste('https://supernova.wessa.net/rwasp_histogram.wasp?convertgetintopost=1&data=',paste(as.character(mysum$resid),sep='',collapse=' '),sep='') ,'Compute','Click here to examine the Residuals.'),1)
a <- table.row.end(a)
a <- table.row.start(a)
a <-table.element(a,'Central Tendency',1,header=TRUE)
a <- table.element(a,hyperlink( paste('https://supernova.wessa.net/rwasp_centraltendency.wasp?convertgetintopost=1&data=',paste(as.character(mysum$resid),sep='',collapse=' '),sep='') ,'Compute','Click here to examine the Residuals.'),1)
a <- table.row.end(a)
a <- table.row.start(a)
a <-table.element(a,'QQ Plot',1,header=TRUE)
a <- table.element(a,hyperlink( paste('https://supernova.wessa.net/rwasp_fitdistrnorm.wasp?convertgetintopost=1&data=',paste(as.character(mysum$resid),sep='',collapse=' '),sep='') ,'Compute','Click here to examine the Residuals.'),1)
a <- table.row.end(a)
a <- table.row.start(a)
a <-table.element(a,'Kernel Density Plot',1,header=TRUE)
a <- table.element(a,hyperlink( paste('https://supernova.wessa.net/rwasp_density.wasp?convertgetintopost=1&data=',paste(as.character(mysum$resid),sep='',collapse=' '),sep='') ,'Compute','Click here to examine the Residuals.'),1)
a <- table.row.end(a)
a <- table.row.start(a)
a <-table.element(a,'Skewness/Kurtosis Test',1,header=TRUE)
a <- table.element(a,hyperlink( paste('https://supernova.wessa.net/rwasp_skewness_kurtosis.wasp?convertgetintopost=1&data=',paste(as.character(mysum$resid),sep='',collapse=' '),sep='') ,'Compute','Click here to examine the Residuals.'),1)
a <- table.row.end(a)
a <- table.row.start(a)
a <-table.element(a,'Skewness-Kurtosis Plot',1,header=TRUE)
a <- table.element(a,hyperlink( paste('https://supernova.wessa.net/rwasp_skewness_kurtosis_plot.wasp?convertgetintopost=1&data=',paste(as.character(mysum$resid),sep='',collapse=' '),sep='') ,'Compute','Click here to examine the Residuals.'),1)
a <- table.row.end(a)
a <- table.row.start(a)
a <-table.element(a,'Harrell-Davis Plot',1,header=TRUE)
a <- table.element(a,hyperlink( paste('https://supernova.wessa.net/rwasp_harrell_davis.wasp?convertgetintopost=1&data=',paste(as.character(mysum$resid),sep='',collapse=' '),sep='') ,'Compute','Click here to examine the Residuals.'),1)
a <- table.row.end(a)
a <- table.row.start(a)
a <-table.element(a,'Bootstrap Plot -- Central Tendency',1,header=TRUE)
a <- table.element(a,hyperlink( paste('https://supernova.wessa.net/rwasp_bootstrapplot1.wasp?convertgetintopost=1&data=',paste(as.character(mysum$resid),sep='',collapse=' '),sep='') ,'Compute','Click here to examine the Residuals.'),1)
a <- table.row.end(a)
a <- table.row.start(a)
a <-table.element(a,'Blocked Bootstrap Plot -- Central Tendency',1,header=TRUE)
a <- table.element(a,hyperlink( paste('https://supernova.wessa.net/rwasp_bootstrapplot.wasp?convertgetintopost=1&data=',paste(as.character(mysum$resid),sep='',collapse=' '),sep='') ,'Compute','Click here to examine the Residuals.'),1)
a <- table.row.end(a)
a <- table.row.start(a)
a <-table.element(a,'(Partial) Autocorrelation Plot',1,header=TRUE)
a <- table.element(a,hyperlink( paste('https://supernova.wessa.net/rwasp_autocorrelation.wasp?convertgetintopost=1&data=',paste(as.character(mysum$resid),sep='',collapse=' '),sep='') ,'Compute','Click here to examine the Residuals.'),1)
a <- table.row.end(a)
a <- table.row.start(a)
a <-table.element(a,'Spectral Analysis',1,header=TRUE)
a <- table.element(a,hyperlink( paste('https://supernova.wessa.net/rwasp_spectrum.wasp?convertgetintopost=1&data=',paste(as.character(mysum$resid),sep='',collapse=' '),sep='') ,'Compute','Click here to examine the Residuals.'),1)
a <- table.row.end(a)
a <- table.row.start(a)
a <-table.element(a,'Tukey lambda PPCC Plot',1,header=TRUE)
a <- table.element(a,hyperlink( paste('https://supernova.wessa.net/rwasp_tukeylambda.wasp?convertgetintopost=1&data=',paste(as.character(mysum$resid),sep='',collapse=' '),sep='') ,'Compute','Click here to examine the Residuals.'),1)
a <- table.row.end(a)
a <- table.row.start(a)
a <-table.element(a,'Box-Cox Normality Plot',1,header=TRUE)
a <- table.element(a,hyperlink( paste('https://supernova.wessa.net/rwasp_boxcoxnorm.wasp?convertgetintopost=1&data=',paste(as.character(mysum$resid),sep='',collapse=' '),sep='') ,'Compute','Click here to examine the Residuals.'),1)
a <- table.row.end(a)
a <- table.row.start(a)
a <- table.element(a,'Summary Statistics',1,header=TRUE)
a <- table.element(a,hyperlink( paste('https://supernova.wessa.net/rwasp_summary1.wasp?convertgetintopost=1&data=',paste(as.character(mysum$resid),sep='',collapse=' '),sep='') ,'Compute','Click here to examine the Residuals.'),1)
a <- table.row.end(a)
a<-table.end(a)
table.save(a,file='mytable7.tab')
if(n < 200) {
a<-table.start()
a<-table.row.start(a)
a<-table.element(a, 'Multiple Linear Regression - Actuals, Interpolation, and Residuals', 4, TRUE)
a<-table.row.end(a)
a<-table.row.start(a)
a<-table.element(a, 'Time or Index', 1, TRUE)
a<-table.element(a, 'Actuals', 1, TRUE)
a<-table.element(a, 'Interpolation
Forecast', 1, TRUE)
a<-table.element(a, 'Residuals
Prediction Error', 1, TRUE)
a<-table.row.end(a)
for (i in 1:n) {
a<-table.row.start(a)
a<-table.element(a,i, 1, TRUE)
a<-table.element(a,formatC(signif(x[i],6),format='g',flag=' '))
a<-table.element(a,formatC(signif(x[i]-mysum$resid[i],6),format='g',flag=' '))
a<-table.element(a,formatC(signif(mysum$resid[i],6),format='g',flag=' '))
a<-table.row.end(a)
}
a<-table.end(a)
table.save(a,file='mytable4.tab')
if (n > n25) {
a<-table.start()
a<-table.row.start(a)
a<-table.element(a,'Goldfeld-Quandt test for Heteroskedasticity',4,TRUE)
a<-table.row.end(a)
a<-table.row.start(a)
a<-table.element(a,'p-values',header=TRUE)
a<-table.element(a,'Alternative Hypothesis',3,header=TRUE)
a<-table.row.end(a)
a<-table.row.start(a)
a<-table.element(a,'breakpoint index',header=TRUE)
a<-table.element(a,'greater',header=TRUE)
a<-table.element(a,'2-sided',header=TRUE)
a<-table.element(a,'less',header=TRUE)
a<-table.row.end(a)
for (mypoint in kp3:nmkm3) {
a<-table.row.start(a)
a<-table.element(a,mypoint,header=TRUE)
a<-table.element(a,formatC(signif(gqarr[mypoint-kp3+1,1],6),format='g',flag=' '))
a<-table.element(a,formatC(signif(gqarr[mypoint-kp3+1,2],6),format='g',flag=' '))
a<-table.element(a,formatC(signif(gqarr[mypoint-kp3+1,3],6),format='g',flag=' '))
a<-table.row.end(a)
}
a<-table.end(a)
table.save(a,file='mytable5.tab')
a<-table.start()
a<-table.row.start(a)
a<-table.element(a,'Meta Analysis of Goldfeld-Quandt test for Heteroskedasticity',4,TRUE)
a<-table.row.end(a)
a<-table.row.start(a)
a<-table.element(a,'Description',header=TRUE)
a<-table.element(a,'# significant tests',header=TRUE)
a<-table.element(a,'% significant tests',header=TRUE)
a<-table.element(a,'OK/NOK',header=TRUE)
a<-table.row.end(a)
a<-table.row.start(a)
a<-table.element(a,'1% type I error level',header=TRUE)
a<-table.element(a,signif(numsignificant1,6))
a<-table.element(a,formatC(signif(numsignificant1/numgqtests,6),format='g',flag=' '))
if (numsignificant1/numgqtests < 0.01) dum <- 'OK' else dum <- 'NOK'
a<-table.element(a,dum)
a<-table.row.end(a)
a<-table.row.start(a)
a<-table.element(a,'5% type I error level',header=TRUE)
a<-table.element(a,signif(numsignificant5,6))
a<-table.element(a,signif(numsignificant5/numgqtests,6))
if (numsignificant5/numgqtests < 0.05) dum <- 'OK' else dum <- 'NOK'
a<-table.element(a,dum)
a<-table.row.end(a)
a<-table.row.start(a)
a<-table.element(a,'10% type I error level',header=TRUE)
a<-table.element(a,signif(numsignificant10,6))
a<-table.element(a,signif(numsignificant10/numgqtests,6))
if (numsignificant10/numgqtests < 0.1) dum <- 'OK' else dum <- 'NOK'
a<-table.element(a,dum)
a<-table.row.end(a)
a<-table.end(a)
table.save(a,file='mytable6.tab')
}
}
a<-table.start()
a<-table.row.start(a)
a<-table.element(a,'Ramsey RESET F-Test for powers (2 and 3) of fitted values',1,TRUE)
a<-table.row.end(a)
a<-table.row.start(a)
reset_test_fitted <- resettest(mylm,power=2:3,type='fitted')
a<-table.element(a,paste('
',RC.texteval('reset_test_fitted'),'
',sep=''))
a<-table.row.end(a)
a<-table.row.start(a)
a<-table.element(a,'Ramsey RESET F-Test for powers (2 and 3) of regressors',1,TRUE)
a<-table.row.end(a)
a<-table.row.start(a)
reset_test_regressors <- resettest(mylm,power=2:3,type='regressor')
a<-table.element(a,paste('
',RC.texteval('reset_test_regressors'),'
',sep=''))
a<-table.row.end(a)
a<-table.row.start(a)
a<-table.element(a,'Ramsey RESET F-Test for powers (2 and 3) of principal components',1,TRUE)
a<-table.row.end(a)
a<-table.row.start(a)
reset_test_principal_components <- resettest(mylm,power=2:3,type='princomp')
a<-table.element(a,paste('
',RC.texteval('reset_test_principal_components'),'
',sep=''))
a<-table.row.end(a)
a<-table.end(a)
table.save(a,file='mytable8.tab')
a<-table.start()
a<-table.row.start(a)
a<-table.element(a,'Variance Inflation Factors (Multicollinearity)',1,TRUE)
a<-table.row.end(a)
a<-table.row.start(a)
vif <- vif(mylm)
a<-table.element(a,paste('
',RC.texteval('vif'),'
',sep=''))
a<-table.row.end(a)
a<-table.end(a)
table.save(a,file='mytable9.tab')