Free Statistics

of Irreproducible Research!

Author's title

Author*The author of this computation has been verified*
R Software Modulerwasp_autocorrelation.wasp
Title produced by software(Partial) Autocorrelation Function
Date of computationSat, 16 Dec 2017 13:07:23 +0100
Cite this page as followsStatistical Computations at FreeStatistics.org, Office for Research Development and Education, URL https://freestatistics.org/blog/index.php?v=date/2017/Dec/16/t1513426459yuftrkinrwa995f.htm/, Retrieved Wed, 15 May 2024 10:34:49 +0000
Statistical Computations at FreeStatistics.org, Office for Research Development and Education, URL https://freestatistics.org/blog/index.php?pk=309862, Retrieved Wed, 15 May 2024 10:34:49 +0000
QR Codes:

Original text written by user:
IsPrivate?No (this computation is public)
User-defined keywords
Estimated Impact102
Family? (F = Feedback message, R = changed R code, M = changed R Module, P = changed Parameters, D = changed Data)
-       [(Partial) Autocorrelation Function] [] [2017-12-16 12:07:23] [6b1874e4714eefd7b92809f59303eb6f] [Current]
Feedback Forum

Post a new message
Dataseries X:
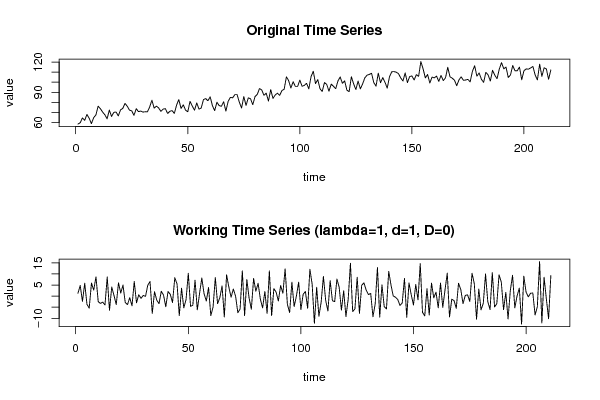
58.5
59.8
64.6
62.2
68
64.3
58.9
64.8
67.5
76.2
73.7
70.4
67.7
63.7
72.4
66
70.1
70.4
66.6
72.6
74
79
76.1
72.3
71.6
67.2
73.8
70.8
71.4
70.4
70.7
70.6
75.5
82.1
74.3
76.3
74.5
71.1
73.3
73.8
69
71.1
71.9
69
77.3
82.8
74
77.6
72.3
70.7
81
76.4
72.3
79.5
73.3
74.5
82.7
83.8
81.6
85.5
76.7
71.8
80.2
76.8
76.1
80.7
71.3
80.9
85
84.5
87.7
87.7
80.2
74.4
85.8
77
84.5
83.6
77.7
85.7
87.9
93.7
92.3
87
89.1
81.3
92.7
83.9
87.3
89.1
86.9
91.7
93
105.3
101.6
94.2
100.5
95.8
95.8
102.1
96
96.8
98.9
93.4
105.5
110.9
98.6
102.6
93.5
90.8
99.7
97.8
91.1
98.1
96
93.5
101.2
105.2
98.9
101.3
92.1
90.6
105.4
98.4
92.7
101.2
93.4
98.3
104.3
107
107.7
108.9
99.6
96.1
109
99.5
104.6
99.9
94.1
105.3
110.4
110.5
110
108.5
104.3
101.2
109.2
99.6
105.6
106.2
102.2
107.5
105.8
120.5
113.2
104.3
107.7
99.2
105.1
104.3
106.1
100.8
106.7
101.6
104.4
114.8
105.4
104
102
96.5
102.3
105.3
101.9
102.2
102.8
100.4
110.7
116.4
106
109.2
103
99.8
109.8
107.3
101.2
111.8
106.9
103.5
113.1
119.4
113.3
115
104.7
107.2
116.6
111.3
111.4
115
102.4
111.4
113.2
112.9
114.2
115.6
107.1
102.3
117.9
105.8
114.3
113.1
102.9
112.2


Summary of computational transaction
Raw Input view raw input (R code)
Raw Outputview raw output of R engine
Computing time1 seconds
R ServerBig Analytics Cloud Computing Center

\begin{tabular}{lllllllll}
\hline
Summary of computational transaction \tabularnewline
Raw Input view raw input (R code)  \tabularnewline
Raw Outputview raw output of R engine  \tabularnewline
Computing time1 seconds \tabularnewline
R ServerBig Analytics Cloud Computing Center \tabularnewline
\hline
\end{tabular}
%Source: https://freestatistics.org/blog/index.php?pk=309862&T=0

[TABLE]
[ROW]
Summary of computational transaction[/C][/ROW] [ROW]Raw Input[/C] view raw input (R code) [/C][/ROW] [ROW]Raw Output[/C]view raw output of R engine [/C][/ROW] [ROW]Computing time[/C]1 seconds[/C][/ROW] [ROW]R Server[/C]Big Analytics Cloud Computing Center[/C][/ROW] [/TABLE] Source: https://freestatistics.org/blog/index.php?pk=309862&T=0

Globally Unique Identifier (entire table): ba.freestatistics.org/blog/index.php?pk=309862&T=0

As an alternative you can also use a QR Code:  

The GUIDs for individual cells are displayed in the table below:

Summary of computational transaction
Raw Input view raw input (R code)
Raw Outputview raw output of R engine
Computing time1 seconds
R ServerBig Analytics Cloud Computing Center


Autocorrelation Function
Time lag kACF(k)T-STATP-value
1-0.398613-5.79020
2-0.13052-1.89590.029669
30.2777744.03493.8e-05
4-0.444802-6.46110
50.1135661.64960.050253
60.2700343.92255.9e-05
7-0.131553-1.91090.028686
8-0.176825-2.56850.005452
90.2060072.99240.001549
10-0.289796-4.20951.9e-05
11-0.028324-0.41140.340586
120.590168.57260
13-0.336337-4.88561e-06
140.1150421.67110.048093
150.0480560.6980.242958
16-0.436309-6.33780
170.2700493.92275.9e-05
180.1260251.83060.034284
19-0.149772-2.17560.01535
200.0168010.2440.403717
21-0.017497-0.25420.399809
22-0.254739-3.70030.000137
230.2162493.14120.000962
240.2238723.25190.000667
25-0.146896-2.13380.017007
260.174652.53690.005953
27-0.165953-2.41060.008392
28-0.209807-3.04760.001301
290.2373253.44730.000342
30-0.08183-1.18870.117957
310.0850771.23580.108951
32-0.027749-0.40310.343647
33-0.178912-2.59890.005007
340.0003990.00580.497688
350.0693441.00730.157478
360.1281351.86130.032049
370.1279281.85830.032262
38-0.078733-1.14370.127031
39-0.137991-2.00440.023151
40-0.020242-0.2940.384513
410.0476870.69270.244634
42-0.056705-0.82370.205523
430.2373913.44830.00034
44-0.220511-3.20310.000785
45-0.124998-1.81570.035418
460.1749932.54190.005871
47-0.190686-2.76990.003054
480.2859434.15362.4e-05

\begin{tabular}{lllllllll}
\hline
Autocorrelation Function \tabularnewline
Time lag k & ACF(k) & T-STAT & P-value \tabularnewline
1 & -0.398613 & -5.7902 & 0 \tabularnewline
2 & -0.13052 & -1.8959 & 0.029669 \tabularnewline
3 & 0.277774 & 4.0349 & 3.8e-05 \tabularnewline
4 & -0.444802 & -6.4611 & 0 \tabularnewline
5 & 0.113566 & 1.6496 & 0.050253 \tabularnewline
6 & 0.270034 & 3.9225 & 5.9e-05 \tabularnewline
7 & -0.131553 & -1.9109 & 0.028686 \tabularnewline
8 & -0.176825 & -2.5685 & 0.005452 \tabularnewline
9 & 0.206007 & 2.9924 & 0.001549 \tabularnewline
10 & -0.289796 & -4.2095 & 1.9e-05 \tabularnewline
11 & -0.028324 & -0.4114 & 0.340586 \tabularnewline
12 & 0.59016 & 8.5726 & 0 \tabularnewline
13 & -0.336337 & -4.8856 & 1e-06 \tabularnewline
14 & 0.115042 & 1.6711 & 0.048093 \tabularnewline
15 & 0.048056 & 0.698 & 0.242958 \tabularnewline
16 & -0.436309 & -6.3378 & 0 \tabularnewline
17 & 0.270049 & 3.9227 & 5.9e-05 \tabularnewline
18 & 0.126025 & 1.8306 & 0.034284 \tabularnewline
19 & -0.149772 & -2.1756 & 0.01535 \tabularnewline
20 & 0.016801 & 0.244 & 0.403717 \tabularnewline
21 & -0.017497 & -0.2542 & 0.399809 \tabularnewline
22 & -0.254739 & -3.7003 & 0.000137 \tabularnewline
23 & 0.216249 & 3.1412 & 0.000962 \tabularnewline
24 & 0.223872 & 3.2519 & 0.000667 \tabularnewline
25 & -0.146896 & -2.1338 & 0.017007 \tabularnewline
26 & 0.17465 & 2.5369 & 0.005953 \tabularnewline
27 & -0.165953 & -2.4106 & 0.008392 \tabularnewline
28 & -0.209807 & -3.0476 & 0.001301 \tabularnewline
29 & 0.237325 & 3.4473 & 0.000342 \tabularnewline
30 & -0.08183 & -1.1887 & 0.117957 \tabularnewline
31 & 0.085077 & 1.2358 & 0.108951 \tabularnewline
32 & -0.027749 & -0.4031 & 0.343647 \tabularnewline
33 & -0.178912 & -2.5989 & 0.005007 \tabularnewline
34 & 0.000399 & 0.0058 & 0.497688 \tabularnewline
35 & 0.069344 & 1.0073 & 0.157478 \tabularnewline
36 & 0.128135 & 1.8613 & 0.032049 \tabularnewline
37 & 0.127928 & 1.8583 & 0.032262 \tabularnewline
38 & -0.078733 & -1.1437 & 0.127031 \tabularnewline
39 & -0.137991 & -2.0044 & 0.023151 \tabularnewline
40 & -0.020242 & -0.294 & 0.384513 \tabularnewline
41 & 0.047687 & 0.6927 & 0.244634 \tabularnewline
42 & -0.056705 & -0.8237 & 0.205523 \tabularnewline
43 & 0.237391 & 3.4483 & 0.00034 \tabularnewline
44 & -0.220511 & -3.2031 & 0.000785 \tabularnewline
45 & -0.124998 & -1.8157 & 0.035418 \tabularnewline
46 & 0.174993 & 2.5419 & 0.005871 \tabularnewline
47 & -0.190686 & -2.7699 & 0.003054 \tabularnewline
48 & 0.285943 & 4.1536 & 2.4e-05 \tabularnewline
\hline
\end{tabular}
%Source: https://freestatistics.org/blog/index.php?pk=309862&T=1

[TABLE]
[ROW][C]Autocorrelation Function[/C][/ROW]
[ROW][C]Time lag k[/C][C]ACF(k)[/C][C]T-STAT[/C][C]P-value[/C][/ROW]
[ROW][C]1[/C][C]-0.398613[/C][C]-5.7902[/C][C]0[/C][/ROW]
[ROW][C]2[/C][C]-0.13052[/C][C]-1.8959[/C][C]0.029669[/C][/ROW]
[ROW][C]3[/C][C]0.277774[/C][C]4.0349[/C][C]3.8e-05[/C][/ROW]
[ROW][C]4[/C][C]-0.444802[/C][C]-6.4611[/C][C]0[/C][/ROW]
[ROW][C]5[/C][C]0.113566[/C][C]1.6496[/C][C]0.050253[/C][/ROW]
[ROW][C]6[/C][C]0.270034[/C][C]3.9225[/C][C]5.9e-05[/C][/ROW]
[ROW][C]7[/C][C]-0.131553[/C][C]-1.9109[/C][C]0.028686[/C][/ROW]
[ROW][C]8[/C][C]-0.176825[/C][C]-2.5685[/C][C]0.005452[/C][/ROW]
[ROW][C]9[/C][C]0.206007[/C][C]2.9924[/C][C]0.001549[/C][/ROW]
[ROW][C]10[/C][C]-0.289796[/C][C]-4.2095[/C][C]1.9e-05[/C][/ROW]
[ROW][C]11[/C][C]-0.028324[/C][C]-0.4114[/C][C]0.340586[/C][/ROW]
[ROW][C]12[/C][C]0.59016[/C][C]8.5726[/C][C]0[/C][/ROW]
[ROW][C]13[/C][C]-0.336337[/C][C]-4.8856[/C][C]1e-06[/C][/ROW]
[ROW][C]14[/C][C]0.115042[/C][C]1.6711[/C][C]0.048093[/C][/ROW]
[ROW][C]15[/C][C]0.048056[/C][C]0.698[/C][C]0.242958[/C][/ROW]
[ROW][C]16[/C][C]-0.436309[/C][C]-6.3378[/C][C]0[/C][/ROW]
[ROW][C]17[/C][C]0.270049[/C][C]3.9227[/C][C]5.9e-05[/C][/ROW]
[ROW][C]18[/C][C]0.126025[/C][C]1.8306[/C][C]0.034284[/C][/ROW]
[ROW][C]19[/C][C]-0.149772[/C][C]-2.1756[/C][C]0.01535[/C][/ROW]
[ROW][C]20[/C][C]0.016801[/C][C]0.244[/C][C]0.403717[/C][/ROW]
[ROW][C]21[/C][C]-0.017497[/C][C]-0.2542[/C][C]0.399809[/C][/ROW]
[ROW][C]22[/C][C]-0.254739[/C][C]-3.7003[/C][C]0.000137[/C][/ROW]
[ROW][C]23[/C][C]0.216249[/C][C]3.1412[/C][C]0.000962[/C][/ROW]
[ROW][C]24[/C][C]0.223872[/C][C]3.2519[/C][C]0.000667[/C][/ROW]
[ROW][C]25[/C][C]-0.146896[/C][C]-2.1338[/C][C]0.017007[/C][/ROW]
[ROW][C]26[/C][C]0.17465[/C][C]2.5369[/C][C]0.005953[/C][/ROW]
[ROW][C]27[/C][C]-0.165953[/C][C]-2.4106[/C][C]0.008392[/C][/ROW]
[ROW][C]28[/C][C]-0.209807[/C][C]-3.0476[/C][C]0.001301[/C][/ROW]
[ROW][C]29[/C][C]0.237325[/C][C]3.4473[/C][C]0.000342[/C][/ROW]
[ROW][C]30[/C][C]-0.08183[/C][C]-1.1887[/C][C]0.117957[/C][/ROW]
[ROW][C]31[/C][C]0.085077[/C][C]1.2358[/C][C]0.108951[/C][/ROW]
[ROW][C]32[/C][C]-0.027749[/C][C]-0.4031[/C][C]0.343647[/C][/ROW]
[ROW][C]33[/C][C]-0.178912[/C][C]-2.5989[/C][C]0.005007[/C][/ROW]
[ROW][C]34[/C][C]0.000399[/C][C]0.0058[/C][C]0.497688[/C][/ROW]
[ROW][C]35[/C][C]0.069344[/C][C]1.0073[/C][C]0.157478[/C][/ROW]
[ROW][C]36[/C][C]0.128135[/C][C]1.8613[/C][C]0.032049[/C][/ROW]
[ROW][C]37[/C][C]0.127928[/C][C]1.8583[/C][C]0.032262[/C][/ROW]
[ROW][C]38[/C][C]-0.078733[/C][C]-1.1437[/C][C]0.127031[/C][/ROW]
[ROW][C]39[/C][C]-0.137991[/C][C]-2.0044[/C][C]0.023151[/C][/ROW]
[ROW][C]40[/C][C]-0.020242[/C][C]-0.294[/C][C]0.384513[/C][/ROW]
[ROW][C]41[/C][C]0.047687[/C][C]0.6927[/C][C]0.244634[/C][/ROW]
[ROW][C]42[/C][C]-0.056705[/C][C]-0.8237[/C][C]0.205523[/C][/ROW]
[ROW][C]43[/C][C]0.237391[/C][C]3.4483[/C][C]0.00034[/C][/ROW]
[ROW][C]44[/C][C]-0.220511[/C][C]-3.2031[/C][C]0.000785[/C][/ROW]
[ROW][C]45[/C][C]-0.124998[/C][C]-1.8157[/C][C]0.035418[/C][/ROW]
[ROW][C]46[/C][C]0.174993[/C][C]2.5419[/C][C]0.005871[/C][/ROW]
[ROW][C]47[/C][C]-0.190686[/C][C]-2.7699[/C][C]0.003054[/C][/ROW]
[ROW][C]48[/C][C]0.285943[/C][C]4.1536[/C][C]2.4e-05[/C][/ROW]
[/TABLE]
Source: https://freestatistics.org/blog/index.php?pk=309862&T=1

Globally Unique Identifier (entire table): ba.freestatistics.org/blog/index.php?pk=309862&T=1

As an alternative you can also use a QR Code:  

The GUIDs for individual cells are displayed in the table below:

Autocorrelation Function
Time lag kACF(k)T-STATP-value
1-0.398613-5.79020
2-0.13052-1.89590.029669
30.2777744.03493.8e-05
4-0.444802-6.46110
50.1135661.64960.050253
60.2700343.92255.9e-05
7-0.131553-1.91090.028686
8-0.176825-2.56850.005452
90.2060072.99240.001549
10-0.289796-4.20951.9e-05
11-0.028324-0.41140.340586
120.590168.57260
13-0.336337-4.88561e-06
140.1150421.67110.048093
150.0480560.6980.242958
16-0.436309-6.33780
170.2700493.92275.9e-05
180.1260251.83060.034284
19-0.149772-2.17560.01535
200.0168010.2440.403717
21-0.017497-0.25420.399809
22-0.254739-3.70030.000137
230.2162493.14120.000962
240.2238723.25190.000667
25-0.146896-2.13380.017007
260.174652.53690.005953
27-0.165953-2.41060.008392
28-0.209807-3.04760.001301
290.2373253.44730.000342
30-0.08183-1.18870.117957
310.0850771.23580.108951
32-0.027749-0.40310.343647
33-0.178912-2.59890.005007
340.0003990.00580.497688
350.0693441.00730.157478
360.1281351.86130.032049
370.1279281.85830.032262
38-0.078733-1.14370.127031
39-0.137991-2.00440.023151
40-0.020242-0.2940.384513
410.0476870.69270.244634
42-0.056705-0.82370.205523
430.2373913.44830.00034
44-0.220511-3.20310.000785
45-0.124998-1.81570.035418
460.1749932.54190.005871
47-0.190686-2.76990.003054
480.2859434.15362.4e-05


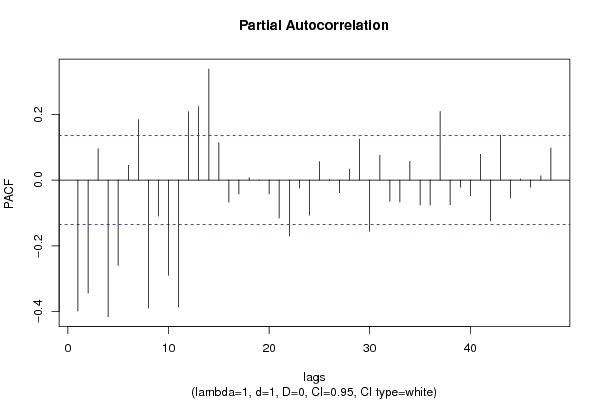
Partial Autocorrelation Function
Time lag kPACF(k)T-STATP-value
1-0.398613-5.79020
2-0.344084-4.99811e-06
30.095331.38470.083797
4-0.415542-6.03610
5-0.25958-3.77060.000106
60.0447410.64990.258231
70.183542.66610.004134
8-0.388869-5.64860
9-0.109171-1.58580.057142
10-0.289975-4.21211.9e-05
11-0.385983-5.60670
120.207633.0160.001438
130.2233513.24440.000684
140.3380534.91051e-06
150.1136121.65030.050184
16-0.067015-0.97340.165724
17-0.042172-0.61260.270407
180.0070320.10210.459371
190.0001280.00190.499262
20-0.041989-0.60990.271285
21-0.115673-1.68020.047195
22-0.170448-2.47590.007038
23-0.024106-0.35020.363283
24-0.106683-1.54970.061362
250.0557220.80940.209598
260.0017110.02480.490099
27-0.038491-0.55910.28834
280.0333520.48450.314277
290.1244541.80780.036031
30-0.156152-2.26820.012163
310.0750841.09070.138334
32-0.064061-0.93050.176578
33-0.066737-0.96940.166723
340.0568790.82620.204808
35-0.075617-1.09840.136641
36-0.075806-1.10110.136045
370.208683.03130.00137
38-0.075362-1.09470.13745
39-0.022097-0.3210.37427
40-0.047763-0.69380.244284
410.0781321.13490.128846
42-0.124265-1.8050.036246
430.1364741.98240.024366
44-0.054169-0.78690.216125
450.0031410.04560.481827
46-0.022039-0.32010.374593
470.0128620.18680.425985
480.0973621.41430.079379

\begin{tabular}{lllllllll}
\hline
Partial Autocorrelation Function \tabularnewline
Time lag k & PACF(k) & T-STAT & P-value \tabularnewline
1 & -0.398613 & -5.7902 & 0 \tabularnewline
2 & -0.344084 & -4.9981 & 1e-06 \tabularnewline
3 & 0.09533 & 1.3847 & 0.083797 \tabularnewline
4 & -0.415542 & -6.0361 & 0 \tabularnewline
5 & -0.25958 & -3.7706 & 0.000106 \tabularnewline
6 & 0.044741 & 0.6499 & 0.258231 \tabularnewline
7 & 0.18354 & 2.6661 & 0.004134 \tabularnewline
8 & -0.388869 & -5.6486 & 0 \tabularnewline
9 & -0.109171 & -1.5858 & 0.057142 \tabularnewline
10 & -0.289975 & -4.2121 & 1.9e-05 \tabularnewline
11 & -0.385983 & -5.6067 & 0 \tabularnewline
12 & 0.20763 & 3.016 & 0.001438 \tabularnewline
13 & 0.223351 & 3.2444 & 0.000684 \tabularnewline
14 & 0.338053 & 4.9105 & 1e-06 \tabularnewline
15 & 0.113612 & 1.6503 & 0.050184 \tabularnewline
16 & -0.067015 & -0.9734 & 0.165724 \tabularnewline
17 & -0.042172 & -0.6126 & 0.270407 \tabularnewline
18 & 0.007032 & 0.1021 & 0.459371 \tabularnewline
19 & 0.000128 & 0.0019 & 0.499262 \tabularnewline
20 & -0.041989 & -0.6099 & 0.271285 \tabularnewline
21 & -0.115673 & -1.6802 & 0.047195 \tabularnewline
22 & -0.170448 & -2.4759 & 0.007038 \tabularnewline
23 & -0.024106 & -0.3502 & 0.363283 \tabularnewline
24 & -0.106683 & -1.5497 & 0.061362 \tabularnewline
25 & 0.055722 & 0.8094 & 0.209598 \tabularnewline
26 & 0.001711 & 0.0248 & 0.490099 \tabularnewline
27 & -0.038491 & -0.5591 & 0.28834 \tabularnewline
28 & 0.033352 & 0.4845 & 0.314277 \tabularnewline
29 & 0.124454 & 1.8078 & 0.036031 \tabularnewline
30 & -0.156152 & -2.2682 & 0.012163 \tabularnewline
31 & 0.075084 & 1.0907 & 0.138334 \tabularnewline
32 & -0.064061 & -0.9305 & 0.176578 \tabularnewline
33 & -0.066737 & -0.9694 & 0.166723 \tabularnewline
34 & 0.056879 & 0.8262 & 0.204808 \tabularnewline
35 & -0.075617 & -1.0984 & 0.136641 \tabularnewline
36 & -0.075806 & -1.1011 & 0.136045 \tabularnewline
37 & 0.20868 & 3.0313 & 0.00137 \tabularnewline
38 & -0.075362 & -1.0947 & 0.13745 \tabularnewline
39 & -0.022097 & -0.321 & 0.37427 \tabularnewline
40 & -0.047763 & -0.6938 & 0.244284 \tabularnewline
41 & 0.078132 & 1.1349 & 0.128846 \tabularnewline
42 & -0.124265 & -1.805 & 0.036246 \tabularnewline
43 & 0.136474 & 1.9824 & 0.024366 \tabularnewline
44 & -0.054169 & -0.7869 & 0.216125 \tabularnewline
45 & 0.003141 & 0.0456 & 0.481827 \tabularnewline
46 & -0.022039 & -0.3201 & 0.374593 \tabularnewline
47 & 0.012862 & 0.1868 & 0.425985 \tabularnewline
48 & 0.097362 & 1.4143 & 0.079379 \tabularnewline
\hline
\end{tabular}
%Source: https://freestatistics.org/blog/index.php?pk=309862&T=2

[TABLE]
[ROW][C]Partial Autocorrelation Function[/C][/ROW]
[ROW][C]Time lag k[/C][C]PACF(k)[/C][C]T-STAT[/C][C]P-value[/C][/ROW]
[ROW][C]1[/C][C]-0.398613[/C][C]-5.7902[/C][C]0[/C][/ROW]
[ROW][C]2[/C][C]-0.344084[/C][C]-4.9981[/C][C]1e-06[/C][/ROW]
[ROW][C]3[/C][C]0.09533[/C][C]1.3847[/C][C]0.083797[/C][/ROW]
[ROW][C]4[/C][C]-0.415542[/C][C]-6.0361[/C][C]0[/C][/ROW]
[ROW][C]5[/C][C]-0.25958[/C][C]-3.7706[/C][C]0.000106[/C][/ROW]
[ROW][C]6[/C][C]0.044741[/C][C]0.6499[/C][C]0.258231[/C][/ROW]
[ROW][C]7[/C][C]0.18354[/C][C]2.6661[/C][C]0.004134[/C][/ROW]
[ROW][C]8[/C][C]-0.388869[/C][C]-5.6486[/C][C]0[/C][/ROW]
[ROW][C]9[/C][C]-0.109171[/C][C]-1.5858[/C][C]0.057142[/C][/ROW]
[ROW][C]10[/C][C]-0.289975[/C][C]-4.2121[/C][C]1.9e-05[/C][/ROW]
[ROW][C]11[/C][C]-0.385983[/C][C]-5.6067[/C][C]0[/C][/ROW]
[ROW][C]12[/C][C]0.20763[/C][C]3.016[/C][C]0.001438[/C][/ROW]
[ROW][C]13[/C][C]0.223351[/C][C]3.2444[/C][C]0.000684[/C][/ROW]
[ROW][C]14[/C][C]0.338053[/C][C]4.9105[/C][C]1e-06[/C][/ROW]
[ROW][C]15[/C][C]0.113612[/C][C]1.6503[/C][C]0.050184[/C][/ROW]
[ROW][C]16[/C][C]-0.067015[/C][C]-0.9734[/C][C]0.165724[/C][/ROW]
[ROW][C]17[/C][C]-0.042172[/C][C]-0.6126[/C][C]0.270407[/C][/ROW]
[ROW][C]18[/C][C]0.007032[/C][C]0.1021[/C][C]0.459371[/C][/ROW]
[ROW][C]19[/C][C]0.000128[/C][C]0.0019[/C][C]0.499262[/C][/ROW]
[ROW][C]20[/C][C]-0.041989[/C][C]-0.6099[/C][C]0.271285[/C][/ROW]
[ROW][C]21[/C][C]-0.115673[/C][C]-1.6802[/C][C]0.047195[/C][/ROW]
[ROW][C]22[/C][C]-0.170448[/C][C]-2.4759[/C][C]0.007038[/C][/ROW]
[ROW][C]23[/C][C]-0.024106[/C][C]-0.3502[/C][C]0.363283[/C][/ROW]
[ROW][C]24[/C][C]-0.106683[/C][C]-1.5497[/C][C]0.061362[/C][/ROW]
[ROW][C]25[/C][C]0.055722[/C][C]0.8094[/C][C]0.209598[/C][/ROW]
[ROW][C]26[/C][C]0.001711[/C][C]0.0248[/C][C]0.490099[/C][/ROW]
[ROW][C]27[/C][C]-0.038491[/C][C]-0.5591[/C][C]0.28834[/C][/ROW]
[ROW][C]28[/C][C]0.033352[/C][C]0.4845[/C][C]0.314277[/C][/ROW]
[ROW][C]29[/C][C]0.124454[/C][C]1.8078[/C][C]0.036031[/C][/ROW]
[ROW][C]30[/C][C]-0.156152[/C][C]-2.2682[/C][C]0.012163[/C][/ROW]
[ROW][C]31[/C][C]0.075084[/C][C]1.0907[/C][C]0.138334[/C][/ROW]
[ROW][C]32[/C][C]-0.064061[/C][C]-0.9305[/C][C]0.176578[/C][/ROW]
[ROW][C]33[/C][C]-0.066737[/C][C]-0.9694[/C][C]0.166723[/C][/ROW]
[ROW][C]34[/C][C]0.056879[/C][C]0.8262[/C][C]0.204808[/C][/ROW]
[ROW][C]35[/C][C]-0.075617[/C][C]-1.0984[/C][C]0.136641[/C][/ROW]
[ROW][C]36[/C][C]-0.075806[/C][C]-1.1011[/C][C]0.136045[/C][/ROW]
[ROW][C]37[/C][C]0.20868[/C][C]3.0313[/C][C]0.00137[/C][/ROW]
[ROW][C]38[/C][C]-0.075362[/C][C]-1.0947[/C][C]0.13745[/C][/ROW]
[ROW][C]39[/C][C]-0.022097[/C][C]-0.321[/C][C]0.37427[/C][/ROW]
[ROW][C]40[/C][C]-0.047763[/C][C]-0.6938[/C][C]0.244284[/C][/ROW]
[ROW][C]41[/C][C]0.078132[/C][C]1.1349[/C][C]0.128846[/C][/ROW]
[ROW][C]42[/C][C]-0.124265[/C][C]-1.805[/C][C]0.036246[/C][/ROW]
[ROW][C]43[/C][C]0.136474[/C][C]1.9824[/C][C]0.024366[/C][/ROW]
[ROW][C]44[/C][C]-0.054169[/C][C]-0.7869[/C][C]0.216125[/C][/ROW]
[ROW][C]45[/C][C]0.003141[/C][C]0.0456[/C][C]0.481827[/C][/ROW]
[ROW][C]46[/C][C]-0.022039[/C][C]-0.3201[/C][C]0.374593[/C][/ROW]
[ROW][C]47[/C][C]0.012862[/C][C]0.1868[/C][C]0.425985[/C][/ROW]
[ROW][C]48[/C][C]0.097362[/C][C]1.4143[/C][C]0.079379[/C][/ROW]
[/TABLE]
Source: https://freestatistics.org/blog/index.php?pk=309862&T=2

Globally Unique Identifier (entire table): ba.freestatistics.org/blog/index.php?pk=309862&T=2

As an alternative you can also use a QR Code:  

The GUIDs for individual cells are displayed in the table below:

Partial Autocorrelation Function
Time lag kPACF(k)T-STATP-value
1-0.398613-5.79020
2-0.344084-4.99811e-06
30.095331.38470.083797
4-0.415542-6.03610
5-0.25958-3.77060.000106
60.0447410.64990.258231
70.183542.66610.004134
8-0.388869-5.64860
9-0.109171-1.58580.057142
10-0.289975-4.21211.9e-05
11-0.385983-5.60670
120.207633.0160.001438
130.2233513.24440.000684
140.3380534.91051e-06
150.1136121.65030.050184
16-0.067015-0.97340.165724
17-0.042172-0.61260.270407
180.0070320.10210.459371
190.0001280.00190.499262
20-0.041989-0.60990.271285
21-0.115673-1.68020.047195
22-0.170448-2.47590.007038
23-0.024106-0.35020.363283
24-0.106683-1.54970.061362
250.0557220.80940.209598
260.0017110.02480.490099
27-0.038491-0.55910.28834
280.0333520.48450.314277
290.1244541.80780.036031
30-0.156152-2.26820.012163
310.0750841.09070.138334
32-0.064061-0.93050.176578
33-0.066737-0.96940.166723
340.0568790.82620.204808
35-0.075617-1.09840.136641
36-0.075806-1.10110.136045
370.208683.03130.00137
38-0.075362-1.09470.13745
39-0.022097-0.3210.37427
40-0.047763-0.69380.244284
410.0781321.13490.128846
42-0.124265-1.8050.036246
430.1364741.98240.024366
44-0.054169-0.78690.216125
450.0031410.04560.481827
46-0.022039-0.32010.374593
470.0128620.18680.425985
480.0973621.41430.079379


Parameters (Session):
par1 = 48 ; par2 = 1 ; par3 = 1 ; par4 = 0 ; par5 = 12 ; par6 = White Noise ; par7 = 0.95 ;
Parameters (R input):
par1 = 48 ; par2 = 1 ; par3 = 1 ; par4 = 0 ; par5 = 12 ; par6 = White Noise ; par7 = 0.95 ; par8 = ;
R code (references can be found in the software module):
if (par1 == 'Default') {
par1 = 10*log10(length(x))
} else {
par1 <- as.numeric(par1)
}
par2 <- as.numeric(par2)
par3 <- as.numeric(par3)
par4 <- as.numeric(par4)
par5 <- as.numeric(par5)
if (par6 == 'White Noise') par6 <- 'white' else par6 <- 'ma'
par7 <- as.numeric(par7)
if (par8 != '') par8 <- as.numeric(par8)
x <- na.omit(x)
ox <- x
if (par8 == '') {
if (par2 == 0) {
x <- log(x)
} else {
x <- (x ^ par2 - 1) / par2
}
} else {
x <- log(x,base=par8)
}
if (par3 > 0) x <- diff(x,lag=1,difference=par3)
if (par4 > 0) x <- diff(x,lag=par5,difference=par4)
bitmap(file='picts.png')
op <- par(mfrow=c(2,1))
plot(ox,type='l',main='Original Time Series',xlab='time',ylab='value')
if (par8=='') {
mytitle <- paste('Working Time Series (lambda=',par2,', d=',par3,', D=',par4,')',sep='')
mysub <- paste('(lambda=',par2,', d=',par3,', D=',par4,', CI=', par7, ', CI type=',par6,')',sep='')
} else {
mytitle <- paste('Working Time Series (base=',par8,', d=',par3,', D=',par4,')',sep='')
mysub <- paste('(base=',par8,', d=',par3,', D=',par4,', CI=', par7, ', CI type=',par6,')',sep='')
}
plot(x,type='l', main=mytitle,xlab='time',ylab='value')
par(op)
dev.off()
bitmap(file='pic1.png')
racf <- acf(x, par1, main='Autocorrelation', xlab='time lag', ylab='ACF', ci.type=par6, ci=par7, sub=mysub)
dev.off()
bitmap(file='pic2.png')
rpacf <- pacf(x,par1,main='Partial Autocorrelation',xlab='lags',ylab='PACF',sub=mysub)
dev.off()
(myacf <- c(racf$acf))
(mypacf <- c(rpacf$acf))
lengthx <- length(x)
sqrtn <- sqrt(lengthx)
load(file='createtable')
a<-table.start()
a<-table.row.start(a)
a<-table.element(a,'Autocorrelation Function',4,TRUE)
a<-table.row.end(a)
a<-table.row.start(a)
a<-table.element(a,'Time lag k',header=TRUE)
a<-table.element(a,'ACF(k)',header=TRUE)
a<-table.element(a,'T-STAT',header=TRUE)
a<-table.element(a,'P-value',header=TRUE)
a<-table.row.end(a)
for (i in 2:(par1+1)) {
a<-table.row.start(a)
a<-table.element(a,i-1,header=TRUE)
a<-table.element(a,round(myacf[i],6))
mytstat <- myacf[i]*sqrtn
a<-table.element(a,round(mytstat,4))
a<-table.element(a,round(1-pt(abs(mytstat),lengthx),6))
a<-table.row.end(a)
}
a<-table.end(a)
table.save(a,file='mytable.tab')
a<-table.start()
a<-table.row.start(a)
a<-table.element(a,'Partial Autocorrelation Function',4,TRUE)
a<-table.row.end(a)
a<-table.row.start(a)
a<-table.element(a,'Time lag k',header=TRUE)
a<-table.element(a,'PACF(k)',header=TRUE)
a<-table.element(a,'T-STAT',header=TRUE)
a<-table.element(a,'P-value',header=TRUE)
a<-table.row.end(a)
for (i in 1:par1) {
a<-table.row.start(a)
a<-table.element(a,i,header=TRUE)
a<-table.element(a,round(mypacf[i],6))
mytstat <- mypacf[i]*sqrtn
a<-table.element(a,round(mytstat,4))
a<-table.element(a,round(1-pt(abs(mytstat),lengthx),6))
a<-table.row.end(a)
}
a<-table.end(a)
table.save(a,file='mytable1.tab')