Free Statistics

of Irreproducible Research!

Author's title

Author*The author of this computation has been verified*
R Software Modulerwasp_correlation.wasp
Title produced by softwarePearson Correlation
Date of computationSat, 16 Dec 2017 09:52:43 +0100
Cite this page as followsStatistical Computations at FreeStatistics.org, Office for Research Development and Education, URL https://freestatistics.org/blog/index.php?v=date/2017/Dec/16/t1513414386jmhm2uhnvwtg2xb.htm/, Retrieved Wed, 15 May 2024 02:29:48 +0000
Statistical Computations at FreeStatistics.org, Office for Research Development and Education, URL https://freestatistics.org/blog/index.php?pk=309831, Retrieved Wed, 15 May 2024 02:29:48 +0000
QR Codes:

Original text written by user:
IsPrivate?No (this computation is public)
User-defined keywords
Estimated Impact109
Family? (F = Feedback message, R = changed R code, M = changed R Module, P = changed Parameters, D = changed Data)
-       [Pearson Correlation] [PC] [2017-12-16 08:52:43] [bd83e7d2022b632a928e3cc7dd68d98c] [Current]
Feedback Forum

Post a new message
Dataseries X:
400
100
250
450
100
500
450
400
51
300
250
250
120
200
230
100
450
500
190
300
175
640
250
482
500
150
250
350
900
580
850
200
550
200
250
450
250
500
700
650
400
51
500
577
580
150
200
650
800
450
250
960
250
600
800
700
300
400
600
500
200
638
450
200
440
200
500
700
1000
900
1000
360
350
280
1200
150
1100
1016
1200
580
600
800
400
500
230
300
500
110
700
1400
500
450
350
780
1250
400
300
200
51
500
500
650
830
250
710
900
250
1100
120
1500
200
580
210
150
650
1900
967
200
600
150
160
280
752
900
500
150
300
400
100
500
450
80
300
400
150
200
800
600
250
750
200
300
800
400
51
1250
500
350
1150
600
200
1300
550
200
300
700
700
500
500
700
300
250
300
900
1200
750
300
600
600
700
750
560
600
400
200
1000
500
450
850
850
350
900
1100
500
800
1200
500
650
550
400
650
400
600
700
500
600
800
800
350
1000
383
950
280
1000
600
600
380
350
1500
1000
500
380
1100
950
900
900
800
400
800
750
300
1000
1500
550
800
750
850
600
300
1000
900
800
800
800
1100
900
1250
2500
250
1250
1000
1600
950
900
350
1000
700
630
1200
600
600
1000
1100
800
800
980
800
1400
2000
1000
1200
1000
1100
1000
700
1400
850
1000
1200
Dataseries Y:
17
17
18
18
18
18
18
18
18
18
18
18
18
18
18
18
18
18
18
18
18
18
18
18
18
18
18
18
18
18
18
18
18
18
18
18
18
18
18
18
18
18
18
18
18
18
18
18
18
19
19
19
19
19
19
19
19
19
19
19
19
19
19
19
19
19
19
19
19
19
19
19
19
19
19
19
19
19
19
19
19
19
19
19
19
19
19
19
19
19
19
19
19
19
19
19
19
19
19
19
19
19
19
19
19
19
19
19
19
19
19
19
19
19
19
20
20
20
20
20
20
20
20
20
20
20
20
20
20
20
20
20
20
20
20
20
20
20
20
20
20
20
20
20
20
20
20
20
20
20
20
20
20
20
20
20
20
20
20
20
20
20
20
20
20
20
20
20
21
21
21
21
21
21
21
21
21
21
21
21
21
21
21
21
21
21
21
21
21
21
21
21
21
21
21
21
21
21
21
21
21
21
21
21
21
22
22
22
22
22
22
22
22
22
22
22
22
22
22
22
22
22
22
22
22
22
22
22
22
22
22
22
22
22
22
22
22
22
22
23
23
23
23
23
23
23
23
23
23
23
23
23
24
24
24
24
24
24
24
24
25
25
25
25
26
26
26
26
27


Summary of computational transaction
Raw Input view raw input (R code)
Raw Outputview raw output of R engine
Computing time4 seconds
R ServerBig Analytics Cloud Computing Center

\begin{tabular}{lllllllll}
\hline
Summary of computational transaction \tabularnewline
Raw Input view raw input (R code)  \tabularnewline
Raw Outputview raw output of R engine  \tabularnewline
Computing time4 seconds \tabularnewline
R ServerBig Analytics Cloud Computing Center \tabularnewline
\hline
\end{tabular}
%Source: https://freestatistics.org/blog/index.php?pk=309831&T=0

[TABLE]
[ROW]
Summary of computational transaction[/C][/ROW] [ROW]Raw Input[/C] view raw input (R code) [/C][/ROW] [ROW]Raw Output[/C]view raw output of R engine [/C][/ROW] [ROW]Computing time[/C]4 seconds[/C][/ROW] [ROW]R Server[/C]Big Analytics Cloud Computing Center[/C][/ROW] [/TABLE] Source: https://freestatistics.org/blog/index.php?pk=309831&T=0

Globally Unique Identifier (entire table): ba.freestatistics.org/blog/index.php?pk=309831&T=0

As an alternative you can also use a QR Code:  

The GUIDs for individual cells are displayed in the table below:

Summary of computational transaction
Raw Input view raw input (R code)
Raw Outputview raw output of R engine
Computing time4 seconds
R ServerBig Analytics Cloud Computing Center


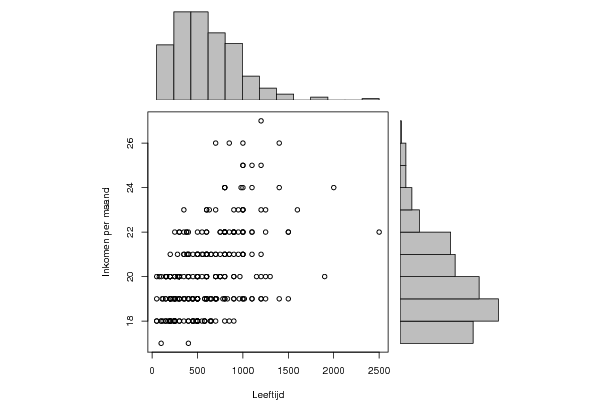
Pearson Product Moment Correlation - Ungrouped Data
StatisticVariable XVariable Y
Mean615.81412639405220.2267657992565
Biased Variance141007.4003952413.60285236522436
Biased Standard Deviation375.5095210447271.89811811150528
Covariance346.982605559563
Correlation0.485004794413322
Determination0.235229650603909
T-Test9.06225214274473
p-value (2 sided)2.81077170470613e-17
p-value (1 sided)1.40538585235307e-17
95% CI of Correlation[0.387907671103845, 0.571455142281867]
Degrees of Freedom267
Number of Observations269

\begin{tabular}{lllllllll}
\hline
Pearson Product Moment Correlation - Ungrouped Data \tabularnewline
Statistic & Variable X & Variable Y \tabularnewline
Mean & 615.814126394052 & 20.2267657992565 \tabularnewline
Biased Variance & 141007.400395241 & 3.60285236522436 \tabularnewline
Biased Standard Deviation & 375.509521044727 & 1.89811811150528 \tabularnewline
Covariance & 346.982605559563 \tabularnewline
Correlation & 0.485004794413322 \tabularnewline
Determination & 0.235229650603909 \tabularnewline
T-Test & 9.06225214274473 \tabularnewline
p-value (2 sided) & 2.81077170470613e-17 \tabularnewline
p-value (1 sided) & 1.40538585235307e-17 \tabularnewline
95% CI of Correlation & [0.387907671103845, 0.571455142281867] \tabularnewline
Degrees of Freedom & 267 \tabularnewline
Number of Observations & 269 \tabularnewline
\hline
\end{tabular}
%Source: https://freestatistics.org/blog/index.php?pk=309831&T=1

[TABLE]
[ROW][C]Pearson Product Moment Correlation - Ungrouped Data[/C][/ROW]
[ROW][C]Statistic[/C][C]Variable X[/C][C]Variable Y[/C][/ROW]
[ROW][C]Mean[/C][C]615.814126394052[/C][C]20.2267657992565[/C][/ROW]
[ROW][C]Biased Variance[/C][C]141007.400395241[/C][C]3.60285236522436[/C][/ROW]
[ROW][C]Biased Standard Deviation[/C][C]375.509521044727[/C][C]1.89811811150528[/C][/ROW]
[ROW][C]Covariance[/C][C]346.982605559563[/C][/ROW]
[ROW][C]Correlation[/C][C]0.485004794413322[/C][/ROW]
[ROW][C]Determination[/C][C]0.235229650603909[/C][/ROW]
[ROW][C]T-Test[/C][C]9.06225214274473[/C][/ROW]
[ROW][C]p-value (2 sided)[/C][C]2.81077170470613e-17[/C][/ROW]
[ROW][C]p-value (1 sided)[/C][C]1.40538585235307e-17[/C][/ROW]
[ROW][C]95% CI of Correlation[/C][C][0.387907671103845, 0.571455142281867][/C][/ROW]
[ROW][C]Degrees of Freedom[/C][C]267[/C][/ROW]
[ROW][C]Number of Observations[/C][C]269[/C][/ROW]
[/TABLE]
Source: https://freestatistics.org/blog/index.php?pk=309831&T=1

Globally Unique Identifier (entire table): ba.freestatistics.org/blog/index.php?pk=309831&T=1

As an alternative you can also use a QR Code:  

The GUIDs for individual cells are displayed in the table below:

Pearson Product Moment Correlation - Ungrouped Data
StatisticVariable XVariable Y
Mean615.81412639405220.2267657992565
Biased Variance141007.4003952413.60285236522436
Biased Standard Deviation375.5095210447271.89811811150528
Covariance346.982605559563
Correlation0.485004794413322
Determination0.235229650603909
T-Test9.06225214274473
p-value (2 sided)2.81077170470613e-17
p-value (1 sided)1.40538585235307e-17
95% CI of Correlation[0.387907671103845, 0.571455142281867]
Degrees of Freedom267
Number of Observations269


Normality Tests
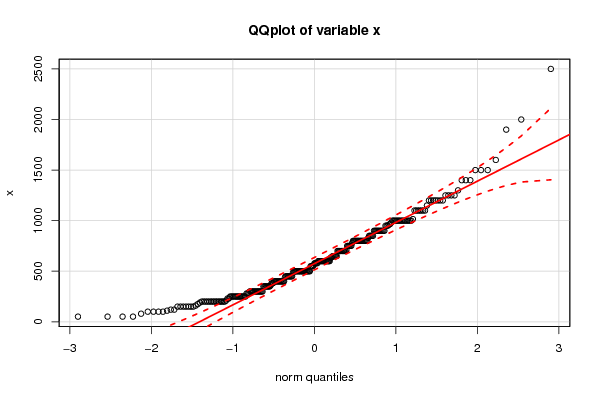
> jarque.x
	Jarque-Bera Normality Test
data:  x
JB = 109.82, p-value < 2.2e-16
alternative hypothesis: greater
> jarque.y
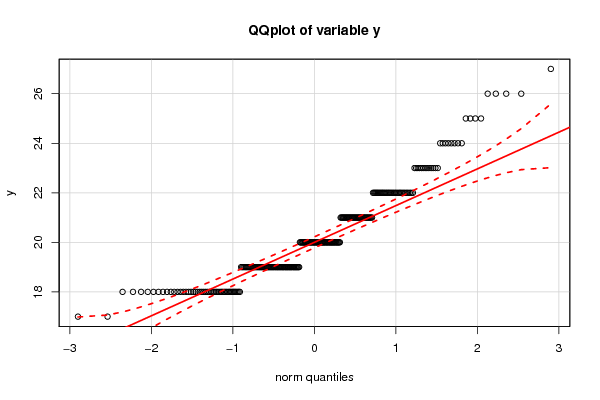
	Jarque-Bera Normality Test
data:  y
JB = 44.563, p-value = 2.105e-10
alternative hypothesis: greater
> ad.x
	Anderson-Darling normality test
data:  x
A = 3.1439, p-value = 6.685e-08
> ad.y
	Anderson-Darling normality test
data:  y
A = 7.4379, p-value < 2.2e-16

\begin{tabular}{lllllllll}
\hline
Normality Tests \tabularnewline
> jarque.x
	Jarque-Bera Normality Test
data:  x
JB = 109.82, p-value < 2.2e-16
alternative hypothesis: greater
\tabularnewline
> jarque.y
	Jarque-Bera Normality Test
data:  y
JB = 44.563, p-value = 2.105e-10
alternative hypothesis: greater
\tabularnewline
> ad.x
	Anderson-Darling normality test
data:  x
A = 3.1439, p-value = 6.685e-08
\tabularnewline
> ad.y
	Anderson-Darling normality test
data:  y
A = 7.4379, p-value < 2.2e-16
\tabularnewline \hline \end{tabular} %Source: https://freestatistics.org/blog/index.php?pk=309831&T=2

[TABLE]
[ROW][C]Normality Tests[/C][/ROW]
[ROW][C]
> jarque.x
	Jarque-Bera Normality Test
data:  x
JB = 109.82, p-value < 2.2e-16
alternative hypothesis: greater
[/C][/ROW] [ROW][C]
> jarque.y
	Jarque-Bera Normality Test
data:  y
JB = 44.563, p-value = 2.105e-10
alternative hypothesis: greater
[/C][/ROW] [ROW][C]
> ad.x
	Anderson-Darling normality test
data:  x
A = 3.1439, p-value = 6.685e-08
[/C][/ROW] [ROW][C]
> ad.y
	Anderson-Darling normality test
data:  y
A = 7.4379, p-value < 2.2e-16
[/C][/ROW] [/TABLE] Source: https://freestatistics.org/blog/index.php?pk=309831&T=2

Globally Unique Identifier (entire table): ba.freestatistics.org/blog/index.php?pk=309831&T=2

As an alternative you can also use a QR Code:  

The GUIDs for individual cells are displayed in the table below:

Normality Tests
> jarque.x
	Jarque-Bera Normality Test
data:  x
JB = 109.82, p-value < 2.2e-16
alternative hypothesis: greater
> jarque.y
	Jarque-Bera Normality Test
data:  y
JB = 44.563, p-value = 2.105e-10
alternative hypothesis: greater
> ad.x
	Anderson-Darling normality test
data:  x
A = 3.1439, p-value = 6.685e-08
> ad.y
	Anderson-Darling normality test
data:  y
A = 7.4379, p-value < 2.2e-16


Parameters (Session):
Parameters (R input):
R code (references can be found in the software module):
library(psychometric)
x <- x[!is.na(y)]
y <- y[!is.na(y)]
y <- y[!is.na(x)]
x <- x[!is.na(x)]
bitmap(file='test1.png')
histx <- hist(x, plot=FALSE)
histy <- hist(y, plot=FALSE)
maxcounts <- max(c(histx$counts, histx$counts))
xrange <- c(min(x),max(x))
yrange <- c(min(y),max(y))
nf <- layout(matrix(c(2,0,1,3),2,2,byrow=TRUE), c(3,1), c(1,3), TRUE)
par(mar=c(4,4,1,1))
plot(x, y, xlim=xrange, ylim=yrange, xlab=xlab, ylab=ylab, sub=main)
par(mar=c(0,4,1,1))
barplot(histx$counts, axes=FALSE, ylim=c(0, maxcounts), space=0)
par(mar=c(4,0,1,1))
barplot(histy$counts, axes=FALSE, xlim=c(0, maxcounts), space=0, horiz=TRUE)
dev.off()
lx = length(x)
makebiased = (lx-1)/lx
varx = var(x)*makebiased
vary = var(y)*makebiased
corxy <- cor.test(x,y,method='pearson', na.rm = T)
cxy <- as.matrix(corxy$estimate)[1,1]
load(file='createtable')
a<-table.start()
a<-table.row.start(a)
a<-table.element(a,'Pearson Product Moment Correlation - Ungrouped Data',3,TRUE)
a<-table.row.end(a)
a<-table.row.start(a)
a<-table.element(a,'Statistic',1,TRUE)
a<-table.element(a,'Variable X',1,TRUE)
a<-table.element(a,'Variable Y',1,TRUE)
a<-table.row.end(a)
a<-table.row.start(a)
a<-table.element(a,'Mean',header=TRUE)
a<-table.element(a,mean(x))
a<-table.element(a,mean(y))
a<-table.row.end(a)
a<-table.row.start(a)
a<-table.element(a,'Biased Variance',header=TRUE)
a<-table.element(a,varx)
a<-table.element(a,vary)
a<-table.row.end(a)
a<-table.row.start(a)
a<-table.element(a,'Biased Standard Deviation',header=TRUE)
a<-table.element(a,sqrt(varx))
a<-table.element(a,sqrt(vary))
a<-table.row.end(a)
a<-table.row.start(a)
a<-table.element(a,'Covariance',header=TRUE)
a<-table.element(a,cov(x,y),2)
a<-table.row.end(a)
a<-table.row.start(a)
a<-table.element(a,'Correlation',header=TRUE)
a<-table.element(a,cxy,2)
a<-table.row.end(a)
a<-table.row.start(a)
a<-table.element(a,'Determination',header=TRUE)
a<-table.element(a,cxy*cxy,2)
a<-table.row.end(a)
a<-table.row.start(a)
a<-table.element(a,'T-Test',header=TRUE)
a<-table.element(a,as.matrix(corxy$statistic)[1,1],2)
a<-table.row.end(a)
a<-table.row.start(a)
a<-table.element(a,'p-value (2 sided)',header=TRUE)
a<-table.element(a,(p2 <- as.matrix(corxy$p.value)[1,1]),2)
a<-table.row.end(a)
a<-table.row.start(a)
a<-table.element(a,'p-value (1 sided)',header=TRUE)
a<-table.element(a,p2/2,2)
a<-table.row.end(a)
a<-table.row.start(a)
a<-table.element(a,'95% CI of Correlation',header=TRUE)
a<-table.element(a,paste('[',CIr(r=cxy, n = lx, level = .95)[1],', ', CIr(r=cxy, n = lx, level = .95)[2],']',sep=''),2)
a<-table.row.end(a)
a<-table.row.start(a)
a<-table.element(a,'Degrees of Freedom',header=TRUE)
a<-table.element(a,lx-2,2)
a<-table.row.end(a)
a<-table.row.start(a)
a<-table.element(a,'Number of Observations',header=TRUE)
a<-table.element(a,lx,2)
a<-table.row.end(a)
a<-table.end(a)
table.save(a,file='mytable.tab')
library(moments)
library(nortest)
jarque.x <- jarque.test(x)
jarque.y <- jarque.test(y)
if(lx>7) {
ad.x <- ad.test(x)
ad.y <- ad.test(y)
}
a<-table.start()
a<-table.row.start(a)
a<-table.element(a,'Normality Tests',1,TRUE)
a<-table.row.end(a)
a<-table.row.start(a)
a<-table.element(a,paste('
',RC.texteval('jarque.x'),'
',sep=''))
a<-table.row.end(a)
a<-table.row.start(a)
a<-table.element(a,paste('
',RC.texteval('jarque.y'),'
',sep=''))
a<-table.row.end(a)
if(lx>7) {
a<-table.row.start(a)
a<-table.element(a,paste('
',RC.texteval('ad.x'),'
',sep=''))
a<-table.row.end(a)
a<-table.row.start(a)
a<-table.element(a,paste('
',RC.texteval('ad.y'),'
',sep=''))
a<-table.row.end(a)
}
a<-table.end(a)
table.save(a,file='mytable1.tab')
library(car)
bitmap(file='test2.png')
qqPlot(x,main='QQplot of variable x')
dev.off()
bitmap(file='test3.png')
qqPlot(y,main='QQplot of variable y')
dev.off()