Free Statistics

of Irreproducible Research!

Author's title

Author*The author of this computation has been verified*
R Software Modulerwasp_autocorrelation.wasp
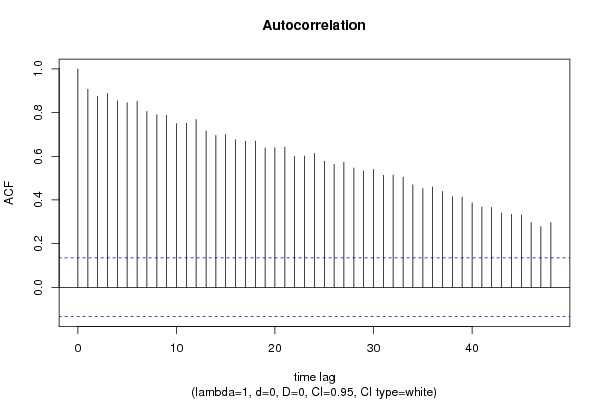
Title produced by software(Partial) Autocorrelation Function
Date of computationFri, 15 Dec 2017 14:57:07 +0100
Cite this page as followsStatistical Computations at FreeStatistics.org, Office for Research Development and Education, URL https://freestatistics.org/blog/index.php?v=date/2017/Dec/15/t1513346337jxnhg6yk8f6pxt2.htm/, Retrieved Wed, 15 May 2024 13:56:41 +0000
Statistical Computations at FreeStatistics.org, Office for Research Development and Education, URL https://freestatistics.org/blog/index.php?pk=309779, Retrieved Wed, 15 May 2024 13:56:41 +0000
QR Codes:

Original text written by user:
IsPrivate?No (this computation is public)
User-defined keywords
Estimated Impact53
Family? (F = Feedback message, R = changed R code, M = changed R Module, P = changed Parameters, D = changed Data)
-       [(Partial) Autocorrelation Function] [] [2017-12-15 13:57:07] [1fb90e819e5b19aec9e872ea972cd63e] [Current]
Feedback Forum

Post a new message
Dataseries X:
46.4
48.3
54
48.2
52.1
52.6
45.6
46.3
56.1
50.7
55
50.7
54.6
58.1
60.5
56.3
57.6
63.5
49.3
50.6
54.8
58.9
54.3
50.1
57.2
57.3
61.8
60.4
58.1
59.1
57.7
52.8
59.1
62.1
57.9
53.1
64.9
57.1
66.8
63.5
56.5
62.4
60.9
57.4
69.2
68.5
60.3
71.3
59.7
67.2
79.3
71
64.6
78.1
73.4
70.1
82.5
79.4
78.9
88.1
77.8
70.5
82.9
78.9
74.6
79.5
72
71.9
86.6
83.6
80.5
76.7
81.2
81.4
94
77.6
81
86.5
75.8
78.9
88.8
90.6
87.5
84.5
81.2
76.8
87.7
79.6
84
90
88.6
81.6
80.5
86.5
82.7
81.5
89
87.2
92
90.8
86.3
95.1
96.5
82.4
101.5
94.9
81.4
91.1
70
74.7
86.2
74.6
75
84.4
85.3
75.7
87.7
85.9
84.2
87.4
88.9
101.4
107.1
89.8
93.3
109.6
101.5
94.4
103.5
99.3
105.9
105.3
97.7
106.4
138.7
107.3
105.9
109.8
103.6
117
110.5
102
96
93.6
97.9
99.4
126.4
94.4
93.1
98.9
111.7
104.9
110.3
109.2
105.3
99.1
105.1
99.1
119.4
118.2
109.5
118.6
120.8
107.5
112.7
123.5
117.5
111.1
104.2
113.8
124.5
122.9
118.9
132.1
115.7
105.9
138.7
131.5
127
120.1
117.5
101.2
131.1
119.5
110.8
114.9
114
115.2
127.4
120.6
118.7
111.5
108.9
109.8
125.8
118
111.5
136.5
130.5
124.4
131.3
121.4
113.3
144.8
118.9
124.4
138.2
122
122.1
134.8
136.8
133.1


Summary of computational transaction
Raw Input view raw input (R code)
Raw Outputview raw output of R engine
Computing time2 seconds
R ServerBig Analytics Cloud Computing Center

\begin{tabular}{lllllllll}
\hline
Summary of computational transaction \tabularnewline
Raw Input view raw input (R code)  \tabularnewline
Raw Outputview raw output of R engine  \tabularnewline
Computing time2 seconds \tabularnewline
R ServerBig Analytics Cloud Computing Center \tabularnewline
\hline
\end{tabular}
%Source: https://freestatistics.org/blog/index.php?pk=309779&T=0

[TABLE]
[ROW]
Summary of computational transaction[/C][/ROW] [ROW]Raw Input[/C] view raw input (R code) [/C][/ROW] [ROW]Raw Output[/C]view raw output of R engine [/C][/ROW] [ROW]Computing time[/C]2 seconds[/C][/ROW] [ROW]R Server[/C]Big Analytics Cloud Computing Center[/C][/ROW] [/TABLE] Source: https://freestatistics.org/blog/index.php?pk=309779&T=0

Globally Unique Identifier (entire table): ba.freestatistics.org/blog/index.php?pk=309779&T=0

As an alternative you can also use a QR Code:  

The GUIDs for individual cells are displayed in the table below:

Summary of computational transaction
Raw Input view raw input (R code)
Raw Outputview raw output of R engine
Computing time2 seconds
R ServerBig Analytics Cloud Computing Center


Autocorrelation Function
Time lag kACF(k)T-STATP-value
10.90711513.20780
20.8746312.73480
30.8873812.92040
40.85374512.43070
50.84500212.30340
60.85224112.40880
70.80453311.71420
80.79021311.50570
90.78727711.46290
100.74879310.90260
110.75104810.93540
120.76803511.18280
130.71605310.42590
140.69517210.12190
150.69978510.1890
160.6756589.83770
170.6685899.73480
180.6697299.75140
190.6381749.2920
200.63889.30110
210.6411939.33590
220.5989388.72070
230.6007728.74740
240.6126688.92060
250.5770388.40180
260.5626778.19270
270.5724448.33490
280.5465177.95740
290.5323657.75130
300.5391667.85040
310.512797.46630
320.5138297.48150
330.5041227.34010
340.4690616.82960
350.4517346.57740
360.4596966.69330
370.4387746.38860
380.4143896.03360
390.412886.01160
400.3875165.64230
410.3672875.34780
420.3656775.32430
430.340144.95251e-06
440.3337674.85971e-06
450.3305854.81341e-06
460.2964214.31591.2e-05
470.2777914.04473.7e-05
480.2966144.31881.2e-05

\begin{tabular}{lllllllll}
\hline
Autocorrelation Function \tabularnewline
Time lag k & ACF(k) & T-STAT & P-value \tabularnewline
1 & 0.907115 & 13.2078 & 0 \tabularnewline
2 & 0.87463 & 12.7348 & 0 \tabularnewline
3 & 0.88738 & 12.9204 & 0 \tabularnewline
4 & 0.853745 & 12.4307 & 0 \tabularnewline
5 & 0.845002 & 12.3034 & 0 \tabularnewline
6 & 0.852241 & 12.4088 & 0 \tabularnewline
7 & 0.804533 & 11.7142 & 0 \tabularnewline
8 & 0.790213 & 11.5057 & 0 \tabularnewline
9 & 0.787277 & 11.4629 & 0 \tabularnewline
10 & 0.748793 & 10.9026 & 0 \tabularnewline
11 & 0.751048 & 10.9354 & 0 \tabularnewline
12 & 0.768035 & 11.1828 & 0 \tabularnewline
13 & 0.716053 & 10.4259 & 0 \tabularnewline
14 & 0.695172 & 10.1219 & 0 \tabularnewline
15 & 0.699785 & 10.189 & 0 \tabularnewline
16 & 0.675658 & 9.8377 & 0 \tabularnewline
17 & 0.668589 & 9.7348 & 0 \tabularnewline
18 & 0.669729 & 9.7514 & 0 \tabularnewline
19 & 0.638174 & 9.292 & 0 \tabularnewline
20 & 0.6388 & 9.3011 & 0 \tabularnewline
21 & 0.641193 & 9.3359 & 0 \tabularnewline
22 & 0.598938 & 8.7207 & 0 \tabularnewline
23 & 0.600772 & 8.7474 & 0 \tabularnewline
24 & 0.612668 & 8.9206 & 0 \tabularnewline
25 & 0.577038 & 8.4018 & 0 \tabularnewline
26 & 0.562677 & 8.1927 & 0 \tabularnewline
27 & 0.572444 & 8.3349 & 0 \tabularnewline
28 & 0.546517 & 7.9574 & 0 \tabularnewline
29 & 0.532365 & 7.7513 & 0 \tabularnewline
30 & 0.539166 & 7.8504 & 0 \tabularnewline
31 & 0.51279 & 7.4663 & 0 \tabularnewline
32 & 0.513829 & 7.4815 & 0 \tabularnewline
33 & 0.504122 & 7.3401 & 0 \tabularnewline
34 & 0.469061 & 6.8296 & 0 \tabularnewline
35 & 0.451734 & 6.5774 & 0 \tabularnewline
36 & 0.459696 & 6.6933 & 0 \tabularnewline
37 & 0.438774 & 6.3886 & 0 \tabularnewline
38 & 0.414389 & 6.0336 & 0 \tabularnewline
39 & 0.41288 & 6.0116 & 0 \tabularnewline
40 & 0.387516 & 5.6423 & 0 \tabularnewline
41 & 0.367287 & 5.3478 & 0 \tabularnewline
42 & 0.365677 & 5.3243 & 0 \tabularnewline
43 & 0.34014 & 4.9525 & 1e-06 \tabularnewline
44 & 0.333767 & 4.8597 & 1e-06 \tabularnewline
45 & 0.330585 & 4.8134 & 1e-06 \tabularnewline
46 & 0.296421 & 4.3159 & 1.2e-05 \tabularnewline
47 & 0.277791 & 4.0447 & 3.7e-05 \tabularnewline
48 & 0.296614 & 4.3188 & 1.2e-05 \tabularnewline
\hline
\end{tabular}
%Source: https://freestatistics.org/blog/index.php?pk=309779&T=1

[TABLE]
[ROW][C]Autocorrelation Function[/C][/ROW]
[ROW][C]Time lag k[/C][C]ACF(k)[/C][C]T-STAT[/C][C]P-value[/C][/ROW]
[ROW][C]1[/C][C]0.907115[/C][C]13.2078[/C][C]0[/C][/ROW]
[ROW][C]2[/C][C]0.87463[/C][C]12.7348[/C][C]0[/C][/ROW]
[ROW][C]3[/C][C]0.88738[/C][C]12.9204[/C][C]0[/C][/ROW]
[ROW][C]4[/C][C]0.853745[/C][C]12.4307[/C][C]0[/C][/ROW]
[ROW][C]5[/C][C]0.845002[/C][C]12.3034[/C][C]0[/C][/ROW]
[ROW][C]6[/C][C]0.852241[/C][C]12.4088[/C][C]0[/C][/ROW]
[ROW][C]7[/C][C]0.804533[/C][C]11.7142[/C][C]0[/C][/ROW]
[ROW][C]8[/C][C]0.790213[/C][C]11.5057[/C][C]0[/C][/ROW]
[ROW][C]9[/C][C]0.787277[/C][C]11.4629[/C][C]0[/C][/ROW]
[ROW][C]10[/C][C]0.748793[/C][C]10.9026[/C][C]0[/C][/ROW]
[ROW][C]11[/C][C]0.751048[/C][C]10.9354[/C][C]0[/C][/ROW]
[ROW][C]12[/C][C]0.768035[/C][C]11.1828[/C][C]0[/C][/ROW]
[ROW][C]13[/C][C]0.716053[/C][C]10.4259[/C][C]0[/C][/ROW]
[ROW][C]14[/C][C]0.695172[/C][C]10.1219[/C][C]0[/C][/ROW]
[ROW][C]15[/C][C]0.699785[/C][C]10.189[/C][C]0[/C][/ROW]
[ROW][C]16[/C][C]0.675658[/C][C]9.8377[/C][C]0[/C][/ROW]
[ROW][C]17[/C][C]0.668589[/C][C]9.7348[/C][C]0[/C][/ROW]
[ROW][C]18[/C][C]0.669729[/C][C]9.7514[/C][C]0[/C][/ROW]
[ROW][C]19[/C][C]0.638174[/C][C]9.292[/C][C]0[/C][/ROW]
[ROW][C]20[/C][C]0.6388[/C][C]9.3011[/C][C]0[/C][/ROW]
[ROW][C]21[/C][C]0.641193[/C][C]9.3359[/C][C]0[/C][/ROW]
[ROW][C]22[/C][C]0.598938[/C][C]8.7207[/C][C]0[/C][/ROW]
[ROW][C]23[/C][C]0.600772[/C][C]8.7474[/C][C]0[/C][/ROW]
[ROW][C]24[/C][C]0.612668[/C][C]8.9206[/C][C]0[/C][/ROW]
[ROW][C]25[/C][C]0.577038[/C][C]8.4018[/C][C]0[/C][/ROW]
[ROW][C]26[/C][C]0.562677[/C][C]8.1927[/C][C]0[/C][/ROW]
[ROW][C]27[/C][C]0.572444[/C][C]8.3349[/C][C]0[/C][/ROW]
[ROW][C]28[/C][C]0.546517[/C][C]7.9574[/C][C]0[/C][/ROW]
[ROW][C]29[/C][C]0.532365[/C][C]7.7513[/C][C]0[/C][/ROW]
[ROW][C]30[/C][C]0.539166[/C][C]7.8504[/C][C]0[/C][/ROW]
[ROW][C]31[/C][C]0.51279[/C][C]7.4663[/C][C]0[/C][/ROW]
[ROW][C]32[/C][C]0.513829[/C][C]7.4815[/C][C]0[/C][/ROW]
[ROW][C]33[/C][C]0.504122[/C][C]7.3401[/C][C]0[/C][/ROW]
[ROW][C]34[/C][C]0.469061[/C][C]6.8296[/C][C]0[/C][/ROW]
[ROW][C]35[/C][C]0.451734[/C][C]6.5774[/C][C]0[/C][/ROW]
[ROW][C]36[/C][C]0.459696[/C][C]6.6933[/C][C]0[/C][/ROW]
[ROW][C]37[/C][C]0.438774[/C][C]6.3886[/C][C]0[/C][/ROW]
[ROW][C]38[/C][C]0.414389[/C][C]6.0336[/C][C]0[/C][/ROW]
[ROW][C]39[/C][C]0.41288[/C][C]6.0116[/C][C]0[/C][/ROW]
[ROW][C]40[/C][C]0.387516[/C][C]5.6423[/C][C]0[/C][/ROW]
[ROW][C]41[/C][C]0.367287[/C][C]5.3478[/C][C]0[/C][/ROW]
[ROW][C]42[/C][C]0.365677[/C][C]5.3243[/C][C]0[/C][/ROW]
[ROW][C]43[/C][C]0.34014[/C][C]4.9525[/C][C]1e-06[/C][/ROW]
[ROW][C]44[/C][C]0.333767[/C][C]4.8597[/C][C]1e-06[/C][/ROW]
[ROW][C]45[/C][C]0.330585[/C][C]4.8134[/C][C]1e-06[/C][/ROW]
[ROW][C]46[/C][C]0.296421[/C][C]4.3159[/C][C]1.2e-05[/C][/ROW]
[ROW][C]47[/C][C]0.277791[/C][C]4.0447[/C][C]3.7e-05[/C][/ROW]
[ROW][C]48[/C][C]0.296614[/C][C]4.3188[/C][C]1.2e-05[/C][/ROW]
[/TABLE]
Source: https://freestatistics.org/blog/index.php?pk=309779&T=1

Globally Unique Identifier (entire table): ba.freestatistics.org/blog/index.php?pk=309779&T=1

As an alternative you can also use a QR Code:  

The GUIDs for individual cells are displayed in the table below:

Autocorrelation Function
Time lag kACF(k)T-STATP-value
10.90711513.20780
20.8746312.73480
30.8873812.92040
40.85374512.43070
50.84500212.30340
60.85224112.40880
70.80453311.71420
80.79021311.50570
90.78727711.46290
100.74879310.90260
110.75104810.93540
120.76803511.18280
130.71605310.42590
140.69517210.12190
150.69978510.1890
160.6756589.83770
170.6685899.73480
180.6697299.75140
190.6381749.2920
200.63889.30110
210.6411939.33590
220.5989388.72070
230.6007728.74740
240.6126688.92060
250.5770388.40180
260.5626778.19270
270.5724448.33490
280.5465177.95740
290.5323657.75130
300.5391667.85040
310.512797.46630
320.5138297.48150
330.5041227.34010
340.4690616.82960
350.4517346.57740
360.4596966.69330
370.4387746.38860
380.4143896.03360
390.412886.01160
400.3875165.64230
410.3672875.34780
420.3656775.32430
430.340144.95251e-06
440.3337674.85971e-06
450.3305854.81341e-06
460.2964214.31591.2e-05
470.2777914.04473.7e-05
480.2966144.31881.2e-05


Partial Autocorrelation Function
Time lag kPACF(k)T-STATP-value
10.90711513.20780
20.2922664.25551.6e-05
30.3749875.45990
4-0.028141-0.40970.341206
50.1358381.97780.024621
60.1204411.75360.040468
7-0.18843-2.74360.003299
80.0161870.23570.406954
9-0.015423-0.22460.411266
10-0.085051-1.23840.108477
110.1217211.77230.038892
120.1738922.53190.006034
13-0.172386-2.510.006411
14-0.071017-1.0340.15115
150.0278560.40560.342727
160.0363260.52890.298711
17-0.002512-0.03660.485431
180.0241210.35120.362892
190.0029650.04320.482802
200.0817361.19010.117669
210.0298560.43470.332109
22-0.145153-2.11350.017865
230.0198020.28830.386692
240.0496520.72290.235256
25-0.022895-0.33340.369595
26-0.059126-0.86090.195137
270.079341.15520.124654
28-0.013863-0.20180.420116
29-0.0827-1.20410.114942
300.0693391.00960.15692
31-0.012956-0.18860.425275
320.0329830.48020.315777
33-0.116144-1.69110.046146
340.0063140.09190.46342
35-0.137065-1.99570.023624
360.0485890.70750.240028
370.0574980.83720.201716
38-0.094613-1.37760.084892
390.0213810.31130.377932
40-0.027191-0.39590.346285
41-0.023168-0.33730.368102
42-0.022277-0.32440.372996
43-0.025734-0.37470.354132
440.0221380.32230.373758
450.0246340.35870.360099
46-0.011918-0.17350.4312
47-0.045645-0.66460.253516
480.0957811.39460.082299

\begin{tabular}{lllllllll}
\hline
Partial Autocorrelation Function \tabularnewline
Time lag k & PACF(k) & T-STAT & P-value \tabularnewline
1 & 0.907115 & 13.2078 & 0 \tabularnewline
2 & 0.292266 & 4.2555 & 1.6e-05 \tabularnewline
3 & 0.374987 & 5.4599 & 0 \tabularnewline
4 & -0.028141 & -0.4097 & 0.341206 \tabularnewline
5 & 0.135838 & 1.9778 & 0.024621 \tabularnewline
6 & 0.120441 & 1.7536 & 0.040468 \tabularnewline
7 & -0.18843 & -2.7436 & 0.003299 \tabularnewline
8 & 0.016187 & 0.2357 & 0.406954 \tabularnewline
9 & -0.015423 & -0.2246 & 0.411266 \tabularnewline
10 & -0.085051 & -1.2384 & 0.108477 \tabularnewline
11 & 0.121721 & 1.7723 & 0.038892 \tabularnewline
12 & 0.173892 & 2.5319 & 0.006034 \tabularnewline
13 & -0.172386 & -2.51 & 0.006411 \tabularnewline
14 & -0.071017 & -1.034 & 0.15115 \tabularnewline
15 & 0.027856 & 0.4056 & 0.342727 \tabularnewline
16 & 0.036326 & 0.5289 & 0.298711 \tabularnewline
17 & -0.002512 & -0.0366 & 0.485431 \tabularnewline
18 & 0.024121 & 0.3512 & 0.362892 \tabularnewline
19 & 0.002965 & 0.0432 & 0.482802 \tabularnewline
20 & 0.081736 & 1.1901 & 0.117669 \tabularnewline
21 & 0.029856 & 0.4347 & 0.332109 \tabularnewline
22 & -0.145153 & -2.1135 & 0.017865 \tabularnewline
23 & 0.019802 & 0.2883 & 0.386692 \tabularnewline
24 & 0.049652 & 0.7229 & 0.235256 \tabularnewline
25 & -0.022895 & -0.3334 & 0.369595 \tabularnewline
26 & -0.059126 & -0.8609 & 0.195137 \tabularnewline
27 & 0.07934 & 1.1552 & 0.124654 \tabularnewline
28 & -0.013863 & -0.2018 & 0.420116 \tabularnewline
29 & -0.0827 & -1.2041 & 0.114942 \tabularnewline
30 & 0.069339 & 1.0096 & 0.15692 \tabularnewline
31 & -0.012956 & -0.1886 & 0.425275 \tabularnewline
32 & 0.032983 & 0.4802 & 0.315777 \tabularnewline
33 & -0.116144 & -1.6911 & 0.046146 \tabularnewline
34 & 0.006314 & 0.0919 & 0.46342 \tabularnewline
35 & -0.137065 & -1.9957 & 0.023624 \tabularnewline
36 & 0.048589 & 0.7075 & 0.240028 \tabularnewline
37 & 0.057498 & 0.8372 & 0.201716 \tabularnewline
38 & -0.094613 & -1.3776 & 0.084892 \tabularnewline
39 & 0.021381 & 0.3113 & 0.377932 \tabularnewline
40 & -0.027191 & -0.3959 & 0.346285 \tabularnewline
41 & -0.023168 & -0.3373 & 0.368102 \tabularnewline
42 & -0.022277 & -0.3244 & 0.372996 \tabularnewline
43 & -0.025734 & -0.3747 & 0.354132 \tabularnewline
44 & 0.022138 & 0.3223 & 0.373758 \tabularnewline
45 & 0.024634 & 0.3587 & 0.360099 \tabularnewline
46 & -0.011918 & -0.1735 & 0.4312 \tabularnewline
47 & -0.045645 & -0.6646 & 0.253516 \tabularnewline
48 & 0.095781 & 1.3946 & 0.082299 \tabularnewline
\hline
\end{tabular}
%Source: https://freestatistics.org/blog/index.php?pk=309779&T=2

[TABLE]
[ROW][C]Partial Autocorrelation Function[/C][/ROW]
[ROW][C]Time lag k[/C][C]PACF(k)[/C][C]T-STAT[/C][C]P-value[/C][/ROW]
[ROW][C]1[/C][C]0.907115[/C][C]13.2078[/C][C]0[/C][/ROW]
[ROW][C]2[/C][C]0.292266[/C][C]4.2555[/C][C]1.6e-05[/C][/ROW]
[ROW][C]3[/C][C]0.374987[/C][C]5.4599[/C][C]0[/C][/ROW]
[ROW][C]4[/C][C]-0.028141[/C][C]-0.4097[/C][C]0.341206[/C][/ROW]
[ROW][C]5[/C][C]0.135838[/C][C]1.9778[/C][C]0.024621[/C][/ROW]
[ROW][C]6[/C][C]0.120441[/C][C]1.7536[/C][C]0.040468[/C][/ROW]
[ROW][C]7[/C][C]-0.18843[/C][C]-2.7436[/C][C]0.003299[/C][/ROW]
[ROW][C]8[/C][C]0.016187[/C][C]0.2357[/C][C]0.406954[/C][/ROW]
[ROW][C]9[/C][C]-0.015423[/C][C]-0.2246[/C][C]0.411266[/C][/ROW]
[ROW][C]10[/C][C]-0.085051[/C][C]-1.2384[/C][C]0.108477[/C][/ROW]
[ROW][C]11[/C][C]0.121721[/C][C]1.7723[/C][C]0.038892[/C][/ROW]
[ROW][C]12[/C][C]0.173892[/C][C]2.5319[/C][C]0.006034[/C][/ROW]
[ROW][C]13[/C][C]-0.172386[/C][C]-2.51[/C][C]0.006411[/C][/ROW]
[ROW][C]14[/C][C]-0.071017[/C][C]-1.034[/C][C]0.15115[/C][/ROW]
[ROW][C]15[/C][C]0.027856[/C][C]0.4056[/C][C]0.342727[/C][/ROW]
[ROW][C]16[/C][C]0.036326[/C][C]0.5289[/C][C]0.298711[/C][/ROW]
[ROW][C]17[/C][C]-0.002512[/C][C]-0.0366[/C][C]0.485431[/C][/ROW]
[ROW][C]18[/C][C]0.024121[/C][C]0.3512[/C][C]0.362892[/C][/ROW]
[ROW][C]19[/C][C]0.002965[/C][C]0.0432[/C][C]0.482802[/C][/ROW]
[ROW][C]20[/C][C]0.081736[/C][C]1.1901[/C][C]0.117669[/C][/ROW]
[ROW][C]21[/C][C]0.029856[/C][C]0.4347[/C][C]0.332109[/C][/ROW]
[ROW][C]22[/C][C]-0.145153[/C][C]-2.1135[/C][C]0.017865[/C][/ROW]
[ROW][C]23[/C][C]0.019802[/C][C]0.2883[/C][C]0.386692[/C][/ROW]
[ROW][C]24[/C][C]0.049652[/C][C]0.7229[/C][C]0.235256[/C][/ROW]
[ROW][C]25[/C][C]-0.022895[/C][C]-0.3334[/C][C]0.369595[/C][/ROW]
[ROW][C]26[/C][C]-0.059126[/C][C]-0.8609[/C][C]0.195137[/C][/ROW]
[ROW][C]27[/C][C]0.07934[/C][C]1.1552[/C][C]0.124654[/C][/ROW]
[ROW][C]28[/C][C]-0.013863[/C][C]-0.2018[/C][C]0.420116[/C][/ROW]
[ROW][C]29[/C][C]-0.0827[/C][C]-1.2041[/C][C]0.114942[/C][/ROW]
[ROW][C]30[/C][C]0.069339[/C][C]1.0096[/C][C]0.15692[/C][/ROW]
[ROW][C]31[/C][C]-0.012956[/C][C]-0.1886[/C][C]0.425275[/C][/ROW]
[ROW][C]32[/C][C]0.032983[/C][C]0.4802[/C][C]0.315777[/C][/ROW]
[ROW][C]33[/C][C]-0.116144[/C][C]-1.6911[/C][C]0.046146[/C][/ROW]
[ROW][C]34[/C][C]0.006314[/C][C]0.0919[/C][C]0.46342[/C][/ROW]
[ROW][C]35[/C][C]-0.137065[/C][C]-1.9957[/C][C]0.023624[/C][/ROW]
[ROW][C]36[/C][C]0.048589[/C][C]0.7075[/C][C]0.240028[/C][/ROW]
[ROW][C]37[/C][C]0.057498[/C][C]0.8372[/C][C]0.201716[/C][/ROW]
[ROW][C]38[/C][C]-0.094613[/C][C]-1.3776[/C][C]0.084892[/C][/ROW]
[ROW][C]39[/C][C]0.021381[/C][C]0.3113[/C][C]0.377932[/C][/ROW]
[ROW][C]40[/C][C]-0.027191[/C][C]-0.3959[/C][C]0.346285[/C][/ROW]
[ROW][C]41[/C][C]-0.023168[/C][C]-0.3373[/C][C]0.368102[/C][/ROW]
[ROW][C]42[/C][C]-0.022277[/C][C]-0.3244[/C][C]0.372996[/C][/ROW]
[ROW][C]43[/C][C]-0.025734[/C][C]-0.3747[/C][C]0.354132[/C][/ROW]
[ROW][C]44[/C][C]0.022138[/C][C]0.3223[/C][C]0.373758[/C][/ROW]
[ROW][C]45[/C][C]0.024634[/C][C]0.3587[/C][C]0.360099[/C][/ROW]
[ROW][C]46[/C][C]-0.011918[/C][C]-0.1735[/C][C]0.4312[/C][/ROW]
[ROW][C]47[/C][C]-0.045645[/C][C]-0.6646[/C][C]0.253516[/C][/ROW]
[ROW][C]48[/C][C]0.095781[/C][C]1.3946[/C][C]0.082299[/C][/ROW]
[/TABLE]
Source: https://freestatistics.org/blog/index.php?pk=309779&T=2

Globally Unique Identifier (entire table): ba.freestatistics.org/blog/index.php?pk=309779&T=2

As an alternative you can also use a QR Code:  

The GUIDs for individual cells are displayed in the table below:

Partial Autocorrelation Function
Time lag kPACF(k)T-STATP-value
10.90711513.20780
20.2922664.25551.6e-05
30.3749875.45990
4-0.028141-0.40970.341206
50.1358381.97780.024621
60.1204411.75360.040468
7-0.18843-2.74360.003299
80.0161870.23570.406954
9-0.015423-0.22460.411266
10-0.085051-1.23840.108477
110.1217211.77230.038892
120.1738922.53190.006034
13-0.172386-2.510.006411
14-0.071017-1.0340.15115
150.0278560.40560.342727
160.0363260.52890.298711
17-0.002512-0.03660.485431
180.0241210.35120.362892
190.0029650.04320.482802
200.0817361.19010.117669
210.0298560.43470.332109
22-0.145153-2.11350.017865
230.0198020.28830.386692
240.0496520.72290.235256
25-0.022895-0.33340.369595
26-0.059126-0.86090.195137
270.079341.15520.124654
28-0.013863-0.20180.420116
29-0.0827-1.20410.114942
300.0693391.00960.15692
31-0.012956-0.18860.425275
320.0329830.48020.315777
33-0.116144-1.69110.046146
340.0063140.09190.46342
35-0.137065-1.99570.023624
360.0485890.70750.240028
370.0574980.83720.201716
38-0.094613-1.37760.084892
390.0213810.31130.377932
40-0.027191-0.39590.346285
41-0.023168-0.33730.368102
42-0.022277-0.32440.372996
43-0.025734-0.37470.354132
440.0221380.32230.373758
450.0246340.35870.360099
46-0.011918-0.17350.4312
47-0.045645-0.66460.253516
480.0957811.39460.082299


Parameters (Session):
par1 = 48 ; par2 = 1 ; par3 = 0 ; par4 = 0 ; par5 = 12 ; par6 = White Noise ; par7 = 0.95 ;
Parameters (R input):
par1 = 48 ; par2 = 1 ; par3 = 0 ; par4 = 0 ; par5 = 12 ; par6 = White Noise ; par7 = 0.95 ; par8 = ;
R code (references can be found in the software module):
if (par1 == 'Default') {
par1 = 10*log10(length(x))
} else {
par1 <- as.numeric(par1)
}
par2 <- as.numeric(par2)
par3 <- as.numeric(par3)
par4 <- as.numeric(par4)
par5 <- as.numeric(par5)
if (par6 == 'White Noise') par6 <- 'white' else par6 <- 'ma'
par7 <- as.numeric(par7)
if (par8 != '') par8 <- as.numeric(par8)
x <- na.omit(x)
ox <- x
if (par8 == '') {
if (par2 == 0) {
x <- log(x)
} else {
x <- (x ^ par2 - 1) / par2
}
} else {
x <- log(x,base=par8)
}
if (par3 > 0) x <- diff(x,lag=1,difference=par3)
if (par4 > 0) x <- diff(x,lag=par5,difference=par4)
bitmap(file='picts.png')
op <- par(mfrow=c(2,1))
plot(ox,type='l',main='Original Time Series',xlab='time',ylab='value')
if (par8=='') {
mytitle <- paste('Working Time Series (lambda=',par2,', d=',par3,', D=',par4,')',sep='')
mysub <- paste('(lambda=',par2,', d=',par3,', D=',par4,', CI=', par7, ', CI type=',par6,')',sep='')
} else {
mytitle <- paste('Working Time Series (base=',par8,', d=',par3,', D=',par4,')',sep='')
mysub <- paste('(base=',par8,', d=',par3,', D=',par4,', CI=', par7, ', CI type=',par6,')',sep='')
}
plot(x,type='l', main=mytitle,xlab='time',ylab='value')
par(op)
dev.off()
bitmap(file='pic1.png')
racf <- acf(x, par1, main='Autocorrelation', xlab='time lag', ylab='ACF', ci.type=par6, ci=par7, sub=mysub)
dev.off()
bitmap(file='pic2.png')
rpacf <- pacf(x,par1,main='Partial Autocorrelation',xlab='lags',ylab='PACF',sub=mysub)
dev.off()
(myacf <- c(racf$acf))
(mypacf <- c(rpacf$acf))
lengthx <- length(x)
sqrtn <- sqrt(lengthx)
load(file='createtable')
a<-table.start()
a<-table.row.start(a)
a<-table.element(a,'Autocorrelation Function',4,TRUE)
a<-table.row.end(a)
a<-table.row.start(a)
a<-table.element(a,'Time lag k',header=TRUE)
a<-table.element(a,'ACF(k)',header=TRUE)
a<-table.element(a,'T-STAT',header=TRUE)
a<-table.element(a,'P-value',header=TRUE)
a<-table.row.end(a)
for (i in 2:(par1+1)) {
a<-table.row.start(a)
a<-table.element(a,i-1,header=TRUE)
a<-table.element(a,round(myacf[i],6))
mytstat <- myacf[i]*sqrtn
a<-table.element(a,round(mytstat,4))
a<-table.element(a,round(1-pt(abs(mytstat),lengthx),6))
a<-table.row.end(a)
}
a<-table.end(a)
table.save(a,file='mytable.tab')
a<-table.start()
a<-table.row.start(a)
a<-table.element(a,'Partial Autocorrelation Function',4,TRUE)
a<-table.row.end(a)
a<-table.row.start(a)
a<-table.element(a,'Time lag k',header=TRUE)
a<-table.element(a,'PACF(k)',header=TRUE)
a<-table.element(a,'T-STAT',header=TRUE)
a<-table.element(a,'P-value',header=TRUE)
a<-table.row.end(a)
for (i in 1:par1) {
a<-table.row.start(a)
a<-table.element(a,i,header=TRUE)
a<-table.element(a,round(mypacf[i],6))
mytstat <- mypacf[i]*sqrtn
a<-table.element(a,round(mytstat,4))
a<-table.element(a,round(1-pt(abs(mytstat),lengthx),6))
a<-table.row.end(a)
}
a<-table.end(a)
table.save(a,file='mytable1.tab')