Free Statistics

of Irreproducible Research!

Author's title

Author*The author of this computation has been verified*
R Software Modulerwasp_Simple Regression Y ~ X.wasp
Title produced by softwareSimple Linear Regression
Date of computationFri, 15 Dec 2017 14:12:11 +0100
Cite this page as followsStatistical Computations at FreeStatistics.org, Office for Research Development and Education, URL https://freestatistics.org/blog/index.php?v=date/2017/Dec/15/t1513343700n35m8q9yiz4ioul.htm/, Retrieved Wed, 15 May 2024 23:04:09 +0000
Statistical Computations at FreeStatistics.org, Office for Research Development and Education, URL https://freestatistics.org/blog/index.php?pk=309724, Retrieved Wed, 15 May 2024 23:04:09 +0000
QR Codes:

Original text written by user:
IsPrivate?No (this computation is public)
User-defined keywords
Estimated Impact58
Family? (F = Feedback message, R = changed R code, M = changed R Module, P = changed Parameters, D = changed Data)
-       [Simple Linear Regression] [] [2017-12-15 13:12:11] [30e08ccf92bdf95f8dcbf6f321363364] [Current]
Feedback Forum

Post a new message
Dataseries X:
31,8	18160868,57
40,1	11237274
33,6	7202198
23,4	10538275
42,6	5659715
24,4	81197537
47,5	1314870
46,5	4628949
30,1	10858018
37,5	46449565
36,5	66488186
25,4	4225316
19,8	60795612
43,4	847008
40,1	1986096
45,3	2921262
41,1	562958
27,3	9855571
20,2	429344
35,0	16900726
29,1	8576261
32,6	38005614
26,9	10374822
17,9	19870647
36,7	2062874
23,9	5421349
49,6	5471753
46,7	9747355
43,1	64875165
46,5	329100
47,5	5166493
35,3	8237666


Summary of computational transaction
Raw Input view raw input (R code)
Raw Outputview raw output of R engine
Computing time6 seconds
R ServerBig Analytics Cloud Computing Center

\begin{tabular}{lllllllll}
\hline
Summary of computational transaction \tabularnewline
Raw Input view raw input (R code)  \tabularnewline
Raw Outputview raw output of R engine  \tabularnewline
Computing time6 seconds \tabularnewline
R ServerBig Analytics Cloud Computing Center \tabularnewline
\hline
\end{tabular}
%Source: https://freestatistics.org/blog/index.php?pk=309724&T=0

[TABLE]
[ROW]
Summary of computational transaction[/C][/ROW] [ROW]Raw Input[/C] view raw input (R code) [/C][/ROW] [ROW]Raw Output[/C]view raw output of R engine [/C][/ROW] [ROW]Computing time[/C]6 seconds[/C][/ROW] [ROW]R Server[/C]Big Analytics Cloud Computing Center[/C][/ROW] [/TABLE] Source: https://freestatistics.org/blog/index.php?pk=309724&T=0

Globally Unique Identifier (entire table): ba.freestatistics.org/blog/index.php?pk=309724&T=0

As an alternative you can also use a QR Code:  

The GUIDs for individual cells are displayed in the table below:

Summary of computational transaction
Raw Input view raw input (R code)
Raw Outputview raw output of R engine
Computing time6 seconds
R ServerBig Analytics Cloud Computing Center


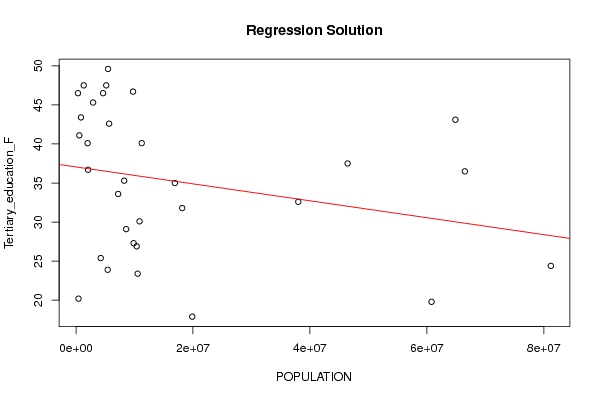
Linear Regression Model
Y ~ X
coefficients:
EstimateStd. Errort valuePr(>|t|)
(Intercept)37.0612.05718.020
X00-1.4590.155
- - -
Residual Std. Err. 9.222 on 30 df
Multiple R-sq. 0.066
95% CI Multiple R-sq. [0, 0.323]
Adjusted R-sq. 0.035

\begin{tabular}{lllllllll}
\hline
Linear Regression Model \tabularnewline
Y ~ X \tabularnewline
coefficients: &   \tabularnewline
  & Estimate & Std. Error & t value & Pr(>|t|) \tabularnewline
(Intercept) & 37.061 & 2.057 & 18.02 & 0 \tabularnewline
X & 0 & 0 & -1.459 & 0.155 \tabularnewline
- - -  &   \tabularnewline
Residual Std. Err.  & 9.222  on  30 df \tabularnewline
Multiple R-sq.  & 0.066 \tabularnewline
95% CI Multiple R-sq.  & [0, 0.323] \tabularnewline
Adjusted R-sq.  & 0.035 \tabularnewline
\hline
\end{tabular}
%Source: https://freestatistics.org/blog/index.php?pk=309724&T=1

[TABLE]
[ROW][C]Linear Regression Model[/C][/ROW]
[ROW][C]Y ~ X[/C][/ROW]
[ROW][C]coefficients:[/C][C] [/C][/ROW]
[ROW][C] [/C][C]Estimate[/C][C]Std. Error[/C][C]t value[/C][C]Pr(>|t|)[/C][/ROW]
[C](Intercept)[/C][C]37.061[/C][C]2.057[/C][C]18.02[/C][C]0[/C][/ROW]
[C]X[/C][C]0[/C][C]0[/C][C]-1.459[/C][C]0.155[/C][/ROW]
[ROW][C]- - - [/C][C] [/C][/ROW]
[ROW][C]Residual Std. Err. [/C][C]9.222  on  30 df[/C][/ROW]
[ROW][C]Multiple R-sq. [/C][C]0.066[/C][/ROW]
[ROW][C]95% CI Multiple R-sq. [/C][C][0, 0.323][/C][/ROW]
[ROW][C]Adjusted R-sq. [/C][C]0.035[/C][/ROW]
[/TABLE]
Source: https://freestatistics.org/blog/index.php?pk=309724&T=1

Globally Unique Identifier (entire table): ba.freestatistics.org/blog/index.php?pk=309724&T=1

As an alternative you can also use a QR Code:  

The GUIDs for individual cells are displayed in the table below:

Linear Regression Model
Y ~ X
coefficients:
EstimateStd. Errort valuePr(>|t|)
(Intercept)37.0612.05718.020
X00-1.4590.155
- - -
Residual Std. Err. 9.222 on 30 df
Multiple R-sq. 0.066
95% CI Multiple R-sq. [0, 0.323]
Adjusted R-sq. 0.035


ANOVA Statistics
DfSum SqMean SqF valuePr(>F)
POPULATION1181.096181.0962.1290.155
Residuals302551.43385.048

\begin{tabular}{lllllllll}
\hline
ANOVA Statistics \tabularnewline
  & Df & Sum Sq & Mean Sq & F value & Pr(>F) \tabularnewline
POPULATION & 1 & 181.096 & 181.096 & 2.129 & 0.155 \tabularnewline
Residuals & 30 & 2551.433 & 85.048 &   &   \tabularnewline
\hline
\end{tabular}
%Source: https://freestatistics.org/blog/index.php?pk=309724&T=2

[TABLE]
[ROW][C]ANOVA Statistics[/C][/ROW]
[ROW][C] [/C][C]Df[/C][C]Sum Sq[/C][C]Mean Sq[/C][C]F value[/C][C]Pr(>F)[/C][/ROW]
[ROW][C]POPULATION[/C][C]1[/C][C]181.096[/C][C]181.096[/C][C]2.129[/C][C]0.155[/C][/ROW]
[ROW][C]Residuals[/C][C]30[/C][C]2551.433[/C][C]85.048[/C][C] [/C][C] [/C][/ROW]
[/TABLE]
Source: https://freestatistics.org/blog/index.php?pk=309724&T=2

Globally Unique Identifier (entire table): ba.freestatistics.org/blog/index.php?pk=309724&T=2

As an alternative you can also use a QR Code:  

The GUIDs for individual cells are displayed in the table below:

ANOVA Statistics
DfSum SqMean SqF valuePr(>F)
POPULATION1181.096181.0962.1290.155
Residuals302551.43385.048


Parameters (Session):
par1 = 1 ; par2 = 2 ; par3 = TRUE ;
Parameters (R input):
par1 = 1 ; par2 = 2 ; par3 = TRUE ;
R code (references can be found in the software module):
library(boot)
cat1 <- as.numeric(par1)
cat2<- as.numeric(par2)
intercept<-as.logical(par3)
x <- na.omit(t(x))
rsq <- function(formula, data, indices) {
d <- data[indices,] # allows boot to select sample
fit <- lm(formula, data=d)
return(summary(fit)$r.square)
}
xdf<-data.frame(na.omit(t(y)))
(V1<-dimnames(y)[[1]][cat1])
(V2<-dimnames(y)[[1]][cat2])
xdf <- data.frame(xdf[[cat1]], xdf[[cat2]])
names(xdf)<-c('Y', 'X')
if(intercept == FALSE) (lmxdf<-lm(Y~ X - 1, data = xdf) ) else (lmxdf<-lm(Y~ X, data = xdf) )
(results <- boot(data=xdf, statistic=rsq, R=1000, formula=Y~X))
sumlmxdf<-summary(lmxdf)
(aov.xdf<-aov(lmxdf) )
(anova.xdf<-anova(lmxdf) )
load(file='createtable')
a<-table.start()
nc <- ncol(sumlmxdf$'coefficients')
nr <- nrow(sumlmxdf$'coefficients')
a<-table.row.start(a)
a<-table.element(a,'Linear Regression Model', nc+1,TRUE)
a<-table.row.end(a)
a<-table.row.start(a)
a<-table.element(a, lmxdf$call['formula'],nc+1)
a<-table.row.end(a)
a<-table.row.start(a)
a<-table.element(a, 'coefficients:',1,TRUE)
a<-table.element(a, ' ',nc,TRUE)
a<-table.row.end(a)
a<-table.row.start(a)
a<-table.element(a, ' ',1,TRUE)
for(i in 1 : nc){
a<-table.element(a, dimnames(sumlmxdf$'coefficients')[[2]][i],1,TRUE)
}#end header
a<-table.row.end(a)
for(i in 1: nr){
a<-table.element(a,dimnames(sumlmxdf$'coefficients')[[1]][i] ,1,TRUE)
for(j in 1 : nc){
a<-table.element(a, round(sumlmxdf$coefficients[i, j], digits=3), 1 ,FALSE)
}
a<-table.row.end(a)
}
a<-table.row.start(a)
a<-table.element(a, '- - - ',1,TRUE)
a<-table.element(a, ' ',nc,FALSE)
a<-table.row.end(a)
a<-table.row.start(a)
a<-table.element(a, 'Residual Std. Err. ',1,TRUE)
a<-table.element(a, paste(round(sumlmxdf$'sigma', digits=3), ' on ', sumlmxdf$'df'[2], 'df') ,nc, FALSE)
a<-table.row.end(a)
a<-table.row.start(a)
a<-table.element(a, 'Multiple R-sq. ',1,TRUE)
a<-table.element(a, round(sumlmxdf$'r.squared', digits=3) ,nc, FALSE)
a<-table.row.end(a)
a<-table.row.start(a)
a<-table.element(a, '95% CI Multiple R-sq. ',1,TRUE)
a<-table.element(a, paste('[',round(boot.ci(results,type='bca')$bca[1,4], digits=3),', ', round(boot.ci(results,type='bca')$bca[1,5], digits=3), ']',sep='') ,nc, FALSE)
a<-table.row.end(a)
a<-table.row.start(a)
a<-table.element(a, 'Adjusted R-sq. ',1,TRUE)
a<-table.element(a, round(sumlmxdf$'adj.r.squared', digits=3) ,nc, FALSE)
a<-table.row.end(a)
a<-table.end(a)
table.save(a,file='mytable.tab')
a<-table.start()
a<-table.row.start(a)
a<-table.element(a,'ANOVA Statistics', 5+1,TRUE)
a<-table.row.end(a)
a<-table.row.start(a)
a<-table.element(a, ' ',1,TRUE)
a<-table.element(a, 'Df',1,TRUE)
a<-table.element(a, 'Sum Sq',1,TRUE)
a<-table.element(a, 'Mean Sq',1,TRUE)
a<-table.element(a, 'F value',1,TRUE)
a<-table.element(a, 'Pr(>F)',1,TRUE)
a<-table.row.end(a)
a<-table.row.start(a)
a<-table.element(a, V2,1,TRUE)
a<-table.element(a, anova.xdf$Df[1])
a<-table.element(a, round(anova.xdf$'Sum Sq'[1], digits=3))
a<-table.element(a, round(anova.xdf$'Mean Sq'[1], digits=3))
a<-table.element(a, round(anova.xdf$'F value'[1], digits=3))
a<-table.element(a, round(anova.xdf$'Pr(>F)'[1], digits=3))
a<-table.row.end(a)
a<-table.row.start(a)
a<-table.element(a, 'Residuals',1,TRUE)
a<-table.element(a, anova.xdf$Df[2])
a<-table.element(a, round(anova.xdf$'Sum Sq'[2], digits=3))
a<-table.element(a, round(anova.xdf$'Mean Sq'[2], digits=3))
a<-table.element(a, ' ')
a<-table.row.end(a)
a<-table.end(a)
table.save(a,file='mytable1.tab')
bitmap(file='regressionplot.png')
plot(Y~ X, data=xdf, xlab=V2, ylab=V1, main='Regression Solution')
if(intercept == TRUE) abline(coef(lmxdf), col='red')
if(intercept == FALSE) abline(0.0, coef(lmxdf), col='red')
dev.off()
library(car)
bitmap(file='residualsQQplot.png')
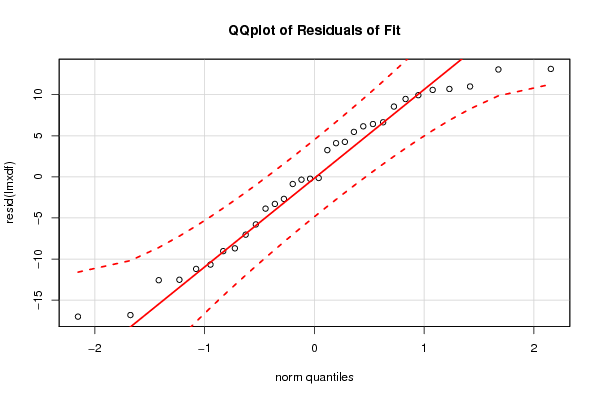
qqPlot(resid(lmxdf), main='QQplot of Residuals of Fit')
dev.off()
bitmap(file='residualsplot.png')
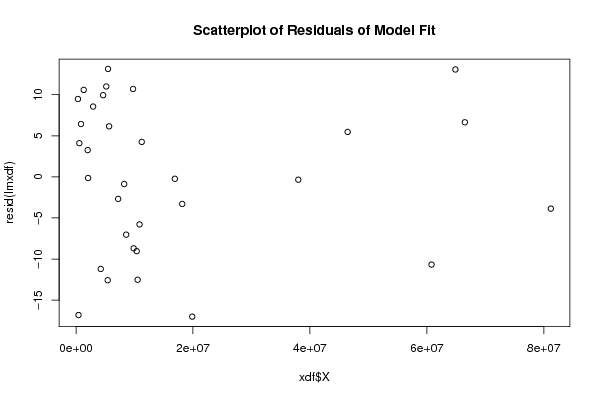
plot(xdf$X, resid(lmxdf), main='Scatterplot of Residuals of Model Fit')
dev.off()
bitmap(file='cooksDistanceLmplot.png')
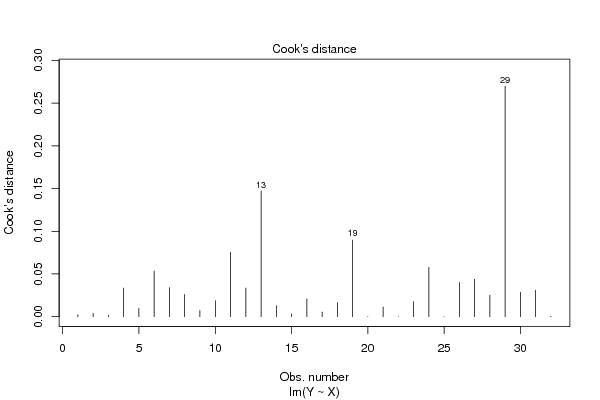
plot(lmxdf, which=4)
dev.off()