Free Statistics
of Irreproducible Research!
Description of Statistical Computation | ||||||||||||||||||||||||||||||||||||||||||||||||||||||
|---|---|---|---|---|---|---|---|---|---|---|---|---|---|---|---|---|---|---|---|---|---|---|---|---|---|---|---|---|---|---|---|---|---|---|---|---|---|---|---|---|---|---|---|---|---|---|---|---|---|---|---|---|---|---|
| Author's title | ||||||||||||||||||||||||||||||||||||||||||||||||||||||
| Author | *The author of this computation has been verified* | |||||||||||||||||||||||||||||||||||||||||||||||||||||
| R Software Module | rwasp_univariatedataseries.wasp | |||||||||||||||||||||||||||||||||||||||||||||||||||||
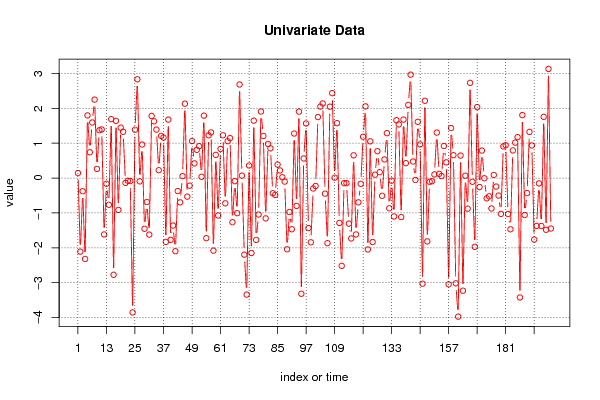
| Title produced by software | Univariate Data Series | |||||||||||||||||||||||||||||||||||||||||||||||||||||
| Date of computation | Fri, 15 Dec 2017 13:32:17 +0100 | |||||||||||||||||||||||||||||||||||||||||||||||||||||
| Cite this page as follows | Statistical Computations at FreeStatistics.org, Office for Research Development and Education, URL https://freestatistics.org/blog/index.php?v=date/2017/Dec/15/t15133411496b3v166zo77a41r.htm/, Retrieved Wed, 15 May 2024 15:49:02 +0000 | |||||||||||||||||||||||||||||||||||||||||||||||||||||
| Statistical Computations at FreeStatistics.org, Office for Research Development and Education, URL https://freestatistics.org/blog/index.php?pk=309668, Retrieved Wed, 15 May 2024 15:49:02 +0000 | ||||||||||||||||||||||||||||||||||||||||||||||||||||||
| QR Codes: | ||||||||||||||||||||||||||||||||||||||||||||||||||||||
|
| ||||||||||||||||||||||||||||||||||||||||||||||||||||||
| Original text written by user: | ||||||||||||||||||||||||||||||||||||||||||||||||||||||
| IsPrivate? | No (this computation is public) | |||||||||||||||||||||||||||||||||||||||||||||||||||||
| User-defined keywords | ||||||||||||||||||||||||||||||||||||||||||||||||||||||
| Estimated Impact | 52 | |||||||||||||||||||||||||||||||||||||||||||||||||||||
Tree of Dependent Computations | ||||||||||||||||||||||||||||||||||||||||||||||||||||||
| Family? (F = Feedback message, R = changed R code, M = changed R Module, P = changed Parameters, D = changed Data) | ||||||||||||||||||||||||||||||||||||||||||||||||||||||
| - [Univariate Data Series] [] [2017-12-15 12:32:17] [b1f7c59fedc08def0443d20f9974e39d] [Current] | ||||||||||||||||||||||||||||||||||||||||||||||||||||||
| Feedback Forum | ||||||||||||||||||||||||||||||||||||||||||||||||||||||
Post a new message | ||||||||||||||||||||||||||||||||||||||||||||||||||||||
Dataset | ||||||||||||||||||||||||||||||||||||||||||||||||||||||
| Dataseries X: | ||||||||||||||||||||||||||||||||||||||||||||||||||||||
0.14342074691846 -2.10894957482308 -0.377549157516032 -2.31848061450116 1.79546846471165 0.738111121767554 1.59277481647205 2.24753113621692 0.261738661242085 1.3704118214032 1.39347961023293 -1.6163736309949 -0.163289284469416 -0.766608729346257 1.6881763404003 -2.77162593910401 1.63907238217352 -0.913986705496426 1.44421142131526 1.32537008787758 -0.139497983358953 -0.0778159109547049 -0.0843751751058734 -3.85078645304658 1.38532355277338 2.83106907669425 -0.0951510210864578 0.961221894521523 -1.45391345634007 -0.685589257842171 -1.62057765279762 1.77965197051366 1.62716741549437 1.38854987038806 0.224661078603809 1.20760894317041 1.16033348896381 -1.83091480728911 1.67574489140512 -1.77078144016694 -1.36126892965307 -2.09660025140935 -0.372762521329983 -0.696599248043709 0.0541376698594785 2.13160758062822 -0.532226431830591 -0.218022342175541 1.06014131890997 0.421625730151871 0.808885930746573 0.914200282228637 0.0363494827883616 1.78837182896804 -1.72257401711039 1.22614034021502 1.30735135409831 -2.08000960044883 0.664615585997992 -1.07194372611069 0.833792979445055 1.22619098469681 -0.724827435484126 1.05707332012936 1.14388276640234 -1.26613014771926 -0.0901369865884901 -1.00665092987619 2.68198279673422 0.0693320259344213 -2.19517654926635 -3.34045455919707 0.359209389618316 -2.14846808621424 1.64533791577777 -1.77361657371984 -1.04579910941429 1.9071010055359 1.20507201578765 -1.1552951440572 0.976868173019912 0.851038948213179 -0.434214554473188 -0.481858948781513 0.385626367718131 0.21818748018739 0.0244616438475429 -0.101055051923652 -2.04079930639378 -0.973999364961164 -1.46738671323593 1.27643122195792 -0.797992272722035 1.90370027328035 -3.31612950467666 0.560890726934901 1.56539348921843 -1.43404320233397 -1.84150410015466 -0.300119177143937 -0.228321080454425 1.74830970752247 2.04825155320663 2.13919750437398 -0.447687811369046 -1.86652249241337 2.04435298729778 2.43353326678545 0.0103733219703029 1.57376925234347 -1.28627276242831 -2.51653964449374 -0.146649830595527 -0.146649830595527 -1.30599136268843 -1.73036945680763 0.652457032716899 -1.6158718356358 -0.696018025411762 -0.167000875010226 1.18407774310528 2.05487054623741 -2.04667288368964 1.0535226048781 -1.83332924350603 0.096439278570419 0.769355158997296 0.167905148531634 -0.508595869564411 0.533115082123174 1.28643597437811 -0.865828255470918 -0.075866556723459 -1.10013112571374 1.65743381953076 1.53792105110849 -1.11727608521767 1.67614732456316 0.426561236581144 2.09663172015377 2.96284852256694 0.473654582799951 -0.054495951662013 1.61103663631646 0.965072879150713 -3.02874607477674 2.215512830167 -1.81417202563146 -0.106524804310093 -0.0909188366979335 0.104706958589107 1.30403311161725 0.121208325632365 0.0560071042706579 0.917528381354119 0.450756753657595 -3.04612955263418 1.4333408252021 0.655102407399011 -3.01673842738264 -3.97238070926157 0.643298028431518 -3.2285228854345 0.0672081443041729 -0.877554106369718 2.7284906330093 -0.106524804310093 -1.97129708666564 2.03210364629038 -0.258499800329142 0.787978480908282 -0.00590771990269886 -0.581682178733627 -0.523580234064656 -0.872015261006466 0.0883159656077206 -0.244198916922778 -0.50209925494134 -1.02682399882704 0.906699107389 0.940596170183849 -1.03020107168404 -1.46795113373553 0.791749801029174 1.01573462705739 1.17291519995361 -3.42185483940392 1.80299212074681 -1.0600676125168 -0.430594395551058 1.32479912854698 0.933808650980519 -1.76244598792813 -1.37171878666679 -0.153546416602979 -1.37467323612575 1.75557908715669 -1.48313640471217 3.12726261846417 -1.44657234277993 | ||||||||||||||||||||||||||||||||||||||||||||||||||||||
Tables (Output of Computation) | ||||||||||||||||||||||||||||||||||||||||||||||||||||||
| ||||||||||||||||||||||||||||||||||||||||||||||||||||||
Figures (Output of Computation) | ||||||||||||||||||||||||||||||||||||||||||||||||||||||
Input Parameters & R Code | ||||||||||||||||||||||||||||||||||||||||||||||||||||||
| Parameters (Session): | ||||||||||||||||||||||||||||||||||||||||||||||||||||||
| Parameters (R input): | ||||||||||||||||||||||||||||||||||||||||||||||||||||||
| par1 = ; par2 = ; par3 = ; par4 = 12 ; | ||||||||||||||||||||||||||||||||||||||||||||||||||||||
| R code (references can be found in the software module): | ||||||||||||||||||||||||||||||||||||||||||||||||||||||
if (par4 != 'No season') { | ||||||||||||||||||||||||||||||||||||||||||||||||||||||