Free Statistics

of Irreproducible Research!

Author's title

Author*The author of this computation has been verified*
R Software Modulerwasp_autocorrelation.wasp
Title produced by software(Partial) Autocorrelation Function
Date of computationFri, 15 Dec 2017 12:11:26 +0100
Cite this page as followsStatistical Computations at FreeStatistics.org, Office for Research Development and Education, URL https://freestatistics.org/blog/index.php?v=date/2017/Dec/15/t1513336307k7b1s5vp50fi8g7.htm/, Retrieved Wed, 15 May 2024 22:35:42 +0000
Statistical Computations at FreeStatistics.org, Office for Research Development and Education, URL https://freestatistics.org/blog/index.php?pk=309650, Retrieved Wed, 15 May 2024 22:35:42 +0000
QR Codes:

Original text written by user:
IsPrivate?No (this computation is public)
User-defined keywords
Estimated Impact61
Family? (F = Feedback message, R = changed R code, M = changed R Module, P = changed Parameters, D = changed Data)
-       [(Partial) Autocorrelation Function] [] [2017-12-15 11:11:26] [4a18882c9dbf23bd76c659f8b4f63e4f] [Current]
Feedback Forum

Post a new message
Dataseries X:
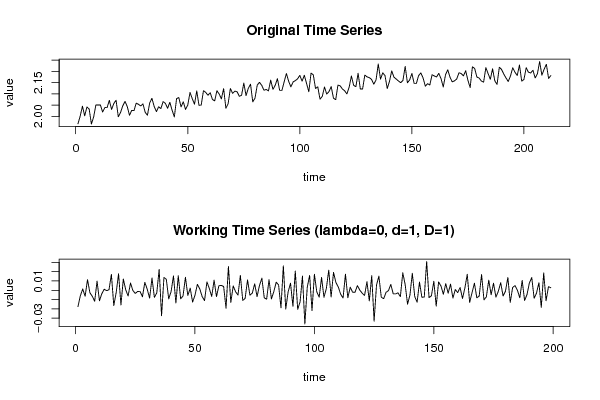
1.967478768
2.001817584
2.045607581
2.002844284
2.041901208
2.032960967
1.966356052
1.997684181
2.051104827
2.050649534
2.051104827
2.019415808
2.039567496
2.039099144
2.071520755
2.031053477
2.057426369
2.071953539
1.998721552
2.017443159
2.046988839
2.06672997
2.043758604
2.004889809
2.027211349
2.025761096
2.05921478
2.053826002
2.046528938
2.055630135
2.018430691
2.005399561
2.059660669
2.080515568
2.044684139
2.02137885
2.043295048
2.034859533
2.065852913
2.057874202
2.036277655
2.062768432
2.027693613
1.997684181
2.07881725
2.083891515
2.042366351
2.064973986
2.031053477
2.050649534
2.106389843
2.07881725
2.05427778
2.11349835
2.049280611
2.050649534
2.114280833
2.106787926
2.093858169
2.10519333
2.07539961
2.068914491
2.113889773
2.099564073
2.077965477
2.123559329
2.036277655
2.056079931
2.123941553
2.102388141
2.112321897
2.109168539
2.089319671
2.093858169
2.148077383
2.092625281
2.124704971
2.142992985
2.064533819
2.08136213
2.138955273
2.151314361
2.137847422
2.116230718
2.119717993
2.113106563
2.161231844
2.120103698
2.137847422
2.167488974
2.115451844
2.115451844
2.153102192
2.190344444
2.156301668
2.131139173
2.153102192
2.158773808
2.166798195
2.182080588
2.156301668
2.182414166
2.146268447
2.109564002
2.191978616
2.184742092
2.123941553
2.131514639
2.076684529
2.088904622
2.130387246
2.099159078
2.110353816
2.132264578
2.08136213
2.074110693
2.138955273
2.135623052
2.121643016
2.113889773
2.099564073
2.129633986
2.179402721
2.138217025
2.131889773
2.19165227
2.122026973
2.121643016
2.183413372
2.175354748
2.171952371
2.164371738
2.142992985
2.161581852
2.232467447
2.165413316
2.193281573
2.181078317
2.123559329
2.155592727
2.201976644
2.173996997
2.165759952
2.157362895
2.149519056
2.159828968
2.221926109
2.149159091
2.161931575
2.190671767
2.146268447
2.146268447
2.181078317
2.192956197
2.170241119
2.134133665
2.145179409
2.139323919
2.184742092
2.179402721
2.175015708
2.190998846
2.167488974
2.130763375
2.184742092
2.206733887
2.174336834
2.153458868
2.157716056
2.16610631
2.193606707
2.190016875
2.180073734
2.202613924
2.159828968
2.128123451
2.219787477
2.21299801
2.174676404
2.170241119
2.157009443
2.152030387
2.216405768
2.190016875
2.16471921
2.211128095
2.157716056
2.142261687
2.217946111
2.208622484
2.188046291
2.170241119
2.154882617
2.179738357
2.215788126
2.195875912
2.181412664
2.227980299
2.156655701
2.164023986
2.216097055
2.196199127
2.192630579
2.204837157
2.170583911
2.189032694
2.243346493
2.18274749
2.209250223
2.231275289
2.168178653
2.181412664


Summary of computational transaction
Raw Input view raw input (R code)
Raw Outputview raw output of R engine
Computing time1 seconds
R ServerBig Analytics Cloud Computing Center

\begin{tabular}{lllllllll}
\hline
Summary of computational transaction \tabularnewline
Raw Input view raw input (R code)  \tabularnewline
Raw Outputview raw output of R engine  \tabularnewline
Computing time1 seconds \tabularnewline
R ServerBig Analytics Cloud Computing Center \tabularnewline
\hline
\end{tabular}
%Source: https://freestatistics.org/blog/index.php?pk=309650&T=0

[TABLE]
[ROW]
Summary of computational transaction[/C][/ROW] [ROW]Raw Input[/C] view raw input (R code) [/C][/ROW] [ROW]Raw Output[/C]view raw output of R engine [/C][/ROW] [ROW]Computing time[/C]1 seconds[/C][/ROW] [ROW]R Server[/C]Big Analytics Cloud Computing Center[/C][/ROW] [/TABLE] Source: https://freestatistics.org/blog/index.php?pk=309650&T=0

Globally Unique Identifier (entire table): ba.freestatistics.org/blog/index.php?pk=309650&T=0

As an alternative you can also use a QR Code:  

The GUIDs for individual cells are displayed in the table below:

Summary of computational transaction
Raw Input view raw input (R code)
Raw Outputview raw output of R engine
Computing time1 seconds
R ServerBig Analytics Cloud Computing Center


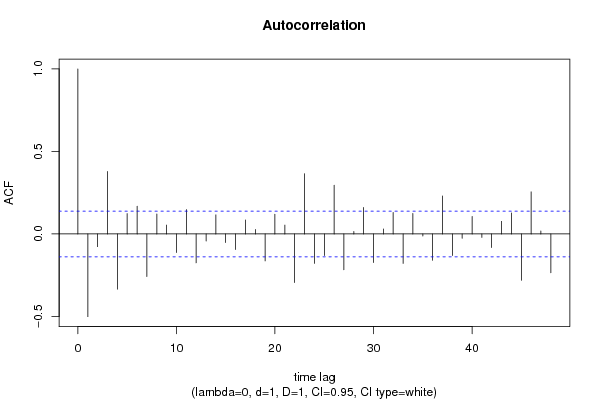
Autocorrelation Function
Time lag kACF(k)T-STATP-value
1-0.50095-7.06680
2-0.076796-1.08330.139985
30.3788735.34470
4-0.334443-4.71792e-06
50.1234711.74180.041546
60.1682612.37360.009284
7-0.257873-3.63780.000175
80.1214741.71360.044079
90.0537360.7580.224661
10-0.112465-1.58650.057106
110.1474732.08040.019387
12-0.174935-2.46780.00722
13-0.042317-0.5970.275608
140.1157651.63310.052018
15-0.051176-0.72190.235594
16-0.094131-1.32790.09287
170.0851571.20130.115533
180.0274060.38660.349731
19-0.162917-2.29820.011294
200.119751.68930.046365
210.0537410.75810.224642
22-0.293757-4.14392.5e-05
230.3646295.14370
24-0.178171-2.51340.006375
25-0.130535-1.84140.033525
260.2951034.16292.3e-05
27-0.216457-3.05350.001286
280.0148090.20890.417368
290.1603032.26140.012409
30-0.172957-2.43990.007784
310.0299790.42290.33641
320.1302731.83770.033796
33-0.178118-2.51270.006388
340.1240631.75010.040819
35-0.012705-0.17920.428971
36-0.158795-2.24010.013096
370.2299473.24380.000692
38-0.130005-1.8340.034077
39-0.026239-0.37010.355833
400.1059481.49460.068304
41-0.020509-0.28930.386323
42-0.082112-1.15830.124059
430.0764271.07810.141139
440.1273481.79650.036969
45-0.280992-3.96395.1e-05
460.2551213.59890.000202
470.0180180.25420.399811
48-0.234821-3.31260.000549

\begin{tabular}{lllllllll}
\hline
Autocorrelation Function \tabularnewline
Time lag k & ACF(k) & T-STAT & P-value \tabularnewline
1 & -0.50095 & -7.0668 & 0 \tabularnewline
2 & -0.076796 & -1.0833 & 0.139985 \tabularnewline
3 & 0.378873 & 5.3447 & 0 \tabularnewline
4 & -0.334443 & -4.7179 & 2e-06 \tabularnewline
5 & 0.123471 & 1.7418 & 0.041546 \tabularnewline
6 & 0.168261 & 2.3736 & 0.009284 \tabularnewline
7 & -0.257873 & -3.6378 & 0.000175 \tabularnewline
8 & 0.121474 & 1.7136 & 0.044079 \tabularnewline
9 & 0.053736 & 0.758 & 0.224661 \tabularnewline
10 & -0.112465 & -1.5865 & 0.057106 \tabularnewline
11 & 0.147473 & 2.0804 & 0.019387 \tabularnewline
12 & -0.174935 & -2.4678 & 0.00722 \tabularnewline
13 & -0.042317 & -0.597 & 0.275608 \tabularnewline
14 & 0.115765 & 1.6331 & 0.052018 \tabularnewline
15 & -0.051176 & -0.7219 & 0.235594 \tabularnewline
16 & -0.094131 & -1.3279 & 0.09287 \tabularnewline
17 & 0.085157 & 1.2013 & 0.115533 \tabularnewline
18 & 0.027406 & 0.3866 & 0.349731 \tabularnewline
19 & -0.162917 & -2.2982 & 0.011294 \tabularnewline
20 & 0.11975 & 1.6893 & 0.046365 \tabularnewline
21 & 0.053741 & 0.7581 & 0.224642 \tabularnewline
22 & -0.293757 & -4.1439 & 2.5e-05 \tabularnewline
23 & 0.364629 & 5.1437 & 0 \tabularnewline
24 & -0.178171 & -2.5134 & 0.006375 \tabularnewline
25 & -0.130535 & -1.8414 & 0.033525 \tabularnewline
26 & 0.295103 & 4.1629 & 2.3e-05 \tabularnewline
27 & -0.216457 & -3.0535 & 0.001286 \tabularnewline
28 & 0.014809 & 0.2089 & 0.417368 \tabularnewline
29 & 0.160303 & 2.2614 & 0.012409 \tabularnewline
30 & -0.172957 & -2.4399 & 0.007784 \tabularnewline
31 & 0.029979 & 0.4229 & 0.33641 \tabularnewline
32 & 0.130273 & 1.8377 & 0.033796 \tabularnewline
33 & -0.178118 & -2.5127 & 0.006388 \tabularnewline
34 & 0.124063 & 1.7501 & 0.040819 \tabularnewline
35 & -0.012705 & -0.1792 & 0.428971 \tabularnewline
36 & -0.158795 & -2.2401 & 0.013096 \tabularnewline
37 & 0.229947 & 3.2438 & 0.000692 \tabularnewline
38 & -0.130005 & -1.834 & 0.034077 \tabularnewline
39 & -0.026239 & -0.3701 & 0.355833 \tabularnewline
40 & 0.105948 & 1.4946 & 0.068304 \tabularnewline
41 & -0.020509 & -0.2893 & 0.386323 \tabularnewline
42 & -0.082112 & -1.1583 & 0.124059 \tabularnewline
43 & 0.076427 & 1.0781 & 0.141139 \tabularnewline
44 & 0.127348 & 1.7965 & 0.036969 \tabularnewline
45 & -0.280992 & -3.9639 & 5.1e-05 \tabularnewline
46 & 0.255121 & 3.5989 & 0.000202 \tabularnewline
47 & 0.018018 & 0.2542 & 0.399811 \tabularnewline
48 & -0.234821 & -3.3126 & 0.000549 \tabularnewline
\hline
\end{tabular}
%Source: https://freestatistics.org/blog/index.php?pk=309650&T=1

[TABLE]
[ROW][C]Autocorrelation Function[/C][/ROW]
[ROW][C]Time lag k[/C][C]ACF(k)[/C][C]T-STAT[/C][C]P-value[/C][/ROW]
[ROW][C]1[/C][C]-0.50095[/C][C]-7.0668[/C][C]0[/C][/ROW]
[ROW][C]2[/C][C]-0.076796[/C][C]-1.0833[/C][C]0.139985[/C][/ROW]
[ROW][C]3[/C][C]0.378873[/C][C]5.3447[/C][C]0[/C][/ROW]
[ROW][C]4[/C][C]-0.334443[/C][C]-4.7179[/C][C]2e-06[/C][/ROW]
[ROW][C]5[/C][C]0.123471[/C][C]1.7418[/C][C]0.041546[/C][/ROW]
[ROW][C]6[/C][C]0.168261[/C][C]2.3736[/C][C]0.009284[/C][/ROW]
[ROW][C]7[/C][C]-0.257873[/C][C]-3.6378[/C][C]0.000175[/C][/ROW]
[ROW][C]8[/C][C]0.121474[/C][C]1.7136[/C][C]0.044079[/C][/ROW]
[ROW][C]9[/C][C]0.053736[/C][C]0.758[/C][C]0.224661[/C][/ROW]
[ROW][C]10[/C][C]-0.112465[/C][C]-1.5865[/C][C]0.057106[/C][/ROW]
[ROW][C]11[/C][C]0.147473[/C][C]2.0804[/C][C]0.019387[/C][/ROW]
[ROW][C]12[/C][C]-0.174935[/C][C]-2.4678[/C][C]0.00722[/C][/ROW]
[ROW][C]13[/C][C]-0.042317[/C][C]-0.597[/C][C]0.275608[/C][/ROW]
[ROW][C]14[/C][C]0.115765[/C][C]1.6331[/C][C]0.052018[/C][/ROW]
[ROW][C]15[/C][C]-0.051176[/C][C]-0.7219[/C][C]0.235594[/C][/ROW]
[ROW][C]16[/C][C]-0.094131[/C][C]-1.3279[/C][C]0.09287[/C][/ROW]
[ROW][C]17[/C][C]0.085157[/C][C]1.2013[/C][C]0.115533[/C][/ROW]
[ROW][C]18[/C][C]0.027406[/C][C]0.3866[/C][C]0.349731[/C][/ROW]
[ROW][C]19[/C][C]-0.162917[/C][C]-2.2982[/C][C]0.011294[/C][/ROW]
[ROW][C]20[/C][C]0.11975[/C][C]1.6893[/C][C]0.046365[/C][/ROW]
[ROW][C]21[/C][C]0.053741[/C][C]0.7581[/C][C]0.224642[/C][/ROW]
[ROW][C]22[/C][C]-0.293757[/C][C]-4.1439[/C][C]2.5e-05[/C][/ROW]
[ROW][C]23[/C][C]0.364629[/C][C]5.1437[/C][C]0[/C][/ROW]
[ROW][C]24[/C][C]-0.178171[/C][C]-2.5134[/C][C]0.006375[/C][/ROW]
[ROW][C]25[/C][C]-0.130535[/C][C]-1.8414[/C][C]0.033525[/C][/ROW]
[ROW][C]26[/C][C]0.295103[/C][C]4.1629[/C][C]2.3e-05[/C][/ROW]
[ROW][C]27[/C][C]-0.216457[/C][C]-3.0535[/C][C]0.001286[/C][/ROW]
[ROW][C]28[/C][C]0.014809[/C][C]0.2089[/C][C]0.417368[/C][/ROW]
[ROW][C]29[/C][C]0.160303[/C][C]2.2614[/C][C]0.012409[/C][/ROW]
[ROW][C]30[/C][C]-0.172957[/C][C]-2.4399[/C][C]0.007784[/C][/ROW]
[ROW][C]31[/C][C]0.029979[/C][C]0.4229[/C][C]0.33641[/C][/ROW]
[ROW][C]32[/C][C]0.130273[/C][C]1.8377[/C][C]0.033796[/C][/ROW]
[ROW][C]33[/C][C]-0.178118[/C][C]-2.5127[/C][C]0.006388[/C][/ROW]
[ROW][C]34[/C][C]0.124063[/C][C]1.7501[/C][C]0.040819[/C][/ROW]
[ROW][C]35[/C][C]-0.012705[/C][C]-0.1792[/C][C]0.428971[/C][/ROW]
[ROW][C]36[/C][C]-0.158795[/C][C]-2.2401[/C][C]0.013096[/C][/ROW]
[ROW][C]37[/C][C]0.229947[/C][C]3.2438[/C][C]0.000692[/C][/ROW]
[ROW][C]38[/C][C]-0.130005[/C][C]-1.834[/C][C]0.034077[/C][/ROW]
[ROW][C]39[/C][C]-0.026239[/C][C]-0.3701[/C][C]0.355833[/C][/ROW]
[ROW][C]40[/C][C]0.105948[/C][C]1.4946[/C][C]0.068304[/C][/ROW]
[ROW][C]41[/C][C]-0.020509[/C][C]-0.2893[/C][C]0.386323[/C][/ROW]
[ROW][C]42[/C][C]-0.082112[/C][C]-1.1583[/C][C]0.124059[/C][/ROW]
[ROW][C]43[/C][C]0.076427[/C][C]1.0781[/C][C]0.141139[/C][/ROW]
[ROW][C]44[/C][C]0.127348[/C][C]1.7965[/C][C]0.036969[/C][/ROW]
[ROW][C]45[/C][C]-0.280992[/C][C]-3.9639[/C][C]5.1e-05[/C][/ROW]
[ROW][C]46[/C][C]0.255121[/C][C]3.5989[/C][C]0.000202[/C][/ROW]
[ROW][C]47[/C][C]0.018018[/C][C]0.2542[/C][C]0.399811[/C][/ROW]
[ROW][C]48[/C][C]-0.234821[/C][C]-3.3126[/C][C]0.000549[/C][/ROW]
[/TABLE]
Source: https://freestatistics.org/blog/index.php?pk=309650&T=1

Globally Unique Identifier (entire table): ba.freestatistics.org/blog/index.php?pk=309650&T=1

As an alternative you can also use a QR Code:  

The GUIDs for individual cells are displayed in the table below:

Autocorrelation Function
Time lag kACF(k)T-STATP-value
1-0.50095-7.06680
2-0.076796-1.08330.139985
30.3788735.34470
4-0.334443-4.71792e-06
50.1234711.74180.041546
60.1682612.37360.009284
7-0.257873-3.63780.000175
80.1214741.71360.044079
90.0537360.7580.224661
10-0.112465-1.58650.057106
110.1474732.08040.019387
12-0.174935-2.46780.00722
13-0.042317-0.5970.275608
140.1157651.63310.052018
15-0.051176-0.72190.235594
16-0.094131-1.32790.09287
170.0851571.20130.115533
180.0274060.38660.349731
19-0.162917-2.29820.011294
200.119751.68930.046365
210.0537410.75810.224642
22-0.293757-4.14392.5e-05
230.3646295.14370
24-0.178171-2.51340.006375
25-0.130535-1.84140.033525
260.2951034.16292.3e-05
27-0.216457-3.05350.001286
280.0148090.20890.417368
290.1603032.26140.012409
30-0.172957-2.43990.007784
310.0299790.42290.33641
320.1302731.83770.033796
33-0.178118-2.51270.006388
340.1240631.75010.040819
35-0.012705-0.17920.428971
36-0.158795-2.24010.013096
370.2299473.24380.000692
38-0.130005-1.8340.034077
39-0.026239-0.37010.355833
400.1059481.49460.068304
41-0.020509-0.28930.386323
42-0.082112-1.15830.124059
430.0764271.07810.141139
440.1273481.79650.036969
45-0.280992-3.96395.1e-05
460.2551213.59890.000202
470.0180180.25420.399811
48-0.234821-3.31260.000549


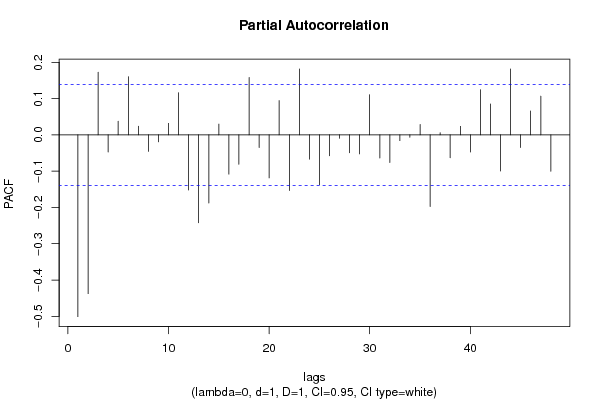
Partial Autocorrelation Function
Time lag kPACF(k)T-STATP-value
1-0.50095-7.06680
2-0.43755-6.17240
30.1723442.43120.007967
4-0.047488-0.66990.251847
50.0376410.5310.298009
60.1600632.2580.012517
70.0236960.33430.369261
8-0.045592-0.64320.26043
9-0.019289-0.27210.392914
100.0317390.44770.327417
110.1159021.6350.051815
12-0.151903-2.14290.01667
13-0.242115-3.41540.000386
14-0.187722-2.64810.004371
150.0295490.41680.338621
16-0.10831-1.52790.064063
17-0.081019-1.14290.127222
180.1582162.23190.013368
19-0.034908-0.49240.311478
20-0.118551-1.67240.048012
210.094391.33150.092268
22-0.153478-2.16510.015786
230.1815622.56120.005585
24-0.066839-0.94290.173441
25-0.137447-1.93890.026962
26-0.057758-0.81480.208086
27-0.009199-0.12980.448439
28-0.049354-0.69620.24355
29-0.052377-0.73890.230427
300.1103591.55680.060553
31-0.063798-0.90.184608
32-0.075977-1.07180.142556
33-0.015885-0.22410.411462
34-0.006859-0.09680.461506
350.0284910.40190.344091
36-0.197659-2.78830.002906
370.0056720.080.468152
38-0.063072-0.88970.187341
390.0233680.32960.371006
40-0.047042-0.66360.253856
410.1243911.75480.04042
420.0848831.19740.116283
43-0.099559-1.40450.080872
440.1816042.56180.005576
45-0.034842-0.49150.311807
460.065750.92750.177389
470.106661.50460.067003
48-0.100403-1.41640.079118

\begin{tabular}{lllllllll}
\hline
Partial Autocorrelation Function \tabularnewline
Time lag k & PACF(k) & T-STAT & P-value \tabularnewline
1 & -0.50095 & -7.0668 & 0 \tabularnewline
2 & -0.43755 & -6.1724 & 0 \tabularnewline
3 & 0.172344 & 2.4312 & 0.007967 \tabularnewline
4 & -0.047488 & -0.6699 & 0.251847 \tabularnewline
5 & 0.037641 & 0.531 & 0.298009 \tabularnewline
6 & 0.160063 & 2.258 & 0.012517 \tabularnewline
7 & 0.023696 & 0.3343 & 0.369261 \tabularnewline
8 & -0.045592 & -0.6432 & 0.26043 \tabularnewline
9 & -0.019289 & -0.2721 & 0.392914 \tabularnewline
10 & 0.031739 & 0.4477 & 0.327417 \tabularnewline
11 & 0.115902 & 1.635 & 0.051815 \tabularnewline
12 & -0.151903 & -2.1429 & 0.01667 \tabularnewline
13 & -0.242115 & -3.4154 & 0.000386 \tabularnewline
14 & -0.187722 & -2.6481 & 0.004371 \tabularnewline
15 & 0.029549 & 0.4168 & 0.338621 \tabularnewline
16 & -0.10831 & -1.5279 & 0.064063 \tabularnewline
17 & -0.081019 & -1.1429 & 0.127222 \tabularnewline
18 & 0.158216 & 2.2319 & 0.013368 \tabularnewline
19 & -0.034908 & -0.4924 & 0.311478 \tabularnewline
20 & -0.118551 & -1.6724 & 0.048012 \tabularnewline
21 & 0.09439 & 1.3315 & 0.092268 \tabularnewline
22 & -0.153478 & -2.1651 & 0.015786 \tabularnewline
23 & 0.181562 & 2.5612 & 0.005585 \tabularnewline
24 & -0.066839 & -0.9429 & 0.173441 \tabularnewline
25 & -0.137447 & -1.9389 & 0.026962 \tabularnewline
26 & -0.057758 & -0.8148 & 0.208086 \tabularnewline
27 & -0.009199 & -0.1298 & 0.448439 \tabularnewline
28 & -0.049354 & -0.6962 & 0.24355 \tabularnewline
29 & -0.052377 & -0.7389 & 0.230427 \tabularnewline
30 & 0.110359 & 1.5568 & 0.060553 \tabularnewline
31 & -0.063798 & -0.9 & 0.184608 \tabularnewline
32 & -0.075977 & -1.0718 & 0.142556 \tabularnewline
33 & -0.015885 & -0.2241 & 0.411462 \tabularnewline
34 & -0.006859 & -0.0968 & 0.461506 \tabularnewline
35 & 0.028491 & 0.4019 & 0.344091 \tabularnewline
36 & -0.197659 & -2.7883 & 0.002906 \tabularnewline
37 & 0.005672 & 0.08 & 0.468152 \tabularnewline
38 & -0.063072 & -0.8897 & 0.187341 \tabularnewline
39 & 0.023368 & 0.3296 & 0.371006 \tabularnewline
40 & -0.047042 & -0.6636 & 0.253856 \tabularnewline
41 & 0.124391 & 1.7548 & 0.04042 \tabularnewline
42 & 0.084883 & 1.1974 & 0.116283 \tabularnewline
43 & -0.099559 & -1.4045 & 0.080872 \tabularnewline
44 & 0.181604 & 2.5618 & 0.005576 \tabularnewline
45 & -0.034842 & -0.4915 & 0.311807 \tabularnewline
46 & 0.06575 & 0.9275 & 0.177389 \tabularnewline
47 & 0.10666 & 1.5046 & 0.067003 \tabularnewline
48 & -0.100403 & -1.4164 & 0.079118 \tabularnewline
\hline
\end{tabular}
%Source: https://freestatistics.org/blog/index.php?pk=309650&T=2

[TABLE]
[ROW][C]Partial Autocorrelation Function[/C][/ROW]
[ROW][C]Time lag k[/C][C]PACF(k)[/C][C]T-STAT[/C][C]P-value[/C][/ROW]
[ROW][C]1[/C][C]-0.50095[/C][C]-7.0668[/C][C]0[/C][/ROW]
[ROW][C]2[/C][C]-0.43755[/C][C]-6.1724[/C][C]0[/C][/ROW]
[ROW][C]3[/C][C]0.172344[/C][C]2.4312[/C][C]0.007967[/C][/ROW]
[ROW][C]4[/C][C]-0.047488[/C][C]-0.6699[/C][C]0.251847[/C][/ROW]
[ROW][C]5[/C][C]0.037641[/C][C]0.531[/C][C]0.298009[/C][/ROW]
[ROW][C]6[/C][C]0.160063[/C][C]2.258[/C][C]0.012517[/C][/ROW]
[ROW][C]7[/C][C]0.023696[/C][C]0.3343[/C][C]0.369261[/C][/ROW]
[ROW][C]8[/C][C]-0.045592[/C][C]-0.6432[/C][C]0.26043[/C][/ROW]
[ROW][C]9[/C][C]-0.019289[/C][C]-0.2721[/C][C]0.392914[/C][/ROW]
[ROW][C]10[/C][C]0.031739[/C][C]0.4477[/C][C]0.327417[/C][/ROW]
[ROW][C]11[/C][C]0.115902[/C][C]1.635[/C][C]0.051815[/C][/ROW]
[ROW][C]12[/C][C]-0.151903[/C][C]-2.1429[/C][C]0.01667[/C][/ROW]
[ROW][C]13[/C][C]-0.242115[/C][C]-3.4154[/C][C]0.000386[/C][/ROW]
[ROW][C]14[/C][C]-0.187722[/C][C]-2.6481[/C][C]0.004371[/C][/ROW]
[ROW][C]15[/C][C]0.029549[/C][C]0.4168[/C][C]0.338621[/C][/ROW]
[ROW][C]16[/C][C]-0.10831[/C][C]-1.5279[/C][C]0.064063[/C][/ROW]
[ROW][C]17[/C][C]-0.081019[/C][C]-1.1429[/C][C]0.127222[/C][/ROW]
[ROW][C]18[/C][C]0.158216[/C][C]2.2319[/C][C]0.013368[/C][/ROW]
[ROW][C]19[/C][C]-0.034908[/C][C]-0.4924[/C][C]0.311478[/C][/ROW]
[ROW][C]20[/C][C]-0.118551[/C][C]-1.6724[/C][C]0.048012[/C][/ROW]
[ROW][C]21[/C][C]0.09439[/C][C]1.3315[/C][C]0.092268[/C][/ROW]
[ROW][C]22[/C][C]-0.153478[/C][C]-2.1651[/C][C]0.015786[/C][/ROW]
[ROW][C]23[/C][C]0.181562[/C][C]2.5612[/C][C]0.005585[/C][/ROW]
[ROW][C]24[/C][C]-0.066839[/C][C]-0.9429[/C][C]0.173441[/C][/ROW]
[ROW][C]25[/C][C]-0.137447[/C][C]-1.9389[/C][C]0.026962[/C][/ROW]
[ROW][C]26[/C][C]-0.057758[/C][C]-0.8148[/C][C]0.208086[/C][/ROW]
[ROW][C]27[/C][C]-0.009199[/C][C]-0.1298[/C][C]0.448439[/C][/ROW]
[ROW][C]28[/C][C]-0.049354[/C][C]-0.6962[/C][C]0.24355[/C][/ROW]
[ROW][C]29[/C][C]-0.052377[/C][C]-0.7389[/C][C]0.230427[/C][/ROW]
[ROW][C]30[/C][C]0.110359[/C][C]1.5568[/C][C]0.060553[/C][/ROW]
[ROW][C]31[/C][C]-0.063798[/C][C]-0.9[/C][C]0.184608[/C][/ROW]
[ROW][C]32[/C][C]-0.075977[/C][C]-1.0718[/C][C]0.142556[/C][/ROW]
[ROW][C]33[/C][C]-0.015885[/C][C]-0.2241[/C][C]0.411462[/C][/ROW]
[ROW][C]34[/C][C]-0.006859[/C][C]-0.0968[/C][C]0.461506[/C][/ROW]
[ROW][C]35[/C][C]0.028491[/C][C]0.4019[/C][C]0.344091[/C][/ROW]
[ROW][C]36[/C][C]-0.197659[/C][C]-2.7883[/C][C]0.002906[/C][/ROW]
[ROW][C]37[/C][C]0.005672[/C][C]0.08[/C][C]0.468152[/C][/ROW]
[ROW][C]38[/C][C]-0.063072[/C][C]-0.8897[/C][C]0.187341[/C][/ROW]
[ROW][C]39[/C][C]0.023368[/C][C]0.3296[/C][C]0.371006[/C][/ROW]
[ROW][C]40[/C][C]-0.047042[/C][C]-0.6636[/C][C]0.253856[/C][/ROW]
[ROW][C]41[/C][C]0.124391[/C][C]1.7548[/C][C]0.04042[/C][/ROW]
[ROW][C]42[/C][C]0.084883[/C][C]1.1974[/C][C]0.116283[/C][/ROW]
[ROW][C]43[/C][C]-0.099559[/C][C]-1.4045[/C][C]0.080872[/C][/ROW]
[ROW][C]44[/C][C]0.181604[/C][C]2.5618[/C][C]0.005576[/C][/ROW]
[ROW][C]45[/C][C]-0.034842[/C][C]-0.4915[/C][C]0.311807[/C][/ROW]
[ROW][C]46[/C][C]0.06575[/C][C]0.9275[/C][C]0.177389[/C][/ROW]
[ROW][C]47[/C][C]0.10666[/C][C]1.5046[/C][C]0.067003[/C][/ROW]
[ROW][C]48[/C][C]-0.100403[/C][C]-1.4164[/C][C]0.079118[/C][/ROW]
[/TABLE]
Source: https://freestatistics.org/blog/index.php?pk=309650&T=2

Globally Unique Identifier (entire table): ba.freestatistics.org/blog/index.php?pk=309650&T=2

As an alternative you can also use a QR Code:  

The GUIDs for individual cells are displayed in the table below:

Partial Autocorrelation Function
Time lag kPACF(k)T-STATP-value
1-0.50095-7.06680
2-0.43755-6.17240
30.1723442.43120.007967
4-0.047488-0.66990.251847
50.0376410.5310.298009
60.1600632.2580.012517
70.0236960.33430.369261
8-0.045592-0.64320.26043
9-0.019289-0.27210.392914
100.0317390.44770.327417
110.1159021.6350.051815
12-0.151903-2.14290.01667
13-0.242115-3.41540.000386
14-0.187722-2.64810.004371
150.0295490.41680.338621
16-0.10831-1.52790.064063
17-0.081019-1.14290.127222
180.1582162.23190.013368
19-0.034908-0.49240.311478
20-0.118551-1.67240.048012
210.094391.33150.092268
22-0.153478-2.16510.015786
230.1815622.56120.005585
24-0.066839-0.94290.173441
25-0.137447-1.93890.026962
26-0.057758-0.81480.208086
27-0.009199-0.12980.448439
28-0.049354-0.69620.24355
29-0.052377-0.73890.230427
300.1103591.55680.060553
31-0.063798-0.90.184608
32-0.075977-1.07180.142556
33-0.015885-0.22410.411462
34-0.006859-0.09680.461506
350.0284910.40190.344091
36-0.197659-2.78830.002906
370.0056720.080.468152
38-0.063072-0.88970.187341
390.0233680.32960.371006
40-0.047042-0.66360.253856
410.1243911.75480.04042
420.0848831.19740.116283
43-0.099559-1.40450.080872
440.1816042.56180.005576
45-0.034842-0.49150.311807
460.065750.92750.177389
470.106661.50460.067003
48-0.100403-1.41640.079118


Parameters (Session):
par1 = FALSE ; par2 = 0.2 ; par3 = 1 ; par4 = 1 ; par5 = 12 ; par6 = 3 ; par7 = 1 ; par8 = 1 ; par9 = 1 ;
Parameters (R input):
par1 = 48 ; par2 = 0.0 ; par3 = 1 ; par4 = 1 ; par5 = 12 ; par6 = White Noise ; par7 = 0.95 ; par8 = ;
R code (references can be found in the software module):
par8 <- ''
par7 <- '0.95'
par6 <- 'White Noise'
par5 <- '12'
par4 <- '1'
par3 <- '1'
par2 <- '1.0'
par1 <- '48'
if (par1 == 'Default') {
par1 = 10*log10(length(x))
} else {
par1 <- as.numeric(par1)
}
par2 <- as.numeric(par2)
par3 <- as.numeric(par3)
par4 <- as.numeric(par4)
par5 <- as.numeric(par5)
if (par6 == 'White Noise') par6 <- 'white' else par6 <- 'ma'
par7 <- as.numeric(par7)
if (par8 != '') par8 <- as.numeric(par8)
x <- na.omit(x)
ox <- x
if (par8 == '') {
if (par2 == 0) {
x <- log(x)
} else {
x <- (x ^ par2 - 1) / par2
}
} else {
x <- log(x,base=par8)
}
if (par3 > 0) x <- diff(x,lag=1,difference=par3)
if (par4 > 0) x <- diff(x,lag=par5,difference=par4)
bitmap(file='picts.png')
op <- par(mfrow=c(2,1))
plot(ox,type='l',main='Original Time Series',xlab='time',ylab='value')
if (par8=='') {
mytitle <- paste('Working Time Series (lambda=',par2,', d=',par3,', D=',par4,')',sep='')
mysub <- paste('(lambda=',par2,', d=',par3,', D=',par4,', CI=', par7, ', CI type=',par6,')',sep='')
} else {
mytitle <- paste('Working Time Series (base=',par8,', d=',par3,', D=',par4,')',sep='')
mysub <- paste('(base=',par8,', d=',par3,', D=',par4,', CI=', par7, ', CI type=',par6,')',sep='')
}
plot(x,type='l', main=mytitle,xlab='time',ylab='value')
par(op)
dev.off()
bitmap(file='pic1.png')
racf <- acf(x, par1, main='Autocorrelation', xlab='time lag', ylab='ACF', ci.type=par6, ci=par7, sub=mysub)
dev.off()
bitmap(file='pic2.png')
rpacf <- pacf(x,par1,main='Partial Autocorrelation',xlab='lags',ylab='PACF',sub=mysub)
dev.off()
(myacf <- c(racf$acf))
(mypacf <- c(rpacf$acf))
lengthx <- length(x)
sqrtn <- sqrt(lengthx)
load(file='createtable')
a<-table.start()
a<-table.row.start(a)
a<-table.element(a,'Autocorrelation Function',4,TRUE)
a<-table.row.end(a)
a<-table.row.start(a)
a<-table.element(a,'Time lag k',header=TRUE)
a<-table.element(a,'ACF(k)',header=TRUE)
a<-table.element(a,'T-STAT',header=TRUE)
a<-table.element(a,'P-value',header=TRUE)
a<-table.row.end(a)
for (i in 2:(par1+1)) {
a<-table.row.start(a)
a<-table.element(a,i-1,header=TRUE)
a<-table.element(a,round(myacf[i],6))
mytstat <- myacf[i]*sqrtn
a<-table.element(a,round(mytstat,4))
a<-table.element(a,round(1-pt(abs(mytstat),lengthx),6))
a<-table.row.end(a)
}
a<-table.end(a)
table.save(a,file='mytable.tab')
a<-table.start()
a<-table.row.start(a)
a<-table.element(a,'Partial Autocorrelation Function',4,TRUE)
a<-table.row.end(a)
a<-table.row.start(a)
a<-table.element(a,'Time lag k',header=TRUE)
a<-table.element(a,'PACF(k)',header=TRUE)
a<-table.element(a,'T-STAT',header=TRUE)
a<-table.element(a,'P-value',header=TRUE)
a<-table.row.end(a)
for (i in 1:par1) {
a<-table.row.start(a)
a<-table.element(a,i,header=TRUE)
a<-table.element(a,round(mypacf[i],6))
mytstat <- mypacf[i]*sqrtn
a<-table.element(a,round(mytstat,4))
a<-table.element(a,round(1-pt(abs(mytstat),lengthx),6))
a<-table.row.end(a)
}
a<-table.end(a)
table.save(a,file='mytable1.tab')