Free Statistics
of Irreproducible Research!
Description of Statistical Computation | ||||||||||||||||||||||||||||||||||||||||||||||
|---|---|---|---|---|---|---|---|---|---|---|---|---|---|---|---|---|---|---|---|---|---|---|---|---|---|---|---|---|---|---|---|---|---|---|---|---|---|---|---|---|---|---|---|---|---|---|
| Author's title | ||||||||||||||||||||||||||||||||||||||||||||||
| Author | *The author of this computation has been verified* | |||||||||||||||||||||||||||||||||||||||||||||
| R Software Module | rwasp_spearman.wasp | |||||||||||||||||||||||||||||||||||||||||||||
| Title produced by software | Spearman Rank Correlation | |||||||||||||||||||||||||||||||||||||||||||||
| Date of computation | Fri, 15 Dec 2017 09:14:59 +0100 | |||||||||||||||||||||||||||||||||||||||||||||
| Cite this page as follows | Statistical Computations at FreeStatistics.org, Office for Research Development and Education, URL https://freestatistics.org/blog/index.php?v=date/2017/Dec/15/t1513325714jvt0vlp6h43ayq6.htm/, Retrieved Wed, 15 May 2024 16:40:01 +0000 | |||||||||||||||||||||||||||||||||||||||||||||
| Statistical Computations at FreeStatistics.org, Office for Research Development and Education, URL https://freestatistics.org/blog/index.php?pk=309607, Retrieved Wed, 15 May 2024 16:40:01 +0000 | ||||||||||||||||||||||||||||||||||||||||||||||
| QR Codes: | ||||||||||||||||||||||||||||||||||||||||||||||
|
| ||||||||||||||||||||||||||||||||||||||||||||||
| Original text written by user: | ||||||||||||||||||||||||||||||||||||||||||||||
| IsPrivate? | No (this computation is public) | |||||||||||||||||||||||||||||||||||||||||||||
| User-defined keywords | ||||||||||||||||||||||||||||||||||||||||||||||
| Estimated Impact | 103 | |||||||||||||||||||||||||||||||||||||||||||||
Tree of Dependent Computations | ||||||||||||||||||||||||||||||||||||||||||||||
| Family? (F = Feedback message, R = changed R code, M = changed R Module, P = changed Parameters, D = changed Data) | ||||||||||||||||||||||||||||||||||||||||||||||
| - [Spearman Rank Correlation] [Spearman Rank Cor...] [2017-12-15 08:14:59] [ec3e05fa52755d2406325c662ce6a84e] [Current] | ||||||||||||||||||||||||||||||||||||||||||||||
| Feedback Forum | ||||||||||||||||||||||||||||||||||||||||||||||
Post a new message | ||||||||||||||||||||||||||||||||||||||||||||||
Dataset | ||||||||||||||||||||||||||||||||||||||||||||||
| Dataseries X: | ||||||||||||||||||||||||||||||||||||||||||||||
4 5 5 3 5 5 5 4 4 4 4 3 4 4 4 4 4 5 5 4 4 2 4 4 4 4 3 4 3 4 5 4 4 5 5 4 3 4 4 4 4 4 4 4 4 2 4 3 5 4 4 2 3 4 4 4 5 4 2 5 3 3 3 5 4 4 4 4 5 3 2 3 5 5 4 2 3 4 4 4 4 4 4 4 5 4 4 4 3 4 4 4 4 4 3 3 5 2 3 4 4 4 3 2 5 4 3 4 3 5 1 1 4 4 4 4 5 3 2 4 4 5 2 2 2 3 5 5 2 3 3 3 4 2 4 5 4 3 2 4 2 4 5 4 3 2 4 5 4 4 4 4 2 4 4 5 3 4 5 2 3 3 1 2 2 4 4 4 2 4 4 4 4 4 4 3 4 3 4 3 4 2 2 4 4 4 4 5 3 4 4 4 2 2 2 2 3 4 4 3 4 2 2 5 3 4 3 5 3 4 4 2 4 3 4 4 4 4 2 4 4 2 4 4 3 3 4 4 2 5 4 2 4 4 4 4 4 4 3 4 4 3 4 2 5 2 2 2 4 4 3 5 5 1 3 4 3 2 2 2 1 3 4 4 5 4 5 2 4 3 3 2 5 5 4 2 3 4 3 3 2 3 4 5 2 2 3 4 3 3 4 5 4 4 4 3 4 2 5 4 4 3 3 3 3 3 5 4 4 3 2 3 3 4 4 3 4 2 4 5 4 4 3 4 3 3 4 5 4 4 4 3 4 3 4 3 4 5 3 2 2 2 4 3 2 4 3 3 5 5 5 5 4 4 4 5 4 3 2 4 3 3 4 1 3 3 2 3 3 5 3 3 5 3 4 4 3 3 4 4 3 3 4 5 4 3 4 4 3 3 4 4 3 5 4 3 4 3 3 2 4 3 4 4 3 4 1 4 4 5 2 3 2 3 4 3 3 3 2 4 2 4 4 3 3 4 4 3 4 5 4 2 3 4 5 2 3 5 4 3 4 3 2 4 4 4 | ||||||||||||||||||||||||||||||||||||||||||||||
| Dataseries Y: | ||||||||||||||||||||||||||||||||||||||||||||||
4 4 4 5 4 4 4 5 3 5 4 4 3 3 5 4 4 4 5 3 4 3 2 4 3 4 5 4 4 4 5 4 1 2 4 3 1 3 4 3 5 4 3 4 3 3 4 5 4 3 5 3 5 4 3 5 4 4 3 5 4 4 4 4 2 4 3 4 5 4 3 2 4 5 4 3 3 4 1 3 4 4 4 5 4 4 5 3 3 4 3 4 5 2 2 3 5 2 4 4 5 4 5 4 4 5 4 4 3 4 2 1 2 2 5 4 5 2 3 4 4 4 1 2 2 4 5 3 4 3 2 4 3 3 3 5 5 3 1 4 2 3 5 4 3 1 2 5 4 3 4 3 3 5 4 5 4 4 5 2 3 4 1 3 3 4 4 2 2 4 4 5 3 2 2 4 4 4 3 5 4 3 4 4 4 4 3 4 4 4 4 4 4 1 4 4 4 3 5 4 5 3 2 5 4 3 2 4 4 4 4 1 4 4 2 3 4 3 3 5 3 3 3 4 4 4 1 4 2 5 3 3 4 4 4 4 4 4 4 4 4 5 5 1 4 1 2 2 5 5 3 5 5 1 4 4 3 2 2 2 3 3 4 4 3 3 3 5 4 4 4 3 5 4 4 4 3 5 5 4 2 2 4 5 5 4 3 5 4 3 4 4 4 4 3 4 4 2 4 4 4 4 3 3 4 4 4 5 4 4 4 3 5 4 3 5 4 4 4 4 4 3 4 5 1 3 4 4 4 4 3 5 5 5 4 4 3 5 3 1 1 1 2 1 3 4 4 3 5 4 4 5 4 2 3 4 3 2 3 4 4 4 4 2 3 2 2 5 4 5 4 2 4 2 4 5 4 2 4 5 3 4 5 5 3 1 4 3 3 4 4 4 4 4 4 4 2 3 1 3 4 2 4 4 3 5 1 4 3 3 2 2 3 3 5 3 5 2 2 3 1 4 4 3 2 3 4 2 5 5 4 3 2 2 4 4 3 5 4 3 3 3 4 5 3 3 | ||||||||||||||||||||||||||||||||||||||||||||||
Tables (Output of Computation) | ||||||||||||||||||||||||||||||||||||||||||||||
| ||||||||||||||||||||||||||||||||||||||||||||||
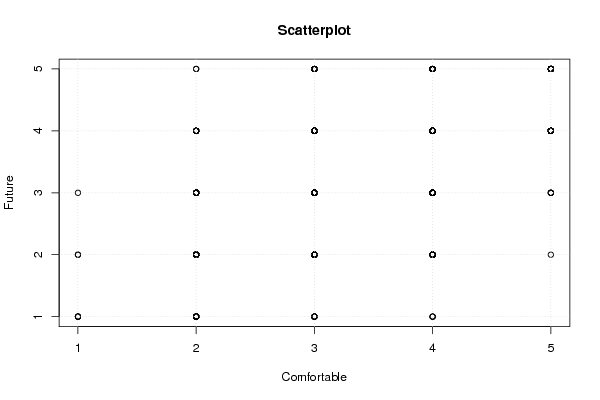
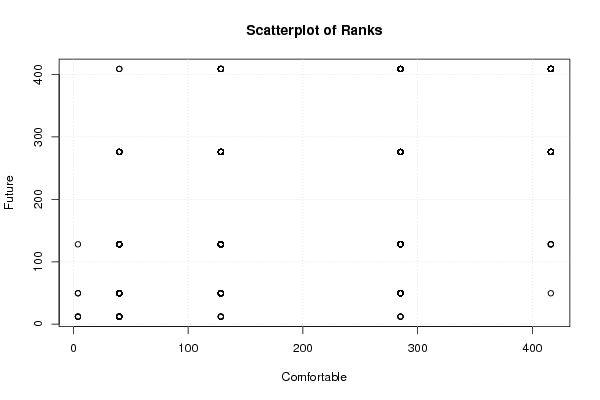
Figures (Output of Computation) | ||||||||||||||||||||||||||||||||||||||||||||||
Input Parameters & R Code | ||||||||||||||||||||||||||||||||||||||||||||||
| Parameters (Session): | ||||||||||||||||||||||||||||||||||||||||||||||
| Parameters (R input): | ||||||||||||||||||||||||||||||||||||||||||||||
| R code (references can be found in the software module): | ||||||||||||||||||||||||||||||||||||||||||||||
k <- cor.test(x,y,method='spearman') | ||||||||||||||||||||||||||||||||||||||||||||||