Free Statistics

of Irreproducible Research!

Author's title

Author*The author of this computation has been verified*
R Software Modulerwasp_autocorrelation.wasp
Title produced by software(Partial) Autocorrelation Function
Date of computationThu, 14 Dec 2017 22:11:53 +0100
Cite this page as followsStatistical Computations at FreeStatistics.org, Office for Research Development and Education, URL https://freestatistics.org/blog/index.php?v=date/2017/Dec/14/t1513286434l8i1qt95hh7y23t.htm/, Retrieved Tue, 14 May 2024 23:58:07 +0000
Statistical Computations at FreeStatistics.org, Office for Research Development and Education, URL https://freestatistics.org/blog/index.php?pk=309590, Retrieved Tue, 14 May 2024 23:58:07 +0000
QR Codes:

Original text written by user:
IsPrivate?No (this computation is public)
User-defined keywords
Estimated Impact77
Family? (F = Feedback message, R = changed R code, M = changed R Module, P = changed Parameters, D = changed Data)
-       [(Partial) Autocorrelation Function] [Dataset_3_ACF] [2017-12-14 21:11:53] [453a4fcb74c301cf89bf197d0ef2c60e] [Current]
Feedback Forum

Post a new message
Dataseries X:
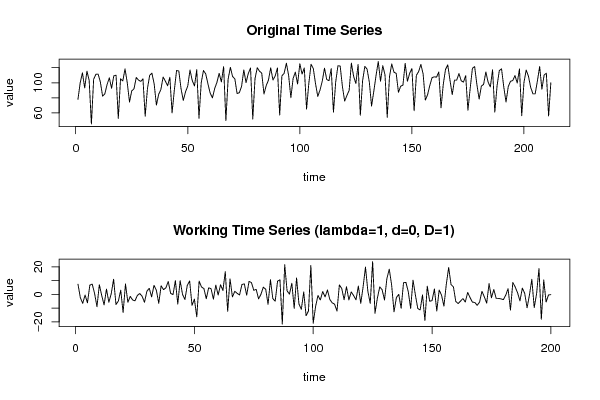
78
100.1
113.2
93.1
115.4
103.3
45.1
104.7
111.3
111.5
100.9
82.1
85.4
97.7
106.6
92.6
109.2
110
52.5
105.3
102.3
118.5
100
74.4
89.2
91.9
107
103.6
101.8
105.1
55.5
92.1
109.8
112.7
98.5
70.3
84.5
91.1
107.6
102.2
96
107.3
59.9
90.2
116.3
115.6
92
76.5
87.9
95.8
116.9
102.9
95.8
117.3
52.8
100.1
116.3
111.8
98.5
86.2
79.9
92.3
100.5
112.5
101.1
121.5
49.6
104.8
120.4
108.3
105.2
85.7
86.8
95.1
117
100.1
112.3
119.6
51.8
105.5
119.9
115.4
112.8
85.1
96.2
103.6
119.9
103.7
109
119.6
57
109.2
112.6
126
109.7
80.1
105.8
114.1
98.3
125.3
111.6
119.7
65
99
124.5
119
98.8
81.8
90.3
102
119.3
104.3
102.8
118.8
60.9
101
122.6
122.2
95
75.6
83.1
89.8
126.1
108.6
98.9
124.3
56.8
102.7
121.7
118.2
101
69
88.6
109.6
128.2
102
122.7
110.5
54
108.1
125
114.1
112.4
87.3
95.4
96.9
125.8
102
112.5
118.9
62.7
110
114.7
124.4
111.9
77
84.1
96.5
106.8
107.9
107.5
114.3
66.6
97.9
117.8
123.8
103.3
84.2
103.6
103.6
112.2
102.7
100.8
109.4
63.5
92.3
119.2
121.5
97.6
78.3
95.6
97.9
114.4
100.9
94.4
117.2
61
95.8
116.2
118.5
94.3
74.4
94.9
102
102.9
109.5
99.7
118.3
56.2
100.3
116.9
108.7
93.9
85.3
85.3
102.4
121.6
91.4
110.2
112.7
55.7
100.1


Summary of computational transaction
Raw Input view raw input (R code)
Raw Outputview raw output of R engine
Computing time2 seconds
R ServerBig Analytics Cloud Computing Center

\begin{tabular}{lllllllll}
\hline
Summary of computational transaction \tabularnewline
Raw Input view raw input (R code)  \tabularnewline
Raw Outputview raw output of R engine  \tabularnewline
Computing time2 seconds \tabularnewline
R ServerBig Analytics Cloud Computing Center \tabularnewline
\hline
\end{tabular}
%Source: https://freestatistics.org/blog/index.php?pk=309590&T=0

[TABLE]
[ROW]
Summary of computational transaction[/C][/ROW] [ROW]Raw Input[/C] view raw input (R code) [/C][/ROW] [ROW]Raw Output[/C]view raw output of R engine [/C][/ROW] [ROW]Computing time[/C]2 seconds[/C][/ROW] [ROW]R Server[/C]Big Analytics Cloud Computing Center[/C][/ROW] [/TABLE] Source: https://freestatistics.org/blog/index.php?pk=309590&T=0

Globally Unique Identifier (entire table): ba.freestatistics.org/blog/index.php?pk=309590&T=0

As an alternative you can also use a QR Code:  

The GUIDs for individual cells are displayed in the table below:

Summary of computational transaction
Raw Input view raw input (R code)
Raw Outputview raw output of R engine
Computing time2 seconds
R ServerBig Analytics Cloud Computing Center


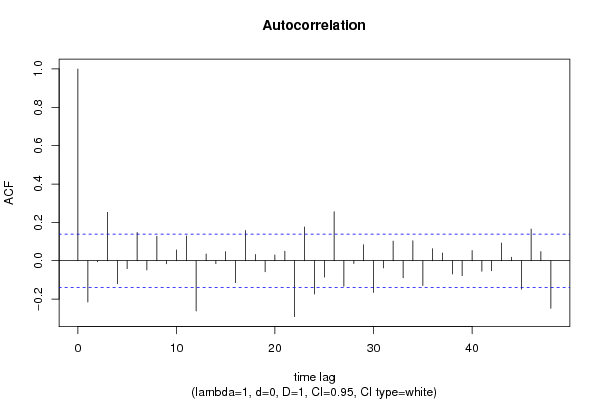
Autocorrelation Function
Time lag kACF(k)T-STATP-value
1-0.215149-3.04270.00133
2-0.00573-0.0810.467747
30.2522813.56780.000225
4-0.119608-1.69150.046148
5-0.041063-0.58070.281041
60.1476532.08810.019026
7-0.047878-0.67710.249565
80.1274651.80260.036476
9-0.015819-0.22370.411605
100.0558260.78950.215379
110.1293751.82960.034396
12-0.262409-3.7110.000134
130.0349960.49490.310603
14-0.015219-0.21520.414906
150.0473480.66960.25194
16-0.114252-1.61580.05386
170.1579612.23390.013298
180.0323620.45770.323844
19-0.057825-0.81780.207233
200.0298510.42220.336682
210.0493360.69770.243084
22-0.291551-4.12322.7e-05
230.1760272.48940.006806
24-0.173859-2.45870.007396
25-0.08533-1.20670.114478
260.2556943.61610.000189
27-0.132725-1.8770.030986
28-0.01474-0.20850.417545
290.0830131.1740.1209
30-0.165537-2.3410.010107
31-0.037363-0.52840.298907
320.1023091.44690.07475
33-0.088505-1.25160.106081
340.104661.48010.070207
35-0.12928-1.82830.034498
360.0624820.88360.18898
370.0402860.56970.28475
38-0.068948-0.97510.165352
39-0.077861-1.10110.136083
400.0526780.7450.228577
41-0.055163-0.78010.21812
42-0.052291-0.73950.230232
430.0918941.29960.097621
440.0182320.25780.3984
45-0.148222-2.09620.018662
460.1647462.32990.010406
470.0474720.67140.251385
48-0.247394-3.49870.000288

\begin{tabular}{lllllllll}
\hline
Autocorrelation Function \tabularnewline
Time lag k & ACF(k) & T-STAT & P-value \tabularnewline
1 & -0.215149 & -3.0427 & 0.00133 \tabularnewline
2 & -0.00573 & -0.081 & 0.467747 \tabularnewline
3 & 0.252281 & 3.5678 & 0.000225 \tabularnewline
4 & -0.119608 & -1.6915 & 0.046148 \tabularnewline
5 & -0.041063 & -0.5807 & 0.281041 \tabularnewline
6 & 0.147653 & 2.0881 & 0.019026 \tabularnewline
7 & -0.047878 & -0.6771 & 0.249565 \tabularnewline
8 & 0.127465 & 1.8026 & 0.036476 \tabularnewline
9 & -0.015819 & -0.2237 & 0.411605 \tabularnewline
10 & 0.055826 & 0.7895 & 0.215379 \tabularnewline
11 & 0.129375 & 1.8296 & 0.034396 \tabularnewline
12 & -0.262409 & -3.711 & 0.000134 \tabularnewline
13 & 0.034996 & 0.4949 & 0.310603 \tabularnewline
14 & -0.015219 & -0.2152 & 0.414906 \tabularnewline
15 & 0.047348 & 0.6696 & 0.25194 \tabularnewline
16 & -0.114252 & -1.6158 & 0.05386 \tabularnewline
17 & 0.157961 & 2.2339 & 0.013298 \tabularnewline
18 & 0.032362 & 0.4577 & 0.323844 \tabularnewline
19 & -0.057825 & -0.8178 & 0.207233 \tabularnewline
20 & 0.029851 & 0.4222 & 0.336682 \tabularnewline
21 & 0.049336 & 0.6977 & 0.243084 \tabularnewline
22 & -0.291551 & -4.1232 & 2.7e-05 \tabularnewline
23 & 0.176027 & 2.4894 & 0.006806 \tabularnewline
24 & -0.173859 & -2.4587 & 0.007396 \tabularnewline
25 & -0.08533 & -1.2067 & 0.114478 \tabularnewline
26 & 0.255694 & 3.6161 & 0.000189 \tabularnewline
27 & -0.132725 & -1.877 & 0.030986 \tabularnewline
28 & -0.01474 & -0.2085 & 0.417545 \tabularnewline
29 & 0.083013 & 1.174 & 0.1209 \tabularnewline
30 & -0.165537 & -2.341 & 0.010107 \tabularnewline
31 & -0.037363 & -0.5284 & 0.298907 \tabularnewline
32 & 0.102309 & 1.4469 & 0.07475 \tabularnewline
33 & -0.088505 & -1.2516 & 0.106081 \tabularnewline
34 & 0.10466 & 1.4801 & 0.070207 \tabularnewline
35 & -0.12928 & -1.8283 & 0.034498 \tabularnewline
36 & 0.062482 & 0.8836 & 0.18898 \tabularnewline
37 & 0.040286 & 0.5697 & 0.28475 \tabularnewline
38 & -0.068948 & -0.9751 & 0.165352 \tabularnewline
39 & -0.077861 & -1.1011 & 0.136083 \tabularnewline
40 & 0.052678 & 0.745 & 0.228577 \tabularnewline
41 & -0.055163 & -0.7801 & 0.21812 \tabularnewline
42 & -0.052291 & -0.7395 & 0.230232 \tabularnewline
43 & 0.091894 & 1.2996 & 0.097621 \tabularnewline
44 & 0.018232 & 0.2578 & 0.3984 \tabularnewline
45 & -0.148222 & -2.0962 & 0.018662 \tabularnewline
46 & 0.164746 & 2.3299 & 0.010406 \tabularnewline
47 & 0.047472 & 0.6714 & 0.251385 \tabularnewline
48 & -0.247394 & -3.4987 & 0.000288 \tabularnewline
\hline
\end{tabular}
%Source: https://freestatistics.org/blog/index.php?pk=309590&T=1

[TABLE]
[ROW][C]Autocorrelation Function[/C][/ROW]
[ROW][C]Time lag k[/C][C]ACF(k)[/C][C]T-STAT[/C][C]P-value[/C][/ROW]
[ROW][C]1[/C][C]-0.215149[/C][C]-3.0427[/C][C]0.00133[/C][/ROW]
[ROW][C]2[/C][C]-0.00573[/C][C]-0.081[/C][C]0.467747[/C][/ROW]
[ROW][C]3[/C][C]0.252281[/C][C]3.5678[/C][C]0.000225[/C][/ROW]
[ROW][C]4[/C][C]-0.119608[/C][C]-1.6915[/C][C]0.046148[/C][/ROW]
[ROW][C]5[/C][C]-0.041063[/C][C]-0.5807[/C][C]0.281041[/C][/ROW]
[ROW][C]6[/C][C]0.147653[/C][C]2.0881[/C][C]0.019026[/C][/ROW]
[ROW][C]7[/C][C]-0.047878[/C][C]-0.6771[/C][C]0.249565[/C][/ROW]
[ROW][C]8[/C][C]0.127465[/C][C]1.8026[/C][C]0.036476[/C][/ROW]
[ROW][C]9[/C][C]-0.015819[/C][C]-0.2237[/C][C]0.411605[/C][/ROW]
[ROW][C]10[/C][C]0.055826[/C][C]0.7895[/C][C]0.215379[/C][/ROW]
[ROW][C]11[/C][C]0.129375[/C][C]1.8296[/C][C]0.034396[/C][/ROW]
[ROW][C]12[/C][C]-0.262409[/C][C]-3.711[/C][C]0.000134[/C][/ROW]
[ROW][C]13[/C][C]0.034996[/C][C]0.4949[/C][C]0.310603[/C][/ROW]
[ROW][C]14[/C][C]-0.015219[/C][C]-0.2152[/C][C]0.414906[/C][/ROW]
[ROW][C]15[/C][C]0.047348[/C][C]0.6696[/C][C]0.25194[/C][/ROW]
[ROW][C]16[/C][C]-0.114252[/C][C]-1.6158[/C][C]0.05386[/C][/ROW]
[ROW][C]17[/C][C]0.157961[/C][C]2.2339[/C][C]0.013298[/C][/ROW]
[ROW][C]18[/C][C]0.032362[/C][C]0.4577[/C][C]0.323844[/C][/ROW]
[ROW][C]19[/C][C]-0.057825[/C][C]-0.8178[/C][C]0.207233[/C][/ROW]
[ROW][C]20[/C][C]0.029851[/C][C]0.4222[/C][C]0.336682[/C][/ROW]
[ROW][C]21[/C][C]0.049336[/C][C]0.6977[/C][C]0.243084[/C][/ROW]
[ROW][C]22[/C][C]-0.291551[/C][C]-4.1232[/C][C]2.7e-05[/C][/ROW]
[ROW][C]23[/C][C]0.176027[/C][C]2.4894[/C][C]0.006806[/C][/ROW]
[ROW][C]24[/C][C]-0.173859[/C][C]-2.4587[/C][C]0.007396[/C][/ROW]
[ROW][C]25[/C][C]-0.08533[/C][C]-1.2067[/C][C]0.114478[/C][/ROW]
[ROW][C]26[/C][C]0.255694[/C][C]3.6161[/C][C]0.000189[/C][/ROW]
[ROW][C]27[/C][C]-0.132725[/C][C]-1.877[/C][C]0.030986[/C][/ROW]
[ROW][C]28[/C][C]-0.01474[/C][C]-0.2085[/C][C]0.417545[/C][/ROW]
[ROW][C]29[/C][C]0.083013[/C][C]1.174[/C][C]0.1209[/C][/ROW]
[ROW][C]30[/C][C]-0.165537[/C][C]-2.341[/C][C]0.010107[/C][/ROW]
[ROW][C]31[/C][C]-0.037363[/C][C]-0.5284[/C][C]0.298907[/C][/ROW]
[ROW][C]32[/C][C]0.102309[/C][C]1.4469[/C][C]0.07475[/C][/ROW]
[ROW][C]33[/C][C]-0.088505[/C][C]-1.2516[/C][C]0.106081[/C][/ROW]
[ROW][C]34[/C][C]0.10466[/C][C]1.4801[/C][C]0.070207[/C][/ROW]
[ROW][C]35[/C][C]-0.12928[/C][C]-1.8283[/C][C]0.034498[/C][/ROW]
[ROW][C]36[/C][C]0.062482[/C][C]0.8836[/C][C]0.18898[/C][/ROW]
[ROW][C]37[/C][C]0.040286[/C][C]0.5697[/C][C]0.28475[/C][/ROW]
[ROW][C]38[/C][C]-0.068948[/C][C]-0.9751[/C][C]0.165352[/C][/ROW]
[ROW][C]39[/C][C]-0.077861[/C][C]-1.1011[/C][C]0.136083[/C][/ROW]
[ROW][C]40[/C][C]0.052678[/C][C]0.745[/C][C]0.228577[/C][/ROW]
[ROW][C]41[/C][C]-0.055163[/C][C]-0.7801[/C][C]0.21812[/C][/ROW]
[ROW][C]42[/C][C]-0.052291[/C][C]-0.7395[/C][C]0.230232[/C][/ROW]
[ROW][C]43[/C][C]0.091894[/C][C]1.2996[/C][C]0.097621[/C][/ROW]
[ROW][C]44[/C][C]0.018232[/C][C]0.2578[/C][C]0.3984[/C][/ROW]
[ROW][C]45[/C][C]-0.148222[/C][C]-2.0962[/C][C]0.018662[/C][/ROW]
[ROW][C]46[/C][C]0.164746[/C][C]2.3299[/C][C]0.010406[/C][/ROW]
[ROW][C]47[/C][C]0.047472[/C][C]0.6714[/C][C]0.251385[/C][/ROW]
[ROW][C]48[/C][C]-0.247394[/C][C]-3.4987[/C][C]0.000288[/C][/ROW]
[/TABLE]
Source: https://freestatistics.org/blog/index.php?pk=309590&T=1

Globally Unique Identifier (entire table): ba.freestatistics.org/blog/index.php?pk=309590&T=1

As an alternative you can also use a QR Code:  

The GUIDs for individual cells are displayed in the table below:

Autocorrelation Function
Time lag kACF(k)T-STATP-value
1-0.215149-3.04270.00133
2-0.00573-0.0810.467747
30.2522813.56780.000225
4-0.119608-1.69150.046148
5-0.041063-0.58070.281041
60.1476532.08810.019026
7-0.047878-0.67710.249565
80.1274651.80260.036476
9-0.015819-0.22370.411605
100.0558260.78950.215379
110.1293751.82960.034396
12-0.262409-3.7110.000134
130.0349960.49490.310603
14-0.015219-0.21520.414906
150.0473480.66960.25194
16-0.114252-1.61580.05386
170.1579612.23390.013298
180.0323620.45770.323844
19-0.057825-0.81780.207233
200.0298510.42220.336682
210.0493360.69770.243084
22-0.291551-4.12322.7e-05
230.1760272.48940.006806
24-0.173859-2.45870.007396
25-0.08533-1.20670.114478
260.2556943.61610.000189
27-0.132725-1.8770.030986
28-0.01474-0.20850.417545
290.0830131.1740.1209
30-0.165537-2.3410.010107
31-0.037363-0.52840.298907
320.1023091.44690.07475
33-0.088505-1.25160.106081
340.104661.48010.070207
35-0.12928-1.82830.034498
360.0624820.88360.18898
370.0402860.56970.28475
38-0.068948-0.97510.165352
39-0.077861-1.10110.136083
400.0526780.7450.228577
41-0.055163-0.78010.21812
42-0.052291-0.73950.230232
430.0918941.29960.097621
440.0182320.25780.3984
45-0.148222-2.09620.018662
460.1647462.32990.010406
470.0474720.67140.251385
48-0.247394-3.49870.000288


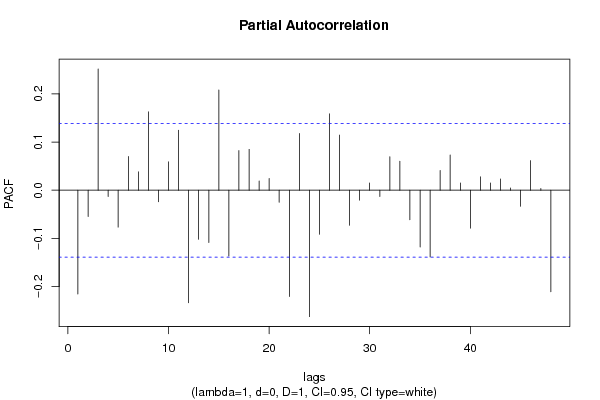
Partial Autocorrelation Function
Time lag kPACF(k)T-STATP-value
1-0.215149-3.04270.00133
2-0.054544-0.77140.220699
30.2516073.55830.000233
4-0.013118-0.18550.426505
5-0.076596-1.08320.140006
60.0701620.99220.16114
70.0381620.53970.295005
80.1625132.29830.01129
9-0.023746-0.33580.36868
100.0589230.83330.202835
110.124331.75830.040113
12-0.233534-3.30270.000567
13-0.101874-1.44070.075615
14-0.108447-1.53370.063346
150.2080332.9420.001823
16-0.136297-1.92750.027665
170.0822151.16270.123169
180.0847161.19810.116154
190.0192930.27280.392626
200.0243170.34390.365645
21-0.024997-0.35350.362039
22-0.220585-3.11950.001039
230.1177311.6650.048743
24-0.262275-3.70910.000135
25-0.091238-1.29030.099217
260.1584042.24020.01309
270.1143751.61750.053673
28-0.072513-1.02550.153186
29-0.020597-0.29130.385565
300.0150560.21290.415801
31-0.013074-0.18490.42675
320.0696240.98460.162996
330.0600920.84980.198216
34-0.061146-0.86470.194109
35-0.117683-1.66430.048811
36-0.138316-1.95610.025924
370.0411160.58150.28079
380.0731141.0340.151195
390.0148570.21010.416899
40-0.078686-1.11280.133568
410.02770.39170.347834
420.0149370.21120.416458
430.0232430.32870.371362
440.0045470.06430.474395
45-0.033259-0.47040.319305
460.06140.86830.193128
470.0034370.04860.480643
48-0.210681-2.97950.001623

\begin{tabular}{lllllllll}
\hline
Partial Autocorrelation Function \tabularnewline
Time lag k & PACF(k) & T-STAT & P-value \tabularnewline
1 & -0.215149 & -3.0427 & 0.00133 \tabularnewline
2 & -0.054544 & -0.7714 & 0.220699 \tabularnewline
3 & 0.251607 & 3.5583 & 0.000233 \tabularnewline
4 & -0.013118 & -0.1855 & 0.426505 \tabularnewline
5 & -0.076596 & -1.0832 & 0.140006 \tabularnewline
6 & 0.070162 & 0.9922 & 0.16114 \tabularnewline
7 & 0.038162 & 0.5397 & 0.295005 \tabularnewline
8 & 0.162513 & 2.2983 & 0.01129 \tabularnewline
9 & -0.023746 & -0.3358 & 0.36868 \tabularnewline
10 & 0.058923 & 0.8333 & 0.202835 \tabularnewline
11 & 0.12433 & 1.7583 & 0.040113 \tabularnewline
12 & -0.233534 & -3.3027 & 0.000567 \tabularnewline
13 & -0.101874 & -1.4407 & 0.075615 \tabularnewline
14 & -0.108447 & -1.5337 & 0.063346 \tabularnewline
15 & 0.208033 & 2.942 & 0.001823 \tabularnewline
16 & -0.136297 & -1.9275 & 0.027665 \tabularnewline
17 & 0.082215 & 1.1627 & 0.123169 \tabularnewline
18 & 0.084716 & 1.1981 & 0.116154 \tabularnewline
19 & 0.019293 & 0.2728 & 0.392626 \tabularnewline
20 & 0.024317 & 0.3439 & 0.365645 \tabularnewline
21 & -0.024997 & -0.3535 & 0.362039 \tabularnewline
22 & -0.220585 & -3.1195 & 0.001039 \tabularnewline
23 & 0.117731 & 1.665 & 0.048743 \tabularnewline
24 & -0.262275 & -3.7091 & 0.000135 \tabularnewline
25 & -0.091238 & -1.2903 & 0.099217 \tabularnewline
26 & 0.158404 & 2.2402 & 0.01309 \tabularnewline
27 & 0.114375 & 1.6175 & 0.053673 \tabularnewline
28 & -0.072513 & -1.0255 & 0.153186 \tabularnewline
29 & -0.020597 & -0.2913 & 0.385565 \tabularnewline
30 & 0.015056 & 0.2129 & 0.415801 \tabularnewline
31 & -0.013074 & -0.1849 & 0.42675 \tabularnewline
32 & 0.069624 & 0.9846 & 0.162996 \tabularnewline
33 & 0.060092 & 0.8498 & 0.198216 \tabularnewline
34 & -0.061146 & -0.8647 & 0.194109 \tabularnewline
35 & -0.117683 & -1.6643 & 0.048811 \tabularnewline
36 & -0.138316 & -1.9561 & 0.025924 \tabularnewline
37 & 0.041116 & 0.5815 & 0.28079 \tabularnewline
38 & 0.073114 & 1.034 & 0.151195 \tabularnewline
39 & 0.014857 & 0.2101 & 0.416899 \tabularnewline
40 & -0.078686 & -1.1128 & 0.133568 \tabularnewline
41 & 0.0277 & 0.3917 & 0.347834 \tabularnewline
42 & 0.014937 & 0.2112 & 0.416458 \tabularnewline
43 & 0.023243 & 0.3287 & 0.371362 \tabularnewline
44 & 0.004547 & 0.0643 & 0.474395 \tabularnewline
45 & -0.033259 & -0.4704 & 0.319305 \tabularnewline
46 & 0.0614 & 0.8683 & 0.193128 \tabularnewline
47 & 0.003437 & 0.0486 & 0.480643 \tabularnewline
48 & -0.210681 & -2.9795 & 0.001623 \tabularnewline
\hline
\end{tabular}
%Source: https://freestatistics.org/blog/index.php?pk=309590&T=2

[TABLE]
[ROW][C]Partial Autocorrelation Function[/C][/ROW]
[ROW][C]Time lag k[/C][C]PACF(k)[/C][C]T-STAT[/C][C]P-value[/C][/ROW]
[ROW][C]1[/C][C]-0.215149[/C][C]-3.0427[/C][C]0.00133[/C][/ROW]
[ROW][C]2[/C][C]-0.054544[/C][C]-0.7714[/C][C]0.220699[/C][/ROW]
[ROW][C]3[/C][C]0.251607[/C][C]3.5583[/C][C]0.000233[/C][/ROW]
[ROW][C]4[/C][C]-0.013118[/C][C]-0.1855[/C][C]0.426505[/C][/ROW]
[ROW][C]5[/C][C]-0.076596[/C][C]-1.0832[/C][C]0.140006[/C][/ROW]
[ROW][C]6[/C][C]0.070162[/C][C]0.9922[/C][C]0.16114[/C][/ROW]
[ROW][C]7[/C][C]0.038162[/C][C]0.5397[/C][C]0.295005[/C][/ROW]
[ROW][C]8[/C][C]0.162513[/C][C]2.2983[/C][C]0.01129[/C][/ROW]
[ROW][C]9[/C][C]-0.023746[/C][C]-0.3358[/C][C]0.36868[/C][/ROW]
[ROW][C]10[/C][C]0.058923[/C][C]0.8333[/C][C]0.202835[/C][/ROW]
[ROW][C]11[/C][C]0.12433[/C][C]1.7583[/C][C]0.040113[/C][/ROW]
[ROW][C]12[/C][C]-0.233534[/C][C]-3.3027[/C][C]0.000567[/C][/ROW]
[ROW][C]13[/C][C]-0.101874[/C][C]-1.4407[/C][C]0.075615[/C][/ROW]
[ROW][C]14[/C][C]-0.108447[/C][C]-1.5337[/C][C]0.063346[/C][/ROW]
[ROW][C]15[/C][C]0.208033[/C][C]2.942[/C][C]0.001823[/C][/ROW]
[ROW][C]16[/C][C]-0.136297[/C][C]-1.9275[/C][C]0.027665[/C][/ROW]
[ROW][C]17[/C][C]0.082215[/C][C]1.1627[/C][C]0.123169[/C][/ROW]
[ROW][C]18[/C][C]0.084716[/C][C]1.1981[/C][C]0.116154[/C][/ROW]
[ROW][C]19[/C][C]0.019293[/C][C]0.2728[/C][C]0.392626[/C][/ROW]
[ROW][C]20[/C][C]0.024317[/C][C]0.3439[/C][C]0.365645[/C][/ROW]
[ROW][C]21[/C][C]-0.024997[/C][C]-0.3535[/C][C]0.362039[/C][/ROW]
[ROW][C]22[/C][C]-0.220585[/C][C]-3.1195[/C][C]0.001039[/C][/ROW]
[ROW][C]23[/C][C]0.117731[/C][C]1.665[/C][C]0.048743[/C][/ROW]
[ROW][C]24[/C][C]-0.262275[/C][C]-3.7091[/C][C]0.000135[/C][/ROW]
[ROW][C]25[/C][C]-0.091238[/C][C]-1.2903[/C][C]0.099217[/C][/ROW]
[ROW][C]26[/C][C]0.158404[/C][C]2.2402[/C][C]0.01309[/C][/ROW]
[ROW][C]27[/C][C]0.114375[/C][C]1.6175[/C][C]0.053673[/C][/ROW]
[ROW][C]28[/C][C]-0.072513[/C][C]-1.0255[/C][C]0.153186[/C][/ROW]
[ROW][C]29[/C][C]-0.020597[/C][C]-0.2913[/C][C]0.385565[/C][/ROW]
[ROW][C]30[/C][C]0.015056[/C][C]0.2129[/C][C]0.415801[/C][/ROW]
[ROW][C]31[/C][C]-0.013074[/C][C]-0.1849[/C][C]0.42675[/C][/ROW]
[ROW][C]32[/C][C]0.069624[/C][C]0.9846[/C][C]0.162996[/C][/ROW]
[ROW][C]33[/C][C]0.060092[/C][C]0.8498[/C][C]0.198216[/C][/ROW]
[ROW][C]34[/C][C]-0.061146[/C][C]-0.8647[/C][C]0.194109[/C][/ROW]
[ROW][C]35[/C][C]-0.117683[/C][C]-1.6643[/C][C]0.048811[/C][/ROW]
[ROW][C]36[/C][C]-0.138316[/C][C]-1.9561[/C][C]0.025924[/C][/ROW]
[ROW][C]37[/C][C]0.041116[/C][C]0.5815[/C][C]0.28079[/C][/ROW]
[ROW][C]38[/C][C]0.073114[/C][C]1.034[/C][C]0.151195[/C][/ROW]
[ROW][C]39[/C][C]0.014857[/C][C]0.2101[/C][C]0.416899[/C][/ROW]
[ROW][C]40[/C][C]-0.078686[/C][C]-1.1128[/C][C]0.133568[/C][/ROW]
[ROW][C]41[/C][C]0.0277[/C][C]0.3917[/C][C]0.347834[/C][/ROW]
[ROW][C]42[/C][C]0.014937[/C][C]0.2112[/C][C]0.416458[/C][/ROW]
[ROW][C]43[/C][C]0.023243[/C][C]0.3287[/C][C]0.371362[/C][/ROW]
[ROW][C]44[/C][C]0.004547[/C][C]0.0643[/C][C]0.474395[/C][/ROW]
[ROW][C]45[/C][C]-0.033259[/C][C]-0.4704[/C][C]0.319305[/C][/ROW]
[ROW][C]46[/C][C]0.0614[/C][C]0.8683[/C][C]0.193128[/C][/ROW]
[ROW][C]47[/C][C]0.003437[/C][C]0.0486[/C][C]0.480643[/C][/ROW]
[ROW][C]48[/C][C]-0.210681[/C][C]-2.9795[/C][C]0.001623[/C][/ROW]
[/TABLE]
Source: https://freestatistics.org/blog/index.php?pk=309590&T=2

Globally Unique Identifier (entire table): ba.freestatistics.org/blog/index.php?pk=309590&T=2

As an alternative you can also use a QR Code:  

The GUIDs for individual cells are displayed in the table below:

Partial Autocorrelation Function
Time lag kPACF(k)T-STATP-value
1-0.215149-3.04270.00133
2-0.054544-0.77140.220699
30.2516073.55830.000233
4-0.013118-0.18550.426505
5-0.076596-1.08320.140006
60.0701620.99220.16114
70.0381620.53970.295005
80.1625132.29830.01129
9-0.023746-0.33580.36868
100.0589230.83330.202835
110.124331.75830.040113
12-0.233534-3.30270.000567
13-0.101874-1.44070.075615
14-0.108447-1.53370.063346
150.2080332.9420.001823
16-0.136297-1.92750.027665
170.0822151.16270.123169
180.0847161.19810.116154
190.0192930.27280.392626
200.0243170.34390.365645
21-0.024997-0.35350.362039
22-0.220585-3.11950.001039
230.1177311.6650.048743
24-0.262275-3.70910.000135
25-0.091238-1.29030.099217
260.1584042.24020.01309
270.1143751.61750.053673
28-0.072513-1.02550.153186
29-0.020597-0.29130.385565
300.0150560.21290.415801
31-0.013074-0.18490.42675
320.0696240.98460.162996
330.0600920.84980.198216
34-0.061146-0.86470.194109
35-0.117683-1.66430.048811
36-0.138316-1.95610.025924
370.0411160.58150.28079
380.0731141.0340.151195
390.0148570.21010.416899
40-0.078686-1.11280.133568
410.02770.39170.347834
420.0149370.21120.416458
430.0232430.32870.371362
440.0045470.06430.474395
45-0.033259-0.47040.319305
460.06140.86830.193128
470.0034370.04860.480643
48-0.210681-2.97950.001623


Parameters (Session):
par1 = 0 ; par2 = no ; par3 = 512 ;
Parameters (R input):
par1 = 48 ; par2 = 1 ; par3 = 0 ; par4 = 1 ; par5 = 12 ; par6 = White Noise ; par7 = 0.95 ; par8 = ;
R code (references can be found in the software module):
par8 <- ''
par7 <- '0.95'
par6 <- 'White Noise'
par5 <- '12'
par4 <- '1'
par3 <- '1'
par2 <- '1'
par1 <- '48'
if (par1 == 'Default') {
par1 = 10*log10(length(x))
} else {
par1 <- as.numeric(par1)
}
par2 <- as.numeric(par2)
par3 <- as.numeric(par3)
par4 <- as.numeric(par4)
par5 <- as.numeric(par5)
if (par6 == 'White Noise') par6 <- 'white' else par6 <- 'ma'
par7 <- as.numeric(par7)
if (par8 != '') par8 <- as.numeric(par8)
x <- na.omit(x)
ox <- x
if (par8 == '') {
if (par2 == 0) {
x <- log(x)
} else {
x <- (x ^ par2 - 1) / par2
}
} else {
x <- log(x,base=par8)
}
if (par3 > 0) x <- diff(x,lag=1,difference=par3)
if (par4 > 0) x <- diff(x,lag=par5,difference=par4)
bitmap(file='picts.png')
op <- par(mfrow=c(2,1))
plot(ox,type='l',main='Original Time Series',xlab='time',ylab='value')
if (par8=='') {
mytitle <- paste('Working Time Series (lambda=',par2,', d=',par3,', D=',par4,')',sep='')
mysub <- paste('(lambda=',par2,', d=',par3,', D=',par4,', CI=', par7, ', CI type=',par6,')',sep='')
} else {
mytitle <- paste('Working Time Series (base=',par8,', d=',par3,', D=',par4,')',sep='')
mysub <- paste('(base=',par8,', d=',par3,', D=',par4,', CI=', par7, ', CI type=',par6,')',sep='')
}
plot(x,type='l', main=mytitle,xlab='time',ylab='value')
par(op)
dev.off()
bitmap(file='pic1.png')
racf <- acf(x, par1, main='Autocorrelation', xlab='time lag', ylab='ACF', ci.type=par6, ci=par7, sub=mysub)
dev.off()
bitmap(file='pic2.png')
rpacf <- pacf(x,par1,main='Partial Autocorrelation',xlab='lags',ylab='PACF',sub=mysub)
dev.off()
(myacf <- c(racf$acf))
(mypacf <- c(rpacf$acf))
lengthx <- length(x)
sqrtn <- sqrt(lengthx)
load(file='createtable')
a<-table.start()
a<-table.row.start(a)
a<-table.element(a,'Autocorrelation Function',4,TRUE)
a<-table.row.end(a)
a<-table.row.start(a)
a<-table.element(a,'Time lag k',header=TRUE)
a<-table.element(a,'ACF(k)',header=TRUE)
a<-table.element(a,'T-STAT',header=TRUE)
a<-table.element(a,'P-value',header=TRUE)
a<-table.row.end(a)
for (i in 2:(par1+1)) {
a<-table.row.start(a)
a<-table.element(a,i-1,header=TRUE)
a<-table.element(a,round(myacf[i],6))
mytstat <- myacf[i]*sqrtn
a<-table.element(a,round(mytstat,4))
a<-table.element(a,round(1-pt(abs(mytstat),lengthx),6))
a<-table.row.end(a)
}
a<-table.end(a)
table.save(a,file='mytable.tab')
a<-table.start()
a<-table.row.start(a)
a<-table.element(a,'Partial Autocorrelation Function',4,TRUE)
a<-table.row.end(a)
a<-table.row.start(a)
a<-table.element(a,'Time lag k',header=TRUE)
a<-table.element(a,'PACF(k)',header=TRUE)
a<-table.element(a,'T-STAT',header=TRUE)
a<-table.element(a,'P-value',header=TRUE)
a<-table.row.end(a)
for (i in 1:par1) {
a<-table.row.start(a)
a<-table.element(a,i,header=TRUE)
a<-table.element(a,round(mypacf[i],6))
mytstat <- mypacf[i]*sqrtn
a<-table.element(a,round(mytstat,4))
a<-table.element(a,round(1-pt(abs(mytstat),lengthx),6))
a<-table.row.end(a)
}
a<-table.end(a)
table.save(a,file='mytable1.tab')