Free Statistics

of Irreproducible Research!

Author's title

Author*The author of this computation has been verified*
R Software Modulerwasp_autocorrelation.wasp
Title produced by software(Partial) Autocorrelation Function
Date of computationThu, 14 Dec 2017 20:24:06 +0100
Cite this page as followsStatistical Computations at FreeStatistics.org, Office for Research Development and Education, URL https://freestatistics.org/blog/index.php?v=date/2017/Dec/14/t1513279664n8q7omzaasziu0s.htm/, Retrieved Tue, 14 May 2024 16:30:53 +0000
Statistical Computations at FreeStatistics.org, Office for Research Development and Education, URL https://freestatistics.org/blog/index.php?pk=309580, Retrieved Tue, 14 May 2024 16:30:53 +0000
QR Codes:

Original text written by user:
IsPrivate?No (this computation is public)
User-defined keywords
Estimated Impact93
Family? (F = Feedback message, R = changed R code, M = changed R Module, P = changed Parameters, D = changed Data)
-       [(Partial) Autocorrelation Function] [Autocorrelation (...] [2017-12-14 19:24:06] [1875a8389a5fbce5fbb96440e98cb252] [Current]
Feedback Forum

Post a new message
Dataseries X:
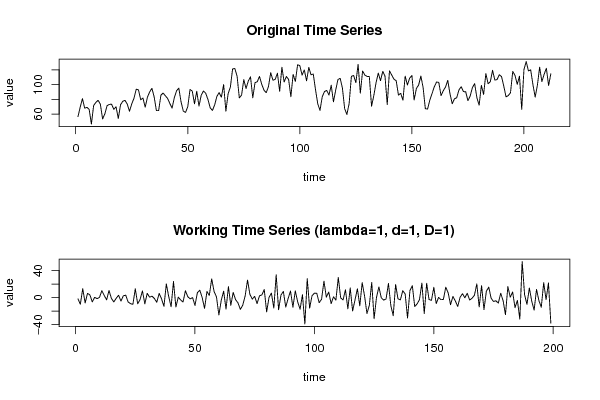
56.5
69.4
81
68
69.1
66.3
46.4
71.6
75.8
78.7
73.2
53.3
60.3
71.4
73.1
73.4
66.4
69.9
53.9
72.7
77.3
78.6
73.4
63.7
73.8
81.5
93.7
92.9
79.4
81.8
69.3
82.9
90.1
95
83.3
64.6
64.7
85.5
88.5
84.8
81.2
74.3
68.1
82.3
91.6
95.2
76.5
64
62.2
70
93.3
91.1
73.9
90.9
70.7
85.5
91.3
88.3
79.8
68.5
64.8
72.5
84.1
89.1
82.9
100.1
63.8
87.6
96.5
121.3
121.8
111.5
81.9
85.7
106.8
94.7
104.8
110.5
82
102.7
103.8
111.1
100.4
92.5
88.9
97.3
116.2
105.9
107.1
115.4
90.9
123.6
103.5
111
106.9
83.5
113.8
104.2
126.9
125.8
112.9
119.9
105.1
123.4
113.3
114.4
93
73.9
64.9
83.5
90.5
92.1
85.8
99.1
76.7
92.5
106.8
108.5
95.3
67.2
59.4
74.3
111.2
112.4
102.6
127.5
88.4
118.5
112.9
111.1
111
70.6
84.9
102.4
115.6
105.3
118
111.5
72.8
118.7
112.9
107.4
105.2
85.7
88.2
78.8
111.5
99.4
108.7
112.4
79.1
94.7
99.3
111.6
96.1
67.2
66.8
78.9
87.8
97
103.5
103
85
91.7
96.6
105.8
87.5
74
80.7
82.2
92.8
97.1
90.4
90.3
78.1
84.5
95.8
101.4
82.1
72
99
86.6
114.9
101.2
104
119.4
106.2
106.8
113.4
110.8
97.9
83.4
85
89
117.9
112.5
100.3
111.5
66.3
120.4
131.3
118.6
120
100.1
83
99.2
123.7
104
113.9
122.2
98.7
114.8


Summary of computational transaction
Raw Input view raw input (R code)
Raw Outputview raw output of R engine
Computing time2 seconds
R ServerBig Analytics Cloud Computing Center

\begin{tabular}{lllllllll}
\hline
Summary of computational transaction \tabularnewline
Raw Input view raw input (R code)  \tabularnewline
Raw Outputview raw output of R engine  \tabularnewline
Computing time2 seconds \tabularnewline
R ServerBig Analytics Cloud Computing Center \tabularnewline
\hline
\end{tabular}
%Source: https://freestatistics.org/blog/index.php?pk=309580&T=0

[TABLE]
[ROW]
Summary of computational transaction[/C][/ROW] [ROW]Raw Input[/C] view raw input (R code) [/C][/ROW] [ROW]Raw Output[/C]view raw output of R engine [/C][/ROW] [ROW]Computing time[/C]2 seconds[/C][/ROW] [ROW]R Server[/C]Big Analytics Cloud Computing Center[/C][/ROW] [/TABLE] Source: https://freestatistics.org/blog/index.php?pk=309580&T=0

Globally Unique Identifier (entire table): ba.freestatistics.org/blog/index.php?pk=309580&T=0

As an alternative you can also use a QR Code:  

The GUIDs for individual cells are displayed in the table below:

Summary of computational transaction
Raw Input view raw input (R code)
Raw Outputview raw output of R engine
Computing time2 seconds
R ServerBig Analytics Cloud Computing Center


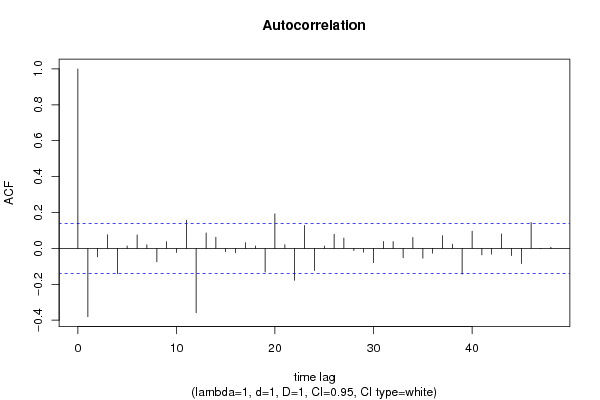
Autocorrelation Function
Time lag kACF(k)T-STATP-value
1-0.380189-5.36320
2-0.046313-0.65330.257152
30.0762221.07520.141783
4-0.140849-1.98690.024152
50.0139810.19720.421924
60.0752431.06140.144891
70.0204560.28860.386605
8-0.074549-1.05160.147118
90.0375240.52930.29858
10-0.022377-0.31570.376291
110.1571322.21660.013891
12-0.358139-5.05220
130.0860781.21430.11304
140.0623930.88020.189917
15-0.01879-0.26510.395617
16-0.024513-0.34580.364929
170.0325470.45910.323318
180.0131610.18570.42645
19-0.131209-1.85090.032831
200.1925462.71620.003592
210.0209350.29530.384028
22-0.177073-2.49790.006651
230.1275961.80.03669
24-0.122828-1.73270.042349
250.0127720.18020.428598
260.0794511.12080.131863
270.057460.81060.209291
28-0.011634-0.16410.434902
29-0.020861-0.29430.384423
30-0.079224-1.11760.132545
310.0385520.54380.29358
320.0379410.53520.296547
33-0.052058-0.73440.231793
340.060670.85590.196553
35-0.054317-0.76620.222221
36-0.026419-0.37270.354887
370.0710781.00270.158618
380.0237920.33560.368752
39-0.143006-2.01730.022501
400.0958621.35230.088907
41-0.036219-0.51090.304985
42-0.031832-0.4490.326943
430.0801581.13080.129757
44-0.040009-0.56440.286559
45-0.083984-1.18470.118765
460.144832.04310.021181
47-0.001712-0.02410.49038
480.0062770.08850.464765

\begin{tabular}{lllllllll}
\hline
Autocorrelation Function \tabularnewline
Time lag k & ACF(k) & T-STAT & P-value \tabularnewline
1 & -0.380189 & -5.3632 & 0 \tabularnewline
2 & -0.046313 & -0.6533 & 0.257152 \tabularnewline
3 & 0.076222 & 1.0752 & 0.141783 \tabularnewline
4 & -0.140849 & -1.9869 & 0.024152 \tabularnewline
5 & 0.013981 & 0.1972 & 0.421924 \tabularnewline
6 & 0.075243 & 1.0614 & 0.144891 \tabularnewline
7 & 0.020456 & 0.2886 & 0.386605 \tabularnewline
8 & -0.074549 & -1.0516 & 0.147118 \tabularnewline
9 & 0.037524 & 0.5293 & 0.29858 \tabularnewline
10 & -0.022377 & -0.3157 & 0.376291 \tabularnewline
11 & 0.157132 & 2.2166 & 0.013891 \tabularnewline
12 & -0.358139 & -5.0522 & 0 \tabularnewline
13 & 0.086078 & 1.2143 & 0.11304 \tabularnewline
14 & 0.062393 & 0.8802 & 0.189917 \tabularnewline
15 & -0.01879 & -0.2651 & 0.395617 \tabularnewline
16 & -0.024513 & -0.3458 & 0.364929 \tabularnewline
17 & 0.032547 & 0.4591 & 0.323318 \tabularnewline
18 & 0.013161 & 0.1857 & 0.42645 \tabularnewline
19 & -0.131209 & -1.8509 & 0.032831 \tabularnewline
20 & 0.192546 & 2.7162 & 0.003592 \tabularnewline
21 & 0.020935 & 0.2953 & 0.384028 \tabularnewline
22 & -0.177073 & -2.4979 & 0.006651 \tabularnewline
23 & 0.127596 & 1.8 & 0.03669 \tabularnewline
24 & -0.122828 & -1.7327 & 0.042349 \tabularnewline
25 & 0.012772 & 0.1802 & 0.428598 \tabularnewline
26 & 0.079451 & 1.1208 & 0.131863 \tabularnewline
27 & 0.05746 & 0.8106 & 0.209291 \tabularnewline
28 & -0.011634 & -0.1641 & 0.434902 \tabularnewline
29 & -0.020861 & -0.2943 & 0.384423 \tabularnewline
30 & -0.079224 & -1.1176 & 0.132545 \tabularnewline
31 & 0.038552 & 0.5438 & 0.29358 \tabularnewline
32 & 0.037941 & 0.5352 & 0.296547 \tabularnewline
33 & -0.052058 & -0.7344 & 0.231793 \tabularnewline
34 & 0.06067 & 0.8559 & 0.196553 \tabularnewline
35 & -0.054317 & -0.7662 & 0.222221 \tabularnewline
36 & -0.026419 & -0.3727 & 0.354887 \tabularnewline
37 & 0.071078 & 1.0027 & 0.158618 \tabularnewline
38 & 0.023792 & 0.3356 & 0.368752 \tabularnewline
39 & -0.143006 & -2.0173 & 0.022501 \tabularnewline
40 & 0.095862 & 1.3523 & 0.088907 \tabularnewline
41 & -0.036219 & -0.5109 & 0.304985 \tabularnewline
42 & -0.031832 & -0.449 & 0.326943 \tabularnewline
43 & 0.080158 & 1.1308 & 0.129757 \tabularnewline
44 & -0.040009 & -0.5644 & 0.286559 \tabularnewline
45 & -0.083984 & -1.1847 & 0.118765 \tabularnewline
46 & 0.14483 & 2.0431 & 0.021181 \tabularnewline
47 & -0.001712 & -0.0241 & 0.49038 \tabularnewline
48 & 0.006277 & 0.0885 & 0.464765 \tabularnewline
\hline
\end{tabular}
%Source: https://freestatistics.org/blog/index.php?pk=309580&T=1

[TABLE]
[ROW][C]Autocorrelation Function[/C][/ROW]
[ROW][C]Time lag k[/C][C]ACF(k)[/C][C]T-STAT[/C][C]P-value[/C][/ROW]
[ROW][C]1[/C][C]-0.380189[/C][C]-5.3632[/C][C]0[/C][/ROW]
[ROW][C]2[/C][C]-0.046313[/C][C]-0.6533[/C][C]0.257152[/C][/ROW]
[ROW][C]3[/C][C]0.076222[/C][C]1.0752[/C][C]0.141783[/C][/ROW]
[ROW][C]4[/C][C]-0.140849[/C][C]-1.9869[/C][C]0.024152[/C][/ROW]
[ROW][C]5[/C][C]0.013981[/C][C]0.1972[/C][C]0.421924[/C][/ROW]
[ROW][C]6[/C][C]0.075243[/C][C]1.0614[/C][C]0.144891[/C][/ROW]
[ROW][C]7[/C][C]0.020456[/C][C]0.2886[/C][C]0.386605[/C][/ROW]
[ROW][C]8[/C][C]-0.074549[/C][C]-1.0516[/C][C]0.147118[/C][/ROW]
[ROW][C]9[/C][C]0.037524[/C][C]0.5293[/C][C]0.29858[/C][/ROW]
[ROW][C]10[/C][C]-0.022377[/C][C]-0.3157[/C][C]0.376291[/C][/ROW]
[ROW][C]11[/C][C]0.157132[/C][C]2.2166[/C][C]0.013891[/C][/ROW]
[ROW][C]12[/C][C]-0.358139[/C][C]-5.0522[/C][C]0[/C][/ROW]
[ROW][C]13[/C][C]0.086078[/C][C]1.2143[/C][C]0.11304[/C][/ROW]
[ROW][C]14[/C][C]0.062393[/C][C]0.8802[/C][C]0.189917[/C][/ROW]
[ROW][C]15[/C][C]-0.01879[/C][C]-0.2651[/C][C]0.395617[/C][/ROW]
[ROW][C]16[/C][C]-0.024513[/C][C]-0.3458[/C][C]0.364929[/C][/ROW]
[ROW][C]17[/C][C]0.032547[/C][C]0.4591[/C][C]0.323318[/C][/ROW]
[ROW][C]18[/C][C]0.013161[/C][C]0.1857[/C][C]0.42645[/C][/ROW]
[ROW][C]19[/C][C]-0.131209[/C][C]-1.8509[/C][C]0.032831[/C][/ROW]
[ROW][C]20[/C][C]0.192546[/C][C]2.7162[/C][C]0.003592[/C][/ROW]
[ROW][C]21[/C][C]0.020935[/C][C]0.2953[/C][C]0.384028[/C][/ROW]
[ROW][C]22[/C][C]-0.177073[/C][C]-2.4979[/C][C]0.006651[/C][/ROW]
[ROW][C]23[/C][C]0.127596[/C][C]1.8[/C][C]0.03669[/C][/ROW]
[ROW][C]24[/C][C]-0.122828[/C][C]-1.7327[/C][C]0.042349[/C][/ROW]
[ROW][C]25[/C][C]0.012772[/C][C]0.1802[/C][C]0.428598[/C][/ROW]
[ROW][C]26[/C][C]0.079451[/C][C]1.1208[/C][C]0.131863[/C][/ROW]
[ROW][C]27[/C][C]0.05746[/C][C]0.8106[/C][C]0.209291[/C][/ROW]
[ROW][C]28[/C][C]-0.011634[/C][C]-0.1641[/C][C]0.434902[/C][/ROW]
[ROW][C]29[/C][C]-0.020861[/C][C]-0.2943[/C][C]0.384423[/C][/ROW]
[ROW][C]30[/C][C]-0.079224[/C][C]-1.1176[/C][C]0.132545[/C][/ROW]
[ROW][C]31[/C][C]0.038552[/C][C]0.5438[/C][C]0.29358[/C][/ROW]
[ROW][C]32[/C][C]0.037941[/C][C]0.5352[/C][C]0.296547[/C][/ROW]
[ROW][C]33[/C][C]-0.052058[/C][C]-0.7344[/C][C]0.231793[/C][/ROW]
[ROW][C]34[/C][C]0.06067[/C][C]0.8559[/C][C]0.196553[/C][/ROW]
[ROW][C]35[/C][C]-0.054317[/C][C]-0.7662[/C][C]0.222221[/C][/ROW]
[ROW][C]36[/C][C]-0.026419[/C][C]-0.3727[/C][C]0.354887[/C][/ROW]
[ROW][C]37[/C][C]0.071078[/C][C]1.0027[/C][C]0.158618[/C][/ROW]
[ROW][C]38[/C][C]0.023792[/C][C]0.3356[/C][C]0.368752[/C][/ROW]
[ROW][C]39[/C][C]-0.143006[/C][C]-2.0173[/C][C]0.022501[/C][/ROW]
[ROW][C]40[/C][C]0.095862[/C][C]1.3523[/C][C]0.088907[/C][/ROW]
[ROW][C]41[/C][C]-0.036219[/C][C]-0.5109[/C][C]0.304985[/C][/ROW]
[ROW][C]42[/C][C]-0.031832[/C][C]-0.449[/C][C]0.326943[/C][/ROW]
[ROW][C]43[/C][C]0.080158[/C][C]1.1308[/C][C]0.129757[/C][/ROW]
[ROW][C]44[/C][C]-0.040009[/C][C]-0.5644[/C][C]0.286559[/C][/ROW]
[ROW][C]45[/C][C]-0.083984[/C][C]-1.1847[/C][C]0.118765[/C][/ROW]
[ROW][C]46[/C][C]0.14483[/C][C]2.0431[/C][C]0.021181[/C][/ROW]
[ROW][C]47[/C][C]-0.001712[/C][C]-0.0241[/C][C]0.49038[/C][/ROW]
[ROW][C]48[/C][C]0.006277[/C][C]0.0885[/C][C]0.464765[/C][/ROW]
[/TABLE]
Source: https://freestatistics.org/blog/index.php?pk=309580&T=1

Globally Unique Identifier (entire table): ba.freestatistics.org/blog/index.php?pk=309580&T=1

As an alternative you can also use a QR Code:  

The GUIDs for individual cells are displayed in the table below:

Autocorrelation Function
Time lag kACF(k)T-STATP-value
1-0.380189-5.36320
2-0.046313-0.65330.257152
30.0762221.07520.141783
4-0.140849-1.98690.024152
50.0139810.19720.421924
60.0752431.06140.144891
70.0204560.28860.386605
8-0.074549-1.05160.147118
90.0375240.52930.29858
10-0.022377-0.31570.376291
110.1571322.21660.013891
12-0.358139-5.05220
130.0860781.21430.11304
140.0623930.88020.189917
15-0.01879-0.26510.395617
16-0.024513-0.34580.364929
170.0325470.45910.323318
180.0131610.18570.42645
19-0.131209-1.85090.032831
200.1925462.71620.003592
210.0209350.29530.384028
22-0.177073-2.49790.006651
230.1275961.80.03669
24-0.122828-1.73270.042349
250.0127720.18020.428598
260.0794511.12080.131863
270.057460.81060.209291
28-0.011634-0.16410.434902
29-0.020861-0.29430.384423
30-0.079224-1.11760.132545
310.0385520.54380.29358
320.0379410.53520.296547
33-0.052058-0.73440.231793
340.060670.85590.196553
35-0.054317-0.76620.222221
36-0.026419-0.37270.354887
370.0710781.00270.158618
380.0237920.33560.368752
39-0.143006-2.01730.022501
400.0958621.35230.088907
41-0.036219-0.51090.304985
42-0.031832-0.4490.326943
430.0801581.13080.129757
44-0.040009-0.56440.286559
45-0.083984-1.18470.118765
460.144832.04310.021181
47-0.001712-0.02410.49038
480.0062770.08850.464765


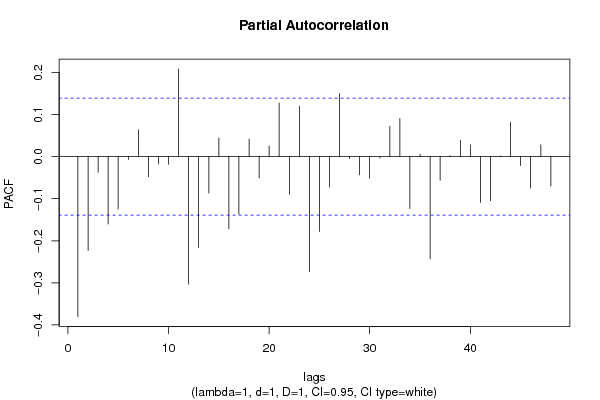
Partial Autocorrelation Function
Time lag kPACF(k)T-STATP-value
1-0.380189-5.36320
2-0.223105-3.14730.000951
3-0.037073-0.5230.300786
4-0.160146-2.25910.01248
5-0.124378-1.75460.040436
6-0.006739-0.09510.462181
70.0638160.90020.184541
8-0.047813-0.67450.250394
9-0.01745-0.24620.402904
10-0.018289-0.2580.398336
110.2083432.9390.001841
12-0.30302-4.27461.5e-05
13-0.215817-3.04450.001323
14-0.086519-1.22050.11186
150.0442560.62430.266569
16-0.171257-2.41590.0083
17-0.136556-1.92640.027742
180.0419650.5920.277263
19-0.050798-0.71660.237232
200.0252610.35640.360975
210.1272821.79550.037043
22-0.089392-1.2610.104387
230.1197661.68950.046345
24-0.273365-3.85637.8e-05
25-0.177748-2.50740.00648
26-0.072111-1.01720.155135
270.1499892.11590.0178
28-0.004341-0.06120.475615
29-0.043278-0.61050.271108
30-0.051131-0.72130.235787
31-0.003394-0.04790.480929
320.0723571.02070.154314
330.090671.27910.101183
34-0.123362-1.74020.041682
350.0058420.08240.467199
36-0.242629-3.42270.000376
37-0.056259-0.79360.214177
380.0021290.030.488038
390.0390850.55140.291002
400.0276360.38990.348531
41-0.109163-1.53990.062583
42-0.104669-1.47650.070691
430.001660.02340.490671
440.0815671.15060.12563
45-0.021303-0.30050.382051
46-0.074467-1.05050.147384
470.0281820.39760.34569
48-0.069461-0.97990.164169

\begin{tabular}{lllllllll}
\hline
Partial Autocorrelation Function \tabularnewline
Time lag k & PACF(k) & T-STAT & P-value \tabularnewline
1 & -0.380189 & -5.3632 & 0 \tabularnewline
2 & -0.223105 & -3.1473 & 0.000951 \tabularnewline
3 & -0.037073 & -0.523 & 0.300786 \tabularnewline
4 & -0.160146 & -2.2591 & 0.01248 \tabularnewline
5 & -0.124378 & -1.7546 & 0.040436 \tabularnewline
6 & -0.006739 & -0.0951 & 0.462181 \tabularnewline
7 & 0.063816 & 0.9002 & 0.184541 \tabularnewline
8 & -0.047813 & -0.6745 & 0.250394 \tabularnewline
9 & -0.01745 & -0.2462 & 0.402904 \tabularnewline
10 & -0.018289 & -0.258 & 0.398336 \tabularnewline
11 & 0.208343 & 2.939 & 0.001841 \tabularnewline
12 & -0.30302 & -4.2746 & 1.5e-05 \tabularnewline
13 & -0.215817 & -3.0445 & 0.001323 \tabularnewline
14 & -0.086519 & -1.2205 & 0.11186 \tabularnewline
15 & 0.044256 & 0.6243 & 0.266569 \tabularnewline
16 & -0.171257 & -2.4159 & 0.0083 \tabularnewline
17 & -0.136556 & -1.9264 & 0.027742 \tabularnewline
18 & 0.041965 & 0.592 & 0.277263 \tabularnewline
19 & -0.050798 & -0.7166 & 0.237232 \tabularnewline
20 & 0.025261 & 0.3564 & 0.360975 \tabularnewline
21 & 0.127282 & 1.7955 & 0.037043 \tabularnewline
22 & -0.089392 & -1.261 & 0.104387 \tabularnewline
23 & 0.119766 & 1.6895 & 0.046345 \tabularnewline
24 & -0.273365 & -3.8563 & 7.8e-05 \tabularnewline
25 & -0.177748 & -2.5074 & 0.00648 \tabularnewline
26 & -0.072111 & -1.0172 & 0.155135 \tabularnewline
27 & 0.149989 & 2.1159 & 0.0178 \tabularnewline
28 & -0.004341 & -0.0612 & 0.475615 \tabularnewline
29 & -0.043278 & -0.6105 & 0.271108 \tabularnewline
30 & -0.051131 & -0.7213 & 0.235787 \tabularnewline
31 & -0.003394 & -0.0479 & 0.480929 \tabularnewline
32 & 0.072357 & 1.0207 & 0.154314 \tabularnewline
33 & 0.09067 & 1.2791 & 0.101183 \tabularnewline
34 & -0.123362 & -1.7402 & 0.041682 \tabularnewline
35 & 0.005842 & 0.0824 & 0.467199 \tabularnewline
36 & -0.242629 & -3.4227 & 0.000376 \tabularnewline
37 & -0.056259 & -0.7936 & 0.214177 \tabularnewline
38 & 0.002129 & 0.03 & 0.488038 \tabularnewline
39 & 0.039085 & 0.5514 & 0.291002 \tabularnewline
40 & 0.027636 & 0.3899 & 0.348531 \tabularnewline
41 & -0.109163 & -1.5399 & 0.062583 \tabularnewline
42 & -0.104669 & -1.4765 & 0.070691 \tabularnewline
43 & 0.00166 & 0.0234 & 0.490671 \tabularnewline
44 & 0.081567 & 1.1506 & 0.12563 \tabularnewline
45 & -0.021303 & -0.3005 & 0.382051 \tabularnewline
46 & -0.074467 & -1.0505 & 0.147384 \tabularnewline
47 & 0.028182 & 0.3976 & 0.34569 \tabularnewline
48 & -0.069461 & -0.9799 & 0.164169 \tabularnewline
\hline
\end{tabular}
%Source: https://freestatistics.org/blog/index.php?pk=309580&T=2

[TABLE]
[ROW][C]Partial Autocorrelation Function[/C][/ROW]
[ROW][C]Time lag k[/C][C]PACF(k)[/C][C]T-STAT[/C][C]P-value[/C][/ROW]
[ROW][C]1[/C][C]-0.380189[/C][C]-5.3632[/C][C]0[/C][/ROW]
[ROW][C]2[/C][C]-0.223105[/C][C]-3.1473[/C][C]0.000951[/C][/ROW]
[ROW][C]3[/C][C]-0.037073[/C][C]-0.523[/C][C]0.300786[/C][/ROW]
[ROW][C]4[/C][C]-0.160146[/C][C]-2.2591[/C][C]0.01248[/C][/ROW]
[ROW][C]5[/C][C]-0.124378[/C][C]-1.7546[/C][C]0.040436[/C][/ROW]
[ROW][C]6[/C][C]-0.006739[/C][C]-0.0951[/C][C]0.462181[/C][/ROW]
[ROW][C]7[/C][C]0.063816[/C][C]0.9002[/C][C]0.184541[/C][/ROW]
[ROW][C]8[/C][C]-0.047813[/C][C]-0.6745[/C][C]0.250394[/C][/ROW]
[ROW][C]9[/C][C]-0.01745[/C][C]-0.2462[/C][C]0.402904[/C][/ROW]
[ROW][C]10[/C][C]-0.018289[/C][C]-0.258[/C][C]0.398336[/C][/ROW]
[ROW][C]11[/C][C]0.208343[/C][C]2.939[/C][C]0.001841[/C][/ROW]
[ROW][C]12[/C][C]-0.30302[/C][C]-4.2746[/C][C]1.5e-05[/C][/ROW]
[ROW][C]13[/C][C]-0.215817[/C][C]-3.0445[/C][C]0.001323[/C][/ROW]
[ROW][C]14[/C][C]-0.086519[/C][C]-1.2205[/C][C]0.11186[/C][/ROW]
[ROW][C]15[/C][C]0.044256[/C][C]0.6243[/C][C]0.266569[/C][/ROW]
[ROW][C]16[/C][C]-0.171257[/C][C]-2.4159[/C][C]0.0083[/C][/ROW]
[ROW][C]17[/C][C]-0.136556[/C][C]-1.9264[/C][C]0.027742[/C][/ROW]
[ROW][C]18[/C][C]0.041965[/C][C]0.592[/C][C]0.277263[/C][/ROW]
[ROW][C]19[/C][C]-0.050798[/C][C]-0.7166[/C][C]0.237232[/C][/ROW]
[ROW][C]20[/C][C]0.025261[/C][C]0.3564[/C][C]0.360975[/C][/ROW]
[ROW][C]21[/C][C]0.127282[/C][C]1.7955[/C][C]0.037043[/C][/ROW]
[ROW][C]22[/C][C]-0.089392[/C][C]-1.261[/C][C]0.104387[/C][/ROW]
[ROW][C]23[/C][C]0.119766[/C][C]1.6895[/C][C]0.046345[/C][/ROW]
[ROW][C]24[/C][C]-0.273365[/C][C]-3.8563[/C][C]7.8e-05[/C][/ROW]
[ROW][C]25[/C][C]-0.177748[/C][C]-2.5074[/C][C]0.00648[/C][/ROW]
[ROW][C]26[/C][C]-0.072111[/C][C]-1.0172[/C][C]0.155135[/C][/ROW]
[ROW][C]27[/C][C]0.149989[/C][C]2.1159[/C][C]0.0178[/C][/ROW]
[ROW][C]28[/C][C]-0.004341[/C][C]-0.0612[/C][C]0.475615[/C][/ROW]
[ROW][C]29[/C][C]-0.043278[/C][C]-0.6105[/C][C]0.271108[/C][/ROW]
[ROW][C]30[/C][C]-0.051131[/C][C]-0.7213[/C][C]0.235787[/C][/ROW]
[ROW][C]31[/C][C]-0.003394[/C][C]-0.0479[/C][C]0.480929[/C][/ROW]
[ROW][C]32[/C][C]0.072357[/C][C]1.0207[/C][C]0.154314[/C][/ROW]
[ROW][C]33[/C][C]0.09067[/C][C]1.2791[/C][C]0.101183[/C][/ROW]
[ROW][C]34[/C][C]-0.123362[/C][C]-1.7402[/C][C]0.041682[/C][/ROW]
[ROW][C]35[/C][C]0.005842[/C][C]0.0824[/C][C]0.467199[/C][/ROW]
[ROW][C]36[/C][C]-0.242629[/C][C]-3.4227[/C][C]0.000376[/C][/ROW]
[ROW][C]37[/C][C]-0.056259[/C][C]-0.7936[/C][C]0.214177[/C][/ROW]
[ROW][C]38[/C][C]0.002129[/C][C]0.03[/C][C]0.488038[/C][/ROW]
[ROW][C]39[/C][C]0.039085[/C][C]0.5514[/C][C]0.291002[/C][/ROW]
[ROW][C]40[/C][C]0.027636[/C][C]0.3899[/C][C]0.348531[/C][/ROW]
[ROW][C]41[/C][C]-0.109163[/C][C]-1.5399[/C][C]0.062583[/C][/ROW]
[ROW][C]42[/C][C]-0.104669[/C][C]-1.4765[/C][C]0.070691[/C][/ROW]
[ROW][C]43[/C][C]0.00166[/C][C]0.0234[/C][C]0.490671[/C][/ROW]
[ROW][C]44[/C][C]0.081567[/C][C]1.1506[/C][C]0.12563[/C][/ROW]
[ROW][C]45[/C][C]-0.021303[/C][C]-0.3005[/C][C]0.382051[/C][/ROW]
[ROW][C]46[/C][C]-0.074467[/C][C]-1.0505[/C][C]0.147384[/C][/ROW]
[ROW][C]47[/C][C]0.028182[/C][C]0.3976[/C][C]0.34569[/C][/ROW]
[ROW][C]48[/C][C]-0.069461[/C][C]-0.9799[/C][C]0.164169[/C][/ROW]
[/TABLE]
Source: https://freestatistics.org/blog/index.php?pk=309580&T=2

Globally Unique Identifier (entire table): ba.freestatistics.org/blog/index.php?pk=309580&T=2

As an alternative you can also use a QR Code:  

The GUIDs for individual cells are displayed in the table below:

Partial Autocorrelation Function
Time lag kPACF(k)T-STATP-value
1-0.380189-5.36320
2-0.223105-3.14730.000951
3-0.037073-0.5230.300786
4-0.160146-2.25910.01248
5-0.124378-1.75460.040436
6-0.006739-0.09510.462181
70.0638160.90020.184541
8-0.047813-0.67450.250394
9-0.01745-0.24620.402904
10-0.018289-0.2580.398336
110.2083432.9390.001841
12-0.30302-4.27461.5e-05
13-0.215817-3.04450.001323
14-0.086519-1.22050.11186
150.0442560.62430.266569
16-0.171257-2.41590.0083
17-0.136556-1.92640.027742
180.0419650.5920.277263
19-0.050798-0.71660.237232
200.0252610.35640.360975
210.1272821.79550.037043
22-0.089392-1.2610.104387
230.1197661.68950.046345
24-0.273365-3.85637.8e-05
25-0.177748-2.50740.00648
26-0.072111-1.01720.155135
270.1499892.11590.0178
28-0.004341-0.06120.475615
29-0.043278-0.61050.271108
30-0.051131-0.72130.235787
31-0.003394-0.04790.480929
320.0723571.02070.154314
330.090671.27910.101183
34-0.123362-1.74020.041682
350.0058420.08240.467199
36-0.242629-3.42270.000376
37-0.056259-0.79360.214177
380.0021290.030.488038
390.0390850.55140.291002
400.0276360.38990.348531
41-0.109163-1.53990.062583
42-0.104669-1.47650.070691
430.001660.02340.490671
440.0815671.15060.12563
45-0.021303-0.30050.382051
46-0.074467-1.05050.147384
470.0281820.39760.34569
48-0.069461-0.97990.164169


Parameters (Session):
par1 = 48 ; par2 = 1 ; par3 = 1 ; par4 = 1 ; par5 = 12 ; par6 = White Noise ; par7 = 0.95 ;
Parameters (R input):
par1 = 48 ; par2 = 1 ; par3 = 1 ; par4 = 1 ; par5 = 12 ; par6 = White Noise ; par7 = 0.95 ; par8 = ;
R code (references can be found in the software module):
par8 <- ''
par7 <- '0.95'
par6 <- 'White Noise'
par5 <- '12'
par4 <- '1'
par3 <- '1'
par2 <- '1'
par1 <- '48'
if (par1 == 'Default') {
par1 = 10*log10(length(x))
} else {
par1 <- as.numeric(par1)
}
par2 <- as.numeric(par2)
par3 <- as.numeric(par3)
par4 <- as.numeric(par4)
par5 <- as.numeric(par5)
if (par6 == 'White Noise') par6 <- 'white' else par6 <- 'ma'
par7 <- as.numeric(par7)
if (par8 != '') par8 <- as.numeric(par8)
x <- na.omit(x)
ox <- x
if (par8 == '') {
if (par2 == 0) {
x <- log(x)
} else {
x <- (x ^ par2 - 1) / par2
}
} else {
x <- log(x,base=par8)
}
if (par3 > 0) x <- diff(x,lag=1,difference=par3)
if (par4 > 0) x <- diff(x,lag=par5,difference=par4)
bitmap(file='picts.png')
op <- par(mfrow=c(2,1))
plot(ox,type='l',main='Original Time Series',xlab='time',ylab='value')
if (par8=='') {
mytitle <- paste('Working Time Series (lambda=',par2,', d=',par3,', D=',par4,')',sep='')
mysub <- paste('(lambda=',par2,', d=',par3,', D=',par4,', CI=', par7, ', CI type=',par6,')',sep='')
} else {
mytitle <- paste('Working Time Series (base=',par8,', d=',par3,', D=',par4,')',sep='')
mysub <- paste('(base=',par8,', d=',par3,', D=',par4,', CI=', par7, ', CI type=',par6,')',sep='')
}
plot(x,type='l', main=mytitle,xlab='time',ylab='value')
par(op)
dev.off()
bitmap(file='pic1.png')
racf <- acf(x, par1, main='Autocorrelation', xlab='time lag', ylab='ACF', ci.type=par6, ci=par7, sub=mysub)
dev.off()
bitmap(file='pic2.png')
rpacf <- pacf(x,par1,main='Partial Autocorrelation',xlab='lags',ylab='PACF',sub=mysub)
dev.off()
(myacf <- c(racf$acf))
(mypacf <- c(rpacf$acf))
lengthx <- length(x)
sqrtn <- sqrt(lengthx)
load(file='createtable')
a<-table.start()
a<-table.row.start(a)
a<-table.element(a,'Autocorrelation Function',4,TRUE)
a<-table.row.end(a)
a<-table.row.start(a)
a<-table.element(a,'Time lag k',header=TRUE)
a<-table.element(a,'ACF(k)',header=TRUE)
a<-table.element(a,'T-STAT',header=TRUE)
a<-table.element(a,'P-value',header=TRUE)
a<-table.row.end(a)
for (i in 2:(par1+1)) {
a<-table.row.start(a)
a<-table.element(a,i-1,header=TRUE)
a<-table.element(a,round(myacf[i],6))
mytstat <- myacf[i]*sqrtn
a<-table.element(a,round(mytstat,4))
a<-table.element(a,round(1-pt(abs(mytstat),lengthx),6))
a<-table.row.end(a)
}
a<-table.end(a)
table.save(a,file='mytable.tab')
a<-table.start()
a<-table.row.start(a)
a<-table.element(a,'Partial Autocorrelation Function',4,TRUE)
a<-table.row.end(a)
a<-table.row.start(a)
a<-table.element(a,'Time lag k',header=TRUE)
a<-table.element(a,'PACF(k)',header=TRUE)
a<-table.element(a,'T-STAT',header=TRUE)
a<-table.element(a,'P-value',header=TRUE)
a<-table.row.end(a)
for (i in 1:par1) {
a<-table.row.start(a)
a<-table.element(a,i,header=TRUE)
a<-table.element(a,round(mypacf[i],6))
mytstat <- mypacf[i]*sqrtn
a<-table.element(a,round(mytstat,4))
a<-table.element(a,round(1-pt(abs(mytstat),lengthx),6))
a<-table.row.end(a)
}
a<-table.end(a)
table.save(a,file='mytable1.tab')