Free Statistics

of Irreproducible Research!

Author's title

Author*The author of this computation has been verified*
R Software Modulerwasp_smp.wasp
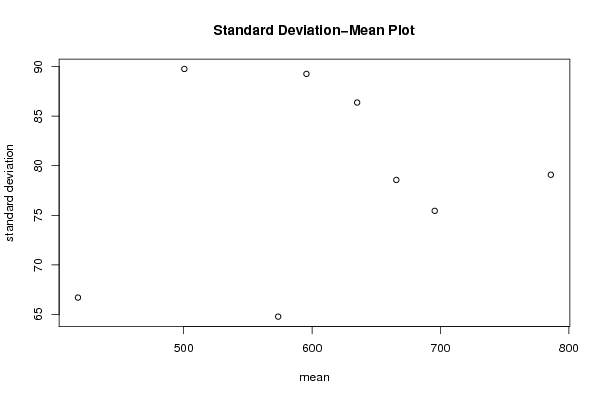
Title produced by softwareStandard Deviation-Mean Plot
Date of computationThu, 14 Dec 2017 19:49:58 +0100
Cite this page as followsStatistical Computations at FreeStatistics.org, Office for Research Development and Education, URL https://freestatistics.org/blog/index.php?v=date/2017/Dec/14/t151327784560vugxhmj8pf7h9.htm/, Retrieved Tue, 14 May 2024 05:35:22 +0000
Statistical Computations at FreeStatistics.org, Office for Research Development and Education, URL https://freestatistics.org/blog/index.php?pk=309578, Retrieved Tue, 14 May 2024 05:35:22 +0000
QR Codes:

Original text written by user:
IsPrivate?No (this computation is public)
User-defined keywords
Estimated Impact71
Family? (F = Feedback message, R = changed R code, M = changed R Module, P = changed Parameters, D = changed Data)
-       [Standard Deviation-Mean Plot] [Standard deviatio...] [2017-12-14 18:49:58] [dd1b1eac6490c5f5f771b5814b2d0001] [Current]
Feedback Forum

Post a new message
Dataseries X:
563
601
768
717
581
797
731
586
710
621
677
635
590
632
744
571
473
754
548
590
514
590
652
489
546
569
620
499
631
483
503
578
582
587
718
567
766
671
667
668
761
661
809
577
646
816
686
618
835
832
813
791
891
797
883
682
675
840
677
715
700
681
596
829
621
524
721
537
630
608
558
616
552
538
712
513
433
543
479
363
456
427
438
552
426
504
515
411
437
421
400
372
333
332
515
346
444
336
340
296
373
325
289
315
271
331
291


Summary of computational transaction
Raw Input view raw input (R code)
Raw Outputview raw output of R engine
Computing time1 seconds
R ServerBig Analytics Cloud Computing Center

\begin{tabular}{lllllllll}
\hline
Summary of computational transaction \tabularnewline
Raw Input view raw input (R code)  \tabularnewline
Raw Outputview raw output of R engine  \tabularnewline
Computing time1 seconds \tabularnewline
R ServerBig Analytics Cloud Computing Center \tabularnewline
\hline
\end{tabular}
%Source: https://freestatistics.org/blog/index.php?pk=309578&T=0

[TABLE]
[ROW]
Summary of computational transaction[/C][/ROW] [ROW]Raw Input[/C] view raw input (R code) [/C][/ROW] [ROW]Raw Output[/C]view raw output of R engine [/C][/ROW] [ROW]Computing time[/C]1 seconds[/C][/ROW] [ROW]R Server[/C]Big Analytics Cloud Computing Center[/C][/ROW] [/TABLE] Source: https://freestatistics.org/blog/index.php?pk=309578&T=0

Globally Unique Identifier (entire table): ba.freestatistics.org/blog/index.php?pk=309578&T=0

As an alternative you can also use a QR Code:  

The GUIDs for individual cells are displayed in the table below:

Summary of computational transaction
Raw Input view raw input (R code)
Raw Outputview raw output of R engine
Computing time1 seconds
R ServerBig Analytics Cloud Computing Center


Standard Deviation-Mean Plot
SectionMeanStandard DeviationRange
1665.58333333333378.5614505667475234
2595.58333333333389.2580104205915281
3573.58333333333364.7743753113042235
4695.575.4447419699285239
5785.91666666666779.086211110906216
6635.08333333333386.3707213999716305
7500.589.7567419599928349
8417.66666666666766.7019603546366183

\begin{tabular}{lllllllll}
\hline
Standard Deviation-Mean Plot \tabularnewline
Section & Mean & Standard Deviation & Range \tabularnewline
1 & 665.583333333333 & 78.5614505667475 & 234 \tabularnewline
2 & 595.583333333333 & 89.2580104205915 & 281 \tabularnewline
3 & 573.583333333333 & 64.7743753113042 & 235 \tabularnewline
4 & 695.5 & 75.4447419699285 & 239 \tabularnewline
5 & 785.916666666667 & 79.086211110906 & 216 \tabularnewline
6 & 635.083333333333 & 86.3707213999716 & 305 \tabularnewline
7 & 500.5 & 89.7567419599928 & 349 \tabularnewline
8 & 417.666666666667 & 66.7019603546366 & 183 \tabularnewline
\hline
\end{tabular}
%Source: https://freestatistics.org/blog/index.php?pk=309578&T=1

[TABLE]
[ROW][C]Standard Deviation-Mean Plot[/C][/ROW]
[ROW][C]Section[/C][C]Mean[/C][C]Standard Deviation[/C][C]Range[/C][/ROW]
[ROW][C]1[/C][C]665.583333333333[/C][C]78.5614505667475[/C][C]234[/C][/ROW]
[ROW][C]2[/C][C]595.583333333333[/C][C]89.2580104205915[/C][C]281[/C][/ROW]
[ROW][C]3[/C][C]573.583333333333[/C][C]64.7743753113042[/C][C]235[/C][/ROW]
[ROW][C]4[/C][C]695.5[/C][C]75.4447419699285[/C][C]239[/C][/ROW]
[ROW][C]5[/C][C]785.916666666667[/C][C]79.086211110906[/C][C]216[/C][/ROW]
[ROW][C]6[/C][C]635.083333333333[/C][C]86.3707213999716[/C][C]305[/C][/ROW]
[ROW][C]7[/C][C]500.5[/C][C]89.7567419599928[/C][C]349[/C][/ROW]
[ROW][C]8[/C][C]417.666666666667[/C][C]66.7019603546366[/C][C]183[/C][/ROW]
[/TABLE]
Source: https://freestatistics.org/blog/index.php?pk=309578&T=1

Globally Unique Identifier (entire table): ba.freestatistics.org/blog/index.php?pk=309578&T=1

As an alternative you can also use a QR Code:  

The GUIDs for individual cells are displayed in the table below:

Standard Deviation-Mean Plot
SectionMeanStandard DeviationRange
1665.58333333333378.5614505667475234
2595.58333333333389.2580104205915281
3573.58333333333364.7743753113042235
4695.575.4447419699285239
5785.91666666666779.086211110906216
6635.08333333333386.3707213999716305
7500.589.7567419599928349
8417.66666666666766.7019603546366183


Regression: S.E.(k) = alpha + beta * Mean(k)
alpha69.3545003674811
beta0.0154265316148539
S.D.0.0334051886870124
T-STAT0.461800463376865
p-value0.660493951424109

\begin{tabular}{lllllllll}
\hline
Regression: S.E.(k) = alpha + beta * Mean(k) \tabularnewline
alpha & 69.3545003674811 \tabularnewline
beta & 0.0154265316148539 \tabularnewline
S.D. & 0.0334051886870124 \tabularnewline
T-STAT & 0.461800463376865 \tabularnewline
p-value & 0.660493951424109 \tabularnewline
\hline
\end{tabular}
%Source: https://freestatistics.org/blog/index.php?pk=309578&T=2

[TABLE]
[ROW][C]Regression: S.E.(k) = alpha + beta * Mean(k)[/C][/ROW]
[ROW][C]alpha[/C][C]69.3545003674811[/C][/ROW]
[ROW][C]beta[/C][C]0.0154265316148539[/C][/ROW]
[ROW][C]S.D.[/C][C]0.0334051886870124[/C][/ROW]
[ROW][C]T-STAT[/C][C]0.461800463376865[/C][/ROW]
[ROW][C]p-value[/C][C]0.660493951424109[/C][/ROW]
[/TABLE]
Source: https://freestatistics.org/blog/index.php?pk=309578&T=2

Globally Unique Identifier (entire table): ba.freestatistics.org/blog/index.php?pk=309578&T=2

As an alternative you can also use a QR Code:  

The GUIDs for individual cells are displayed in the table below:

Regression: S.E.(k) = alpha + beta * Mean(k)
alpha69.3545003674811
beta0.0154265316148539
S.D.0.0334051886870124
T-STAT0.461800463376865
p-value0.660493951424109


Regression: ln S.E.(k) = alpha + beta * ln Mean(k)
alpha3.33575134369528
beta0.160098027748476
S.D.0.248146489646086
T-STAT0.64517546863876
p-value0.542681298059994
Lambda0.839901972251524

\begin{tabular}{lllllllll}
\hline
Regression: ln S.E.(k) = alpha + beta * ln Mean(k) \tabularnewline
alpha & 3.33575134369528 \tabularnewline
beta & 0.160098027748476 \tabularnewline
S.D. & 0.248146489646086 \tabularnewline
T-STAT & 0.64517546863876 \tabularnewline
p-value & 0.542681298059994 \tabularnewline
Lambda & 0.839901972251524 \tabularnewline
\hline
\end{tabular}
%Source: https://freestatistics.org/blog/index.php?pk=309578&T=3

[TABLE]
[ROW][C]Regression: ln S.E.(k) = alpha + beta * ln Mean(k)[/C][/ROW]
[ROW][C]alpha[/C][C]3.33575134369528[/C][/ROW]
[ROW][C]beta[/C][C]0.160098027748476[/C][/ROW]
[ROW][C]S.D.[/C][C]0.248146489646086[/C][/ROW]
[ROW][C]T-STAT[/C][C]0.64517546863876[/C][/ROW]
[ROW][C]p-value[/C][C]0.542681298059994[/C][/ROW]
[ROW][C]Lambda[/C][C]0.839901972251524[/C][/ROW]
[/TABLE]
Source: https://freestatistics.org/blog/index.php?pk=309578&T=3

Globally Unique Identifier (entire table): ba.freestatistics.org/blog/index.php?pk=309578&T=3

As an alternative you can also use a QR Code:  

The GUIDs for individual cells are displayed in the table below:

Regression: ln S.E.(k) = alpha + beta * ln Mean(k)
alpha3.33575134369528
beta0.160098027748476
S.D.0.248146489646086
T-STAT0.64517546863876
p-value0.542681298059994
Lambda0.839901972251524


Parameters (Session):
par1 = 12 ;
Parameters (R input):
par1 = 12 ;
R code (references can be found in the software module):
par1 <- as.numeric(par1)
(n <- length(x))
(np <- floor(n / par1))
arr <- array(NA,dim=c(par1,np))
j <- 0
k <- 1
for (i in 1:(np*par1))
{
j = j + 1
arr[j,k] <- x[i]
if (j == par1) {
j = 0
k=k+1
}
}
arr
arr.mean <- array(NA,dim=np)
arr.sd <- array(NA,dim=np)
arr.range <- array(NA,dim=np)
for (j in 1:np)
{
arr.mean[j] <- mean(arr[,j],na.rm=TRUE)
arr.sd[j] <- sd(arr[,j],na.rm=TRUE)
arr.range[j] <- max(arr[,j],na.rm=TRUE) - min(arr[,j],na.rm=TRUE)
}
arr.mean
arr.sd
arr.range
(lm1 <- lm(arr.sd~arr.mean))
(lnlm1 <- lm(log(arr.sd)~log(arr.mean)))
(lm2 <- lm(arr.range~arr.mean))
bitmap(file='test1.png')
plot(arr.mean,arr.sd,main='Standard Deviation-Mean Plot',xlab='mean',ylab='standard deviation')
dev.off()
bitmap(file='test2.png')
plot(arr.mean,arr.range,main='Range-Mean Plot',xlab='mean',ylab='range')
dev.off()
load(file='createtable')
a<-table.start()
a<-table.row.start(a)
a<-table.element(a,'Standard Deviation-Mean Plot',4,TRUE)
a<-table.row.end(a)
a<-table.row.start(a)
a<-table.element(a,'Section',header=TRUE)
a<-table.element(a,'Mean',header=TRUE)
a<-table.element(a,'Standard Deviation',header=TRUE)
a<-table.element(a,'Range',header=TRUE)
a<-table.row.end(a)
for (j in 1:np) {
a<-table.row.start(a)
a<-table.element(a,j,header=TRUE)
a<-table.element(a,arr.mean[j])
a<-table.element(a,arr.sd[j] )
a<-table.element(a,arr.range[j] )
a<-table.row.end(a)
}
a<-table.end(a)
table.save(a,file='mytable.tab')
a<-table.start()
a<-table.row.start(a)
a<-table.element(a,'Regression: S.E.(k) = alpha + beta * Mean(k)',2,TRUE)
a<-table.row.end(a)
a<-table.row.start(a)
a<-table.element(a,'alpha',header=TRUE)
a<-table.element(a,lm1$coefficients[[1]])
a<-table.row.end(a)
a<-table.row.start(a)
a<-table.element(a,'beta',header=TRUE)
a<-table.element(a,lm1$coefficients[[2]])
a<-table.row.end(a)
a<-table.row.start(a)
a<-table.element(a,'S.D.',header=TRUE)
a<-table.element(a,summary(lm1)$coefficients[2,2])
a<-table.row.end(a)
a<-table.row.start(a)
a<-table.element(a,'T-STAT',header=TRUE)
a<-table.element(a,summary(lm1)$coefficients[2,3])
a<-table.row.end(a)
a<-table.row.start(a)
a<-table.element(a,'p-value',header=TRUE)
a<-table.element(a,summary(lm1)$coefficients[2,4])
a<-table.row.end(a)
a<-table.end(a)
table.save(a,file='mytable1.tab')
a<-table.start()
a<-table.row.start(a)
a<-table.element(a,'Regression: ln S.E.(k) = alpha + beta * ln Mean(k)',2,TRUE)
a<-table.row.end(a)
a<-table.row.start(a)
a<-table.element(a,'alpha',header=TRUE)
a<-table.element(a,lnlm1$coefficients[[1]])
a<-table.row.end(a)
a<-table.row.start(a)
a<-table.element(a,'beta',header=TRUE)
a<-table.element(a,lnlm1$coefficients[[2]])
a<-table.row.end(a)
a<-table.row.start(a)
a<-table.element(a,'S.D.',header=TRUE)
a<-table.element(a,summary(lnlm1)$coefficients[2,2])
a<-table.row.end(a)
a<-table.row.start(a)
a<-table.element(a,'T-STAT',header=TRUE)
a<-table.element(a,summary(lnlm1)$coefficients[2,3])
a<-table.row.end(a)
a<-table.row.start(a)
a<-table.element(a,'p-value',header=TRUE)
a<-table.element(a,summary(lnlm1)$coefficients[2,4])
a<-table.row.end(a)
a<-table.row.start(a)
a<-table.element(a,'Lambda',header=TRUE)
a<-table.element(a,1-lnlm1$coefficients[[2]])
a<-table.row.end(a)
a<-table.end(a)
table.save(a,file='mytable2.tab')