Free Statistics

of Irreproducible Research!

Author's title

Author*The author of this computation has been verified*
R Software Modulerwasp_autocorrelation.wasp
Title produced by software(Partial) Autocorrelation Function
Date of computationThu, 14 Dec 2017 17:21:11 +0100
Cite this page as followsStatistical Computations at FreeStatistics.org, Office for Research Development and Education, URL https://freestatistics.org/blog/index.php?v=date/2017/Dec/14/t1513269017iseu28589ebi9k3.htm/, Retrieved Tue, 14 May 2024 22:09:10 +0000
Statistical Computations at FreeStatistics.org, Office for Research Development and Education, URL https://freestatistics.org/blog/index.php?pk=309553, Retrieved Tue, 14 May 2024 22:09:10 +0000
QR Codes:

Original text written by user:
IsPrivate?No (this computation is public)
User-defined keywords
Estimated Impact99
Family? (F = Feedback message, R = changed R code, M = changed R Module, P = changed Parameters, D = changed Data)
-       [(Partial) Autocorrelation Function] [Partial autocorre...] [2017-12-14 16:21:11] [dd1b1eac6490c5f5f771b5814b2d0001] [Current]
Feedback Forum

Post a new message
Dataseries X:
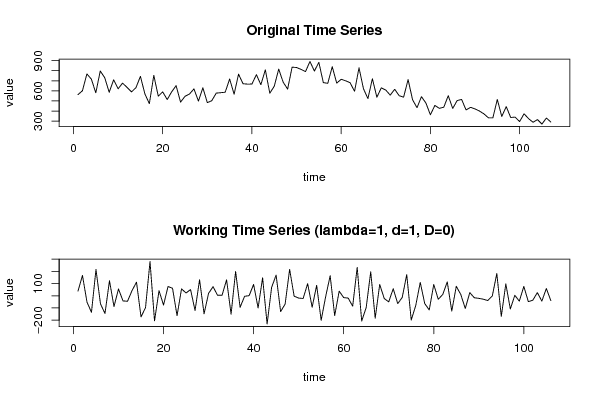
563
601
768
717
581
797
731
586
710
621
677
635
590
632
744
571
473
754
548
590
514
590
652
489
546
569
620
499
631
483
503
578
582
587
718
567
766
671
667
668
761
661
809
577
646
816
686
618
835
832
813
791
891
797
883
682
675
840
677
715
700
681
596
829
621
524
721
537
630
608
558
616
552
538
712
513
433
543
479
363
456
427
438
552
426
504
515
411
437
421
400
372
333
332
515
346
444
336
340
296
373
325
289
315
271
331
291


Summary of computational transaction
Raw Input view raw input (R code)
Raw Outputview raw output of R engine
Computing time1 seconds
R ServerBig Analytics Cloud Computing Center

\begin{tabular}{lllllllll}
\hline
Summary of computational transaction \tabularnewline
Raw Input view raw input (R code)  \tabularnewline
Raw Outputview raw output of R engine  \tabularnewline
Computing time1 seconds \tabularnewline
R ServerBig Analytics Cloud Computing Center \tabularnewline
\hline
\end{tabular}
%Source: https://freestatistics.org/blog/index.php?pk=309553&T=0

[TABLE]
[ROW]
Summary of computational transaction[/C][/ROW] [ROW]Raw Input[/C] view raw input (R code) [/C][/ROW] [ROW]Raw Output[/C]view raw output of R engine [/C][/ROW] [ROW]Computing time[/C]1 seconds[/C][/ROW] [ROW]R Server[/C]Big Analytics Cloud Computing Center[/C][/ROW] [/TABLE] Source: https://freestatistics.org/blog/index.php?pk=309553&T=0

Globally Unique Identifier (entire table): ba.freestatistics.org/blog/index.php?pk=309553&T=0

As an alternative you can also use a QR Code:  

The GUIDs for individual cells are displayed in the table below:

Summary of computational transaction
Raw Input view raw input (R code)
Raw Outputview raw output of R engine
Computing time1 seconds
R ServerBig Analytics Cloud Computing Center


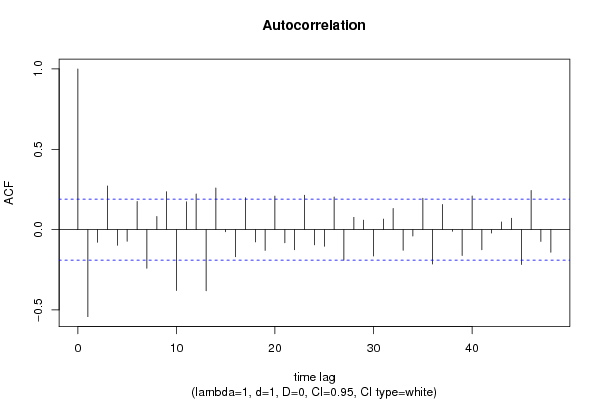
Autocorrelation Function
Time lag kACF(k)T-STATP-value
1-0.541985-5.58010
2-0.078394-0.80710.210704
30.2714132.79440.003087
4-0.09794-1.00840.15779
5-0.072806-0.74960.227583
60.1746791.79840.037478
7-0.24078-2.4790.007376
80.0820240.84450.200151
90.2356342.4260.008477
10-0.37959-3.90818.2e-05
110.172451.77550.039344
120.2217372.28290.012215
13-0.380639-3.91897.9e-05
140.2589342.66590.00444
15-0.013351-0.13750.445465
16-0.16902-1.74020.042366
170.1980012.03850.021992
18-0.076593-0.78860.216061
19-0.129669-1.3350.092365
200.2085232.14690.017041
21-0.081636-0.84050.201263
22-0.12584-1.29560.098963
230.214132.20460.014822
24-0.094993-0.9780.165147
25-0.103933-1.07010.143513
260.202592.08580.019699
27-0.190715-1.96350.026102
280.0759850.78230.217886
290.0587410.60480.273311
30-0.164594-1.69460.046544
310.0651710.6710.251847
320.1314791.35370.089362
33-0.128948-1.32760.093581
34-0.040481-0.41680.338842
350.1955082.01290.023331
36-0.214782-2.21130.014581
370.1564831.61110.055067
38-0.009932-0.10230.459372
39-0.161728-1.66510.049424
400.2093082.1550.016715
41-0.125711-1.29430.099192
42-0.021213-0.21840.413768
430.0474310.48830.31316
440.0703680.72450.235181
45-0.217202-2.23620.013716
460.2430882.50270.006925
47-0.073623-0.7580.225068
48-0.141452-1.45630.074128

\begin{tabular}{lllllllll}
\hline
Autocorrelation Function \tabularnewline
Time lag k & ACF(k) & T-STAT & P-value \tabularnewline
1 & -0.541985 & -5.5801 & 0 \tabularnewline
2 & -0.078394 & -0.8071 & 0.210704 \tabularnewline
3 & 0.271413 & 2.7944 & 0.003087 \tabularnewline
4 & -0.09794 & -1.0084 & 0.15779 \tabularnewline
5 & -0.072806 & -0.7496 & 0.227583 \tabularnewline
6 & 0.174679 & 1.7984 & 0.037478 \tabularnewline
7 & -0.24078 & -2.479 & 0.007376 \tabularnewline
8 & 0.082024 & 0.8445 & 0.200151 \tabularnewline
9 & 0.235634 & 2.426 & 0.008477 \tabularnewline
10 & -0.37959 & -3.9081 & 8.2e-05 \tabularnewline
11 & 0.17245 & 1.7755 & 0.039344 \tabularnewline
12 & 0.221737 & 2.2829 & 0.012215 \tabularnewline
13 & -0.380639 & -3.9189 & 7.9e-05 \tabularnewline
14 & 0.258934 & 2.6659 & 0.00444 \tabularnewline
15 & -0.013351 & -0.1375 & 0.445465 \tabularnewline
16 & -0.16902 & -1.7402 & 0.042366 \tabularnewline
17 & 0.198001 & 2.0385 & 0.021992 \tabularnewline
18 & -0.076593 & -0.7886 & 0.216061 \tabularnewline
19 & -0.129669 & -1.335 & 0.092365 \tabularnewline
20 & 0.208523 & 2.1469 & 0.017041 \tabularnewline
21 & -0.081636 & -0.8405 & 0.201263 \tabularnewline
22 & -0.12584 & -1.2956 & 0.098963 \tabularnewline
23 & 0.21413 & 2.2046 & 0.014822 \tabularnewline
24 & -0.094993 & -0.978 & 0.165147 \tabularnewline
25 & -0.103933 & -1.0701 & 0.143513 \tabularnewline
26 & 0.20259 & 2.0858 & 0.019699 \tabularnewline
27 & -0.190715 & -1.9635 & 0.026102 \tabularnewline
28 & 0.075985 & 0.7823 & 0.217886 \tabularnewline
29 & 0.058741 & 0.6048 & 0.273311 \tabularnewline
30 & -0.164594 & -1.6946 & 0.046544 \tabularnewline
31 & 0.065171 & 0.671 & 0.251847 \tabularnewline
32 & 0.131479 & 1.3537 & 0.089362 \tabularnewline
33 & -0.128948 & -1.3276 & 0.093581 \tabularnewline
34 & -0.040481 & -0.4168 & 0.338842 \tabularnewline
35 & 0.195508 & 2.0129 & 0.023331 \tabularnewline
36 & -0.214782 & -2.2113 & 0.014581 \tabularnewline
37 & 0.156483 & 1.6111 & 0.055067 \tabularnewline
38 & -0.009932 & -0.1023 & 0.459372 \tabularnewline
39 & -0.161728 & -1.6651 & 0.049424 \tabularnewline
40 & 0.209308 & 2.155 & 0.016715 \tabularnewline
41 & -0.125711 & -1.2943 & 0.099192 \tabularnewline
42 & -0.021213 & -0.2184 & 0.413768 \tabularnewline
43 & 0.047431 & 0.4883 & 0.31316 \tabularnewline
44 & 0.070368 & 0.7245 & 0.235181 \tabularnewline
45 & -0.217202 & -2.2362 & 0.013716 \tabularnewline
46 & 0.243088 & 2.5027 & 0.006925 \tabularnewline
47 & -0.073623 & -0.758 & 0.225068 \tabularnewline
48 & -0.141452 & -1.4563 & 0.074128 \tabularnewline
\hline
\end{tabular}
%Source: https://freestatistics.org/blog/index.php?pk=309553&T=1

[TABLE]
[ROW][C]Autocorrelation Function[/C][/ROW]
[ROW][C]Time lag k[/C][C]ACF(k)[/C][C]T-STAT[/C][C]P-value[/C][/ROW]
[ROW][C]1[/C][C]-0.541985[/C][C]-5.5801[/C][C]0[/C][/ROW]
[ROW][C]2[/C][C]-0.078394[/C][C]-0.8071[/C][C]0.210704[/C][/ROW]
[ROW][C]3[/C][C]0.271413[/C][C]2.7944[/C][C]0.003087[/C][/ROW]
[ROW][C]4[/C][C]-0.09794[/C][C]-1.0084[/C][C]0.15779[/C][/ROW]
[ROW][C]5[/C][C]-0.072806[/C][C]-0.7496[/C][C]0.227583[/C][/ROW]
[ROW][C]6[/C][C]0.174679[/C][C]1.7984[/C][C]0.037478[/C][/ROW]
[ROW][C]7[/C][C]-0.24078[/C][C]-2.479[/C][C]0.007376[/C][/ROW]
[ROW][C]8[/C][C]0.082024[/C][C]0.8445[/C][C]0.200151[/C][/ROW]
[ROW][C]9[/C][C]0.235634[/C][C]2.426[/C][C]0.008477[/C][/ROW]
[ROW][C]10[/C][C]-0.37959[/C][C]-3.9081[/C][C]8.2e-05[/C][/ROW]
[ROW][C]11[/C][C]0.17245[/C][C]1.7755[/C][C]0.039344[/C][/ROW]
[ROW][C]12[/C][C]0.221737[/C][C]2.2829[/C][C]0.012215[/C][/ROW]
[ROW][C]13[/C][C]-0.380639[/C][C]-3.9189[/C][C]7.9e-05[/C][/ROW]
[ROW][C]14[/C][C]0.258934[/C][C]2.6659[/C][C]0.00444[/C][/ROW]
[ROW][C]15[/C][C]-0.013351[/C][C]-0.1375[/C][C]0.445465[/C][/ROW]
[ROW][C]16[/C][C]-0.16902[/C][C]-1.7402[/C][C]0.042366[/C][/ROW]
[ROW][C]17[/C][C]0.198001[/C][C]2.0385[/C][C]0.021992[/C][/ROW]
[ROW][C]18[/C][C]-0.076593[/C][C]-0.7886[/C][C]0.216061[/C][/ROW]
[ROW][C]19[/C][C]-0.129669[/C][C]-1.335[/C][C]0.092365[/C][/ROW]
[ROW][C]20[/C][C]0.208523[/C][C]2.1469[/C][C]0.017041[/C][/ROW]
[ROW][C]21[/C][C]-0.081636[/C][C]-0.8405[/C][C]0.201263[/C][/ROW]
[ROW][C]22[/C][C]-0.12584[/C][C]-1.2956[/C][C]0.098963[/C][/ROW]
[ROW][C]23[/C][C]0.21413[/C][C]2.2046[/C][C]0.014822[/C][/ROW]
[ROW][C]24[/C][C]-0.094993[/C][C]-0.978[/C][C]0.165147[/C][/ROW]
[ROW][C]25[/C][C]-0.103933[/C][C]-1.0701[/C][C]0.143513[/C][/ROW]
[ROW][C]26[/C][C]0.20259[/C][C]2.0858[/C][C]0.019699[/C][/ROW]
[ROW][C]27[/C][C]-0.190715[/C][C]-1.9635[/C][C]0.026102[/C][/ROW]
[ROW][C]28[/C][C]0.075985[/C][C]0.7823[/C][C]0.217886[/C][/ROW]
[ROW][C]29[/C][C]0.058741[/C][C]0.6048[/C][C]0.273311[/C][/ROW]
[ROW][C]30[/C][C]-0.164594[/C][C]-1.6946[/C][C]0.046544[/C][/ROW]
[ROW][C]31[/C][C]0.065171[/C][C]0.671[/C][C]0.251847[/C][/ROW]
[ROW][C]32[/C][C]0.131479[/C][C]1.3537[/C][C]0.089362[/C][/ROW]
[ROW][C]33[/C][C]-0.128948[/C][C]-1.3276[/C][C]0.093581[/C][/ROW]
[ROW][C]34[/C][C]-0.040481[/C][C]-0.4168[/C][C]0.338842[/C][/ROW]
[ROW][C]35[/C][C]0.195508[/C][C]2.0129[/C][C]0.023331[/C][/ROW]
[ROW][C]36[/C][C]-0.214782[/C][C]-2.2113[/C][C]0.014581[/C][/ROW]
[ROW][C]37[/C][C]0.156483[/C][C]1.6111[/C][C]0.055067[/C][/ROW]
[ROW][C]38[/C][C]-0.009932[/C][C]-0.1023[/C][C]0.459372[/C][/ROW]
[ROW][C]39[/C][C]-0.161728[/C][C]-1.6651[/C][C]0.049424[/C][/ROW]
[ROW][C]40[/C][C]0.209308[/C][C]2.155[/C][C]0.016715[/C][/ROW]
[ROW][C]41[/C][C]-0.125711[/C][C]-1.2943[/C][C]0.099192[/C][/ROW]
[ROW][C]42[/C][C]-0.021213[/C][C]-0.2184[/C][C]0.413768[/C][/ROW]
[ROW][C]43[/C][C]0.047431[/C][C]0.4883[/C][C]0.31316[/C][/ROW]
[ROW][C]44[/C][C]0.070368[/C][C]0.7245[/C][C]0.235181[/C][/ROW]
[ROW][C]45[/C][C]-0.217202[/C][C]-2.2362[/C][C]0.013716[/C][/ROW]
[ROW][C]46[/C][C]0.243088[/C][C]2.5027[/C][C]0.006925[/C][/ROW]
[ROW][C]47[/C][C]-0.073623[/C][C]-0.758[/C][C]0.225068[/C][/ROW]
[ROW][C]48[/C][C]-0.141452[/C][C]-1.4563[/C][C]0.074128[/C][/ROW]
[/TABLE]
Source: https://freestatistics.org/blog/index.php?pk=309553&T=1

Globally Unique Identifier (entire table): ba.freestatistics.org/blog/index.php?pk=309553&T=1

As an alternative you can also use a QR Code:  

The GUIDs for individual cells are displayed in the table below:

Autocorrelation Function
Time lag kACF(k)T-STATP-value
1-0.541985-5.58010
2-0.078394-0.80710.210704
30.2714132.79440.003087
4-0.09794-1.00840.15779
5-0.072806-0.74960.227583
60.1746791.79840.037478
7-0.24078-2.4790.007376
80.0820240.84450.200151
90.2356342.4260.008477
10-0.37959-3.90818.2e-05
110.172451.77550.039344
120.2217372.28290.012215
13-0.380639-3.91897.9e-05
140.2589342.66590.00444
15-0.013351-0.13750.445465
16-0.16902-1.74020.042366
170.1980012.03850.021992
18-0.076593-0.78860.216061
19-0.129669-1.3350.092365
200.2085232.14690.017041
21-0.081636-0.84050.201263
22-0.12584-1.29560.098963
230.214132.20460.014822
24-0.094993-0.9780.165147
25-0.103933-1.07010.143513
260.202592.08580.019699
27-0.190715-1.96350.026102
280.0759850.78230.217886
290.0587410.60480.273311
30-0.164594-1.69460.046544
310.0651710.6710.251847
320.1314791.35370.089362
33-0.128948-1.32760.093581
34-0.040481-0.41680.338842
350.1955082.01290.023331
36-0.214782-2.21130.014581
370.1564831.61110.055067
38-0.009932-0.10230.459372
39-0.161728-1.66510.049424
400.2093082.1550.016715
41-0.125711-1.29430.099192
42-0.021213-0.21840.413768
430.0474310.48830.31316
440.0703680.72450.235181
45-0.217202-2.23620.013716
460.2430882.50270.006925
47-0.073623-0.7580.225068
48-0.141452-1.45630.074128


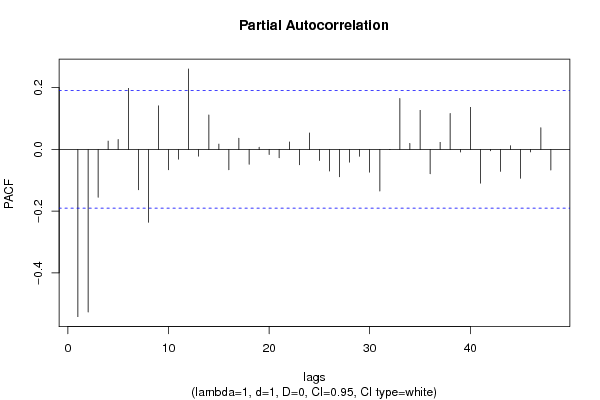
Partial Autocorrelation Function
Time lag kPACF(k)T-STATP-value
1-0.541985-5.58010
2-0.526924-5.4250
3-0.154947-1.59530.056814
40.0270990.2790.390392
50.0322120.33160.370408
60.1979172.03770.022036
7-0.130653-1.34520.090723
8-0.236261-2.43250.008336
90.1412421.45420.074427
10-0.065955-0.6790.249295
11-0.031423-0.32350.37347
120.2609232.68640.004194
13-0.021802-0.22450.411416
140.1115431.14840.126692
150.0172240.17730.429794
16-0.065645-0.67590.250301
170.0363280.3740.35457
18-0.047791-0.4920.311854
190.0069210.07130.471663
20-0.016405-0.16890.433098
21-0.027004-0.2780.390767
220.024030.24740.402535
23-0.049718-0.51190.3049
240.0531510.54720.292689
25-0.035728-0.36780.356862
26-0.069936-0.720.236544
27-0.088647-0.91270.181743
28-0.041183-0.4240.336212
29-0.021865-0.22510.411162
30-0.073537-0.75710.225332
31-0.1345-1.38480.084517
32-0.000728-0.00750.497016
330.1651011.69980.046049
340.0195990.20180.420236
350.1266571.3040.097527
36-0.0789-0.81230.209213
370.0229820.23660.406707
380.1166811.20130.116155
39-0.008167-0.08410.466574
400.1364771.40510.081456
41-0.109135-1.12360.131857
42-0.004319-0.04450.482308
43-0.071123-0.73230.232815
440.012150.12510.450342
45-0.093612-0.96380.168671
46-0.007988-0.08220.467306
470.0702840.72360.235447
48-0.066528-0.68490.247435

\begin{tabular}{lllllllll}
\hline
Partial Autocorrelation Function \tabularnewline
Time lag k & PACF(k) & T-STAT & P-value \tabularnewline
1 & -0.541985 & -5.5801 & 0 \tabularnewline
2 & -0.526924 & -5.425 & 0 \tabularnewline
3 & -0.154947 & -1.5953 & 0.056814 \tabularnewline
4 & 0.027099 & 0.279 & 0.390392 \tabularnewline
5 & 0.032212 & 0.3316 & 0.370408 \tabularnewline
6 & 0.197917 & 2.0377 & 0.022036 \tabularnewline
7 & -0.130653 & -1.3452 & 0.090723 \tabularnewline
8 & -0.236261 & -2.4325 & 0.008336 \tabularnewline
9 & 0.141242 & 1.4542 & 0.074427 \tabularnewline
10 & -0.065955 & -0.679 & 0.249295 \tabularnewline
11 & -0.031423 & -0.3235 & 0.37347 \tabularnewline
12 & 0.260923 & 2.6864 & 0.004194 \tabularnewline
13 & -0.021802 & -0.2245 & 0.411416 \tabularnewline
14 & 0.111543 & 1.1484 & 0.126692 \tabularnewline
15 & 0.017224 & 0.1773 & 0.429794 \tabularnewline
16 & -0.065645 & -0.6759 & 0.250301 \tabularnewline
17 & 0.036328 & 0.374 & 0.35457 \tabularnewline
18 & -0.047791 & -0.492 & 0.311854 \tabularnewline
19 & 0.006921 & 0.0713 & 0.471663 \tabularnewline
20 & -0.016405 & -0.1689 & 0.433098 \tabularnewline
21 & -0.027004 & -0.278 & 0.390767 \tabularnewline
22 & 0.02403 & 0.2474 & 0.402535 \tabularnewline
23 & -0.049718 & -0.5119 & 0.3049 \tabularnewline
24 & 0.053151 & 0.5472 & 0.292689 \tabularnewline
25 & -0.035728 & -0.3678 & 0.356862 \tabularnewline
26 & -0.069936 & -0.72 & 0.236544 \tabularnewline
27 & -0.088647 & -0.9127 & 0.181743 \tabularnewline
28 & -0.041183 & -0.424 & 0.336212 \tabularnewline
29 & -0.021865 & -0.2251 & 0.411162 \tabularnewline
30 & -0.073537 & -0.7571 & 0.225332 \tabularnewline
31 & -0.1345 & -1.3848 & 0.084517 \tabularnewline
32 & -0.000728 & -0.0075 & 0.497016 \tabularnewline
33 & 0.165101 & 1.6998 & 0.046049 \tabularnewline
34 & 0.019599 & 0.2018 & 0.420236 \tabularnewline
35 & 0.126657 & 1.304 & 0.097527 \tabularnewline
36 & -0.0789 & -0.8123 & 0.209213 \tabularnewline
37 & 0.022982 & 0.2366 & 0.406707 \tabularnewline
38 & 0.116681 & 1.2013 & 0.116155 \tabularnewline
39 & -0.008167 & -0.0841 & 0.466574 \tabularnewline
40 & 0.136477 & 1.4051 & 0.081456 \tabularnewline
41 & -0.109135 & -1.1236 & 0.131857 \tabularnewline
42 & -0.004319 & -0.0445 & 0.482308 \tabularnewline
43 & -0.071123 & -0.7323 & 0.232815 \tabularnewline
44 & 0.01215 & 0.1251 & 0.450342 \tabularnewline
45 & -0.093612 & -0.9638 & 0.168671 \tabularnewline
46 & -0.007988 & -0.0822 & 0.467306 \tabularnewline
47 & 0.070284 & 0.7236 & 0.235447 \tabularnewline
48 & -0.066528 & -0.6849 & 0.247435 \tabularnewline
\hline
\end{tabular}
%Source: https://freestatistics.org/blog/index.php?pk=309553&T=2

[TABLE]
[ROW][C]Partial Autocorrelation Function[/C][/ROW]
[ROW][C]Time lag k[/C][C]PACF(k)[/C][C]T-STAT[/C][C]P-value[/C][/ROW]
[ROW][C]1[/C][C]-0.541985[/C][C]-5.5801[/C][C]0[/C][/ROW]
[ROW][C]2[/C][C]-0.526924[/C][C]-5.425[/C][C]0[/C][/ROW]
[ROW][C]3[/C][C]-0.154947[/C][C]-1.5953[/C][C]0.056814[/C][/ROW]
[ROW][C]4[/C][C]0.027099[/C][C]0.279[/C][C]0.390392[/C][/ROW]
[ROW][C]5[/C][C]0.032212[/C][C]0.3316[/C][C]0.370408[/C][/ROW]
[ROW][C]6[/C][C]0.197917[/C][C]2.0377[/C][C]0.022036[/C][/ROW]
[ROW][C]7[/C][C]-0.130653[/C][C]-1.3452[/C][C]0.090723[/C][/ROW]
[ROW][C]8[/C][C]-0.236261[/C][C]-2.4325[/C][C]0.008336[/C][/ROW]
[ROW][C]9[/C][C]0.141242[/C][C]1.4542[/C][C]0.074427[/C][/ROW]
[ROW][C]10[/C][C]-0.065955[/C][C]-0.679[/C][C]0.249295[/C][/ROW]
[ROW][C]11[/C][C]-0.031423[/C][C]-0.3235[/C][C]0.37347[/C][/ROW]
[ROW][C]12[/C][C]0.260923[/C][C]2.6864[/C][C]0.004194[/C][/ROW]
[ROW][C]13[/C][C]-0.021802[/C][C]-0.2245[/C][C]0.411416[/C][/ROW]
[ROW][C]14[/C][C]0.111543[/C][C]1.1484[/C][C]0.126692[/C][/ROW]
[ROW][C]15[/C][C]0.017224[/C][C]0.1773[/C][C]0.429794[/C][/ROW]
[ROW][C]16[/C][C]-0.065645[/C][C]-0.6759[/C][C]0.250301[/C][/ROW]
[ROW][C]17[/C][C]0.036328[/C][C]0.374[/C][C]0.35457[/C][/ROW]
[ROW][C]18[/C][C]-0.047791[/C][C]-0.492[/C][C]0.311854[/C][/ROW]
[ROW][C]19[/C][C]0.006921[/C][C]0.0713[/C][C]0.471663[/C][/ROW]
[ROW][C]20[/C][C]-0.016405[/C][C]-0.1689[/C][C]0.433098[/C][/ROW]
[ROW][C]21[/C][C]-0.027004[/C][C]-0.278[/C][C]0.390767[/C][/ROW]
[ROW][C]22[/C][C]0.02403[/C][C]0.2474[/C][C]0.402535[/C][/ROW]
[ROW][C]23[/C][C]-0.049718[/C][C]-0.5119[/C][C]0.3049[/C][/ROW]
[ROW][C]24[/C][C]0.053151[/C][C]0.5472[/C][C]0.292689[/C][/ROW]
[ROW][C]25[/C][C]-0.035728[/C][C]-0.3678[/C][C]0.356862[/C][/ROW]
[ROW][C]26[/C][C]-0.069936[/C][C]-0.72[/C][C]0.236544[/C][/ROW]
[ROW][C]27[/C][C]-0.088647[/C][C]-0.9127[/C][C]0.181743[/C][/ROW]
[ROW][C]28[/C][C]-0.041183[/C][C]-0.424[/C][C]0.336212[/C][/ROW]
[ROW][C]29[/C][C]-0.021865[/C][C]-0.2251[/C][C]0.411162[/C][/ROW]
[ROW][C]30[/C][C]-0.073537[/C][C]-0.7571[/C][C]0.225332[/C][/ROW]
[ROW][C]31[/C][C]-0.1345[/C][C]-1.3848[/C][C]0.084517[/C][/ROW]
[ROW][C]32[/C][C]-0.000728[/C][C]-0.0075[/C][C]0.497016[/C][/ROW]
[ROW][C]33[/C][C]0.165101[/C][C]1.6998[/C][C]0.046049[/C][/ROW]
[ROW][C]34[/C][C]0.019599[/C][C]0.2018[/C][C]0.420236[/C][/ROW]
[ROW][C]35[/C][C]0.126657[/C][C]1.304[/C][C]0.097527[/C][/ROW]
[ROW][C]36[/C][C]-0.0789[/C][C]-0.8123[/C][C]0.209213[/C][/ROW]
[ROW][C]37[/C][C]0.022982[/C][C]0.2366[/C][C]0.406707[/C][/ROW]
[ROW][C]38[/C][C]0.116681[/C][C]1.2013[/C][C]0.116155[/C][/ROW]
[ROW][C]39[/C][C]-0.008167[/C][C]-0.0841[/C][C]0.466574[/C][/ROW]
[ROW][C]40[/C][C]0.136477[/C][C]1.4051[/C][C]0.081456[/C][/ROW]
[ROW][C]41[/C][C]-0.109135[/C][C]-1.1236[/C][C]0.131857[/C][/ROW]
[ROW][C]42[/C][C]-0.004319[/C][C]-0.0445[/C][C]0.482308[/C][/ROW]
[ROW][C]43[/C][C]-0.071123[/C][C]-0.7323[/C][C]0.232815[/C][/ROW]
[ROW][C]44[/C][C]0.01215[/C][C]0.1251[/C][C]0.450342[/C][/ROW]
[ROW][C]45[/C][C]-0.093612[/C][C]-0.9638[/C][C]0.168671[/C][/ROW]
[ROW][C]46[/C][C]-0.007988[/C][C]-0.0822[/C][C]0.467306[/C][/ROW]
[ROW][C]47[/C][C]0.070284[/C][C]0.7236[/C][C]0.235447[/C][/ROW]
[ROW][C]48[/C][C]-0.066528[/C][C]-0.6849[/C][C]0.247435[/C][/ROW]
[/TABLE]
Source: https://freestatistics.org/blog/index.php?pk=309553&T=2

Globally Unique Identifier (entire table): ba.freestatistics.org/blog/index.php?pk=309553&T=2

As an alternative you can also use a QR Code:  

The GUIDs for individual cells are displayed in the table below:

Partial Autocorrelation Function
Time lag kPACF(k)T-STATP-value
1-0.541985-5.58010
2-0.526924-5.4250
3-0.154947-1.59530.056814
40.0270990.2790.390392
50.0322120.33160.370408
60.1979172.03770.022036
7-0.130653-1.34520.090723
8-0.236261-2.43250.008336
90.1412421.45420.074427
10-0.065955-0.6790.249295
11-0.031423-0.32350.37347
120.2609232.68640.004194
13-0.021802-0.22450.411416
140.1115431.14840.126692
150.0172240.17730.429794
16-0.065645-0.67590.250301
170.0363280.3740.35457
18-0.047791-0.4920.311854
190.0069210.07130.471663
20-0.016405-0.16890.433098
21-0.027004-0.2780.390767
220.024030.24740.402535
23-0.049718-0.51190.3049
240.0531510.54720.292689
25-0.035728-0.36780.356862
26-0.069936-0.720.236544
27-0.088647-0.91270.181743
28-0.041183-0.4240.336212
29-0.021865-0.22510.411162
30-0.073537-0.75710.225332
31-0.1345-1.38480.084517
32-0.000728-0.00750.497016
330.1651011.69980.046049
340.0195990.20180.420236
350.1266571.3040.097527
36-0.0789-0.81230.209213
370.0229820.23660.406707
380.1166811.20130.116155
39-0.008167-0.08410.466574
400.1364771.40510.081456
41-0.109135-1.12360.131857
42-0.004319-0.04450.482308
43-0.071123-0.73230.232815
440.012150.12510.450342
45-0.093612-0.96380.168671
46-0.007988-0.08220.467306
470.0702840.72360.235447
48-0.066528-0.68490.247435


Parameters (Session):
par1 = 48 ; par2 = 1 ; par3 = 1 ; par4 = 0 ; par5 = 12 ; par6 = White Noise ; par7 = 0.95 ;
Parameters (R input):
par1 = 48 ; par2 = 1 ; par3 = 1 ; par4 = 0 ; par5 = 12 ; par6 = White Noise ; par7 = 0.95 ; par8 = ;
R code (references can be found in the software module):
par8 <- ''
par7 <- '0.95'
par6 <- 'White Noise'
par5 <- '12'
par4 <- '0'
par3 <- '0'
par2 <- '1'
par1 <- '48'
if (par1 == 'Default') {
par1 = 10*log10(length(x))
} else {
par1 <- as.numeric(par1)
}
par2 <- as.numeric(par2)
par3 <- as.numeric(par3)
par4 <- as.numeric(par4)
par5 <- as.numeric(par5)
if (par6 == 'White Noise') par6 <- 'white' else par6 <- 'ma'
par7 <- as.numeric(par7)
if (par8 != '') par8 <- as.numeric(par8)
x <- na.omit(x)
ox <- x
if (par8 == '') {
if (par2 == 0) {
x <- log(x)
} else {
x <- (x ^ par2 - 1) / par2
}
} else {
x <- log(x,base=par8)
}
if (par3 > 0) x <- diff(x,lag=1,difference=par3)
if (par4 > 0) x <- diff(x,lag=par5,difference=par4)
bitmap(file='picts.png')
op <- par(mfrow=c(2,1))
plot(ox,type='l',main='Original Time Series',xlab='time',ylab='value')
if (par8=='') {
mytitle <- paste('Working Time Series (lambda=',par2,', d=',par3,', D=',par4,')',sep='')
mysub <- paste('(lambda=',par2,', d=',par3,', D=',par4,', CI=', par7, ', CI type=',par6,')',sep='')
} else {
mytitle <- paste('Working Time Series (base=',par8,', d=',par3,', D=',par4,')',sep='')
mysub <- paste('(base=',par8,', d=',par3,', D=',par4,', CI=', par7, ', CI type=',par6,')',sep='')
}
plot(x,type='l', main=mytitle,xlab='time',ylab='value')
par(op)
dev.off()
bitmap(file='pic1.png')
racf <- acf(x, par1, main='Autocorrelation', xlab='time lag', ylab='ACF', ci.type=par6, ci=par7, sub=mysub)
dev.off()
bitmap(file='pic2.png')
rpacf <- pacf(x,par1,main='Partial Autocorrelation',xlab='lags',ylab='PACF',sub=mysub)
dev.off()
(myacf <- c(racf$acf))
(mypacf <- c(rpacf$acf))
lengthx <- length(x)
sqrtn <- sqrt(lengthx)
load(file='createtable')
a<-table.start()
a<-table.row.start(a)
a<-table.element(a,'Autocorrelation Function',4,TRUE)
a<-table.row.end(a)
a<-table.row.start(a)
a<-table.element(a,'Time lag k',header=TRUE)
a<-table.element(a,'ACF(k)',header=TRUE)
a<-table.element(a,'T-STAT',header=TRUE)
a<-table.element(a,'P-value',header=TRUE)
a<-table.row.end(a)
for (i in 2:(par1+1)) {
a<-table.row.start(a)
a<-table.element(a,i-1,header=TRUE)
a<-table.element(a,round(myacf[i],6))
mytstat <- myacf[i]*sqrtn
a<-table.element(a,round(mytstat,4))
a<-table.element(a,round(1-pt(abs(mytstat),lengthx),6))
a<-table.row.end(a)
}
a<-table.end(a)
table.save(a,file='mytable.tab')
a<-table.start()
a<-table.row.start(a)
a<-table.element(a,'Partial Autocorrelation Function',4,TRUE)
a<-table.row.end(a)
a<-table.row.start(a)
a<-table.element(a,'Time lag k',header=TRUE)
a<-table.element(a,'PACF(k)',header=TRUE)
a<-table.element(a,'T-STAT',header=TRUE)
a<-table.element(a,'P-value',header=TRUE)
a<-table.row.end(a)
for (i in 1:par1) {
a<-table.row.start(a)
a<-table.element(a,i,header=TRUE)
a<-table.element(a,round(mypacf[i],6))
mytstat <- mypacf[i]*sqrtn
a<-table.element(a,round(mytstat,4))
a<-table.element(a,round(1-pt(abs(mytstat),lengthx),6))
a<-table.row.end(a)
}
a<-table.end(a)
table.save(a,file='mytable1.tab')