Free Statistics

of Irreproducible Research!

Author's title

Author*The author of this computation has been verified*
R Software Modulerwasp_arimaforecasting.wasp
Title produced by softwareARIMA Forecasting
Date of computationThu, 14 Dec 2017 13:10:36 +0100
Cite this page as followsStatistical Computations at FreeStatistics.org, Office for Research Development and Education, URL https://freestatistics.org/blog/index.php?v=date/2017/Dec/14/t1513253781lb6kh7eej2p3mr0.htm/, Retrieved Tue, 14 May 2024 10:11:51 +0000
Statistical Computations at FreeStatistics.org, Office for Research Development and Education, URL https://freestatistics.org/blog/index.php?pk=309477, Retrieved Tue, 14 May 2024 10:11:51 +0000
QR Codes:

Original text written by user:
IsPrivate?No (this computation is public)
User-defined keywords
Estimated Impact60
Family? (F = Feedback message, R = changed R code, M = changed R Module, P = changed Parameters, D = changed Data)
-       [ARIMA Forecasting] [ARIMA forecasting...] [2017-12-14 12:10:36] [5c76e56d84d1440d36aad135bd2f9339] [Current]
Feedback Forum

Post a new message
Dataseries X:
18142
8613
8347
7054
5179
6785
7887
6926
6355
7533
6727
8215
13880
10484
9847
6952
9393
12870
9330
14726
10176.66667
7815
6419
9900
9999.833333
14523
12419
8923
11857
12676
14873
11711
15243
9751
7631
8161
10435
15188
10237
11642
16513
18632
15526
14991
10365
10369
10912
14476.83333
19891
17448
17876
11414
9452
15509
11286
13318
9298.833333
6850
4497
4333
7301
4323
6033
4513
4442
7666
6260
5339
3686
4549
3675
7356
8341
20001
9554
6334
4313
4161
7835
9109
7691
5091
7407
11632
17611
9481
7603
4485
10381
8796
10132
10163
17969
6695


Summary of computational transaction
Raw Input view raw input (R code)
Raw Outputview raw output of R engine
Computing time2 seconds
R ServerBig Analytics Cloud Computing Center

\begin{tabular}{lllllllll}
\hline
Summary of computational transaction \tabularnewline
Raw Input view raw input (R code)  \tabularnewline
Raw Outputview raw output of R engine  \tabularnewline
Computing time2 seconds \tabularnewline
R ServerBig Analytics Cloud Computing Center \tabularnewline
\hline
\end{tabular}
%Source: https://freestatistics.org/blog/index.php?pk=309477&T=0

[TABLE]
[ROW]
Summary of computational transaction[/C][/ROW] [ROW]Raw Input[/C] view raw input (R code) [/C][/ROW] [ROW]Raw Output[/C]view raw output of R engine [/C][/ROW] [ROW]Computing time[/C]2 seconds[/C][/ROW] [ROW]R Server[/C]Big Analytics Cloud Computing Center[/C][/ROW] [/TABLE] Source: https://freestatistics.org/blog/index.php?pk=309477&T=0

Globally Unique Identifier (entire table): ba.freestatistics.org/blog/index.php?pk=309477&T=0

As an alternative you can also use a QR Code:  

The GUIDs for individual cells are displayed in the table below:

Summary of computational transaction
Raw Input view raw input (R code)
Raw Outputview raw output of R engine
Computing time2 seconds
R ServerBig Analytics Cloud Computing Center


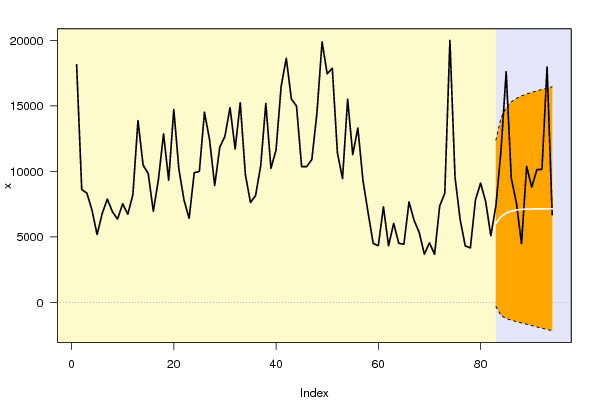
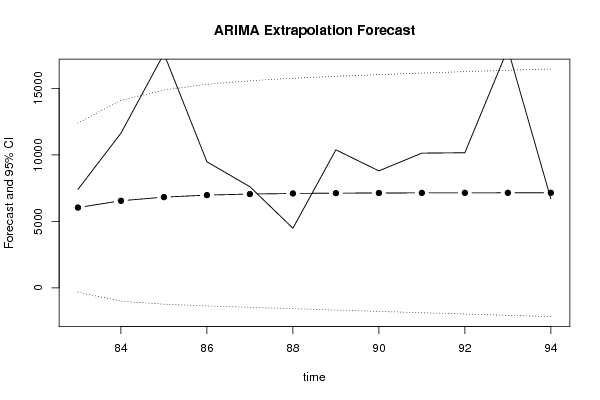
Univariate ARIMA Extrapolation Forecast
timeY[t]F[t]95% LB95% UBp-value(H0: Y[t] = F[t])P(F[t]>Y[t-1])P(F[t]>Y[t-s])P(F[t]>Y[82])
704549-------
713675-------
727356-------
738341-------
7420001-------
759554-------
766334-------
774313-------
784161-------
797835-------
809109-------
817691-------
825091-------
8374076037.6101-326.020712401.24090.33660.61470.76660.6147
84116326548.9389-998.340714096.21850.09340.41180.4170.6475
85176116825.1425-1229.057414879.34250.00430.1210.35610.6635
8694816974.3389-1359.167915307.84580.27770.00620.00110.6711
8776037054.9301-1465.724415575.58470.44980.28840.28270.6743
8844857098.463-1567.3915764.31590.27720.45460.56860.6751
89103817121.978-1668.282315912.23830.23370.72170.73450.6747
9087967134.6801-1768.959916038.320.35730.23740.74360.6736
91101327141.5413-1869.243416152.32610.25770.35950.44010.6722
92101637145.2476-1968.897916259.3930.25820.26030.33640.6707
93179697147.2496-2067.761116362.26020.01070.26060.4540.6691
9466957148.331-2165.742116462.4040.4620.01140.66750.6675

\begin{tabular}{lllllllll}
\hline
Univariate ARIMA Extrapolation Forecast \tabularnewline
time & Y[t] & F[t] & 95% LB & 95% UB & p-value(H0: Y[t] = F[t]) & P(F[t]>Y[t-1]) & P(F[t]>Y[t-s]) & P(F[t]>Y[82]) \tabularnewline
70 & 4549 & - & - & - & - & - & - & - \tabularnewline
71 & 3675 & - & - & - & - & - & - & - \tabularnewline
72 & 7356 & - & - & - & - & - & - & - \tabularnewline
73 & 8341 & - & - & - & - & - & - & - \tabularnewline
74 & 20001 & - & - & - & - & - & - & - \tabularnewline
75 & 9554 & - & - & - & - & - & - & - \tabularnewline
76 & 6334 & - & - & - & - & - & - & - \tabularnewline
77 & 4313 & - & - & - & - & - & - & - \tabularnewline
78 & 4161 & - & - & - & - & - & - & - \tabularnewline
79 & 7835 & - & - & - & - & - & - & - \tabularnewline
80 & 9109 & - & - & - & - & - & - & - \tabularnewline
81 & 7691 & - & - & - & - & - & - & - \tabularnewline
82 & 5091 & - & - & - & - & - & - & - \tabularnewline
83 & 7407 & 6037.6101 & -326.0207 & 12401.2409 & 0.3366 & 0.6147 & 0.7666 & 0.6147 \tabularnewline
84 & 11632 & 6548.9389 & -998.3407 & 14096.2185 & 0.0934 & 0.4118 & 0.417 & 0.6475 \tabularnewline
85 & 17611 & 6825.1425 & -1229.0574 & 14879.3425 & 0.0043 & 0.121 & 0.3561 & 0.6635 \tabularnewline
86 & 9481 & 6974.3389 & -1359.1679 & 15307.8458 & 0.2777 & 0.0062 & 0.0011 & 0.6711 \tabularnewline
87 & 7603 & 7054.9301 & -1465.7244 & 15575.5847 & 0.4498 & 0.2884 & 0.2827 & 0.6743 \tabularnewline
88 & 4485 & 7098.463 & -1567.39 & 15764.3159 & 0.2772 & 0.4546 & 0.5686 & 0.6751 \tabularnewline
89 & 10381 & 7121.978 & -1668.2823 & 15912.2383 & 0.2337 & 0.7217 & 0.7345 & 0.6747 \tabularnewline
90 & 8796 & 7134.6801 & -1768.9599 & 16038.32 & 0.3573 & 0.2374 & 0.7436 & 0.6736 \tabularnewline
91 & 10132 & 7141.5413 & -1869.2434 & 16152.3261 & 0.2577 & 0.3595 & 0.4401 & 0.6722 \tabularnewline
92 & 10163 & 7145.2476 & -1968.8979 & 16259.393 & 0.2582 & 0.2603 & 0.3364 & 0.6707 \tabularnewline
93 & 17969 & 7147.2496 & -2067.7611 & 16362.2602 & 0.0107 & 0.2606 & 0.454 & 0.6691 \tabularnewline
94 & 6695 & 7148.331 & -2165.7421 & 16462.404 & 0.462 & 0.0114 & 0.6675 & 0.6675 \tabularnewline
\hline
\end{tabular}
%Source: https://freestatistics.org/blog/index.php?pk=309477&T=1

[TABLE]
[ROW][C]Univariate ARIMA Extrapolation Forecast[/C][/ROW]
[ROW][C]time[/C][C]Y[t][/C][C]F[t][/C][C]95% LB[/C][C]95% UB[/C][C]p-value(H0: Y[t] = F[t])[/C][C]P(F[t]>Y[t-1])[/C][C]P(F[t]>Y[t-s])[/C][C]P(F[t]>Y[82])[/C][/ROW]
[ROW][C]70[/C][C]4549[/C][C]-[/C][C]-[/C][C]-[/C][C]-[/C][C]-[/C][C]-[/C][C]-[/C][/ROW]
[ROW][C]71[/C][C]3675[/C][C]-[/C][C]-[/C][C]-[/C][C]-[/C][C]-[/C][C]-[/C][C]-[/C][/ROW]
[ROW][C]72[/C][C]7356[/C][C]-[/C][C]-[/C][C]-[/C][C]-[/C][C]-[/C][C]-[/C][C]-[/C][/ROW]
[ROW][C]73[/C][C]8341[/C][C]-[/C][C]-[/C][C]-[/C][C]-[/C][C]-[/C][C]-[/C][C]-[/C][/ROW]
[ROW][C]74[/C][C]20001[/C][C]-[/C][C]-[/C][C]-[/C][C]-[/C][C]-[/C][C]-[/C][C]-[/C][/ROW]
[ROW][C]75[/C][C]9554[/C][C]-[/C][C]-[/C][C]-[/C][C]-[/C][C]-[/C][C]-[/C][C]-[/C][/ROW]
[ROW][C]76[/C][C]6334[/C][C]-[/C][C]-[/C][C]-[/C][C]-[/C][C]-[/C][C]-[/C][C]-[/C][/ROW]
[ROW][C]77[/C][C]4313[/C][C]-[/C][C]-[/C][C]-[/C][C]-[/C][C]-[/C][C]-[/C][C]-[/C][/ROW]
[ROW][C]78[/C][C]4161[/C][C]-[/C][C]-[/C][C]-[/C][C]-[/C][C]-[/C][C]-[/C][C]-[/C][/ROW]
[ROW][C]79[/C][C]7835[/C][C]-[/C][C]-[/C][C]-[/C][C]-[/C][C]-[/C][C]-[/C][C]-[/C][/ROW]
[ROW][C]80[/C][C]9109[/C][C]-[/C][C]-[/C][C]-[/C][C]-[/C][C]-[/C][C]-[/C][C]-[/C][/ROW]
[ROW][C]81[/C][C]7691[/C][C]-[/C][C]-[/C][C]-[/C][C]-[/C][C]-[/C][C]-[/C][C]-[/C][/ROW]
[ROW][C]82[/C][C]5091[/C][C]-[/C][C]-[/C][C]-[/C][C]-[/C][C]-[/C][C]-[/C][C]-[/C][/ROW]
[ROW][C]83[/C][C]7407[/C][C]6037.6101[/C][C]-326.0207[/C][C]12401.2409[/C][C]0.3366[/C][C]0.6147[/C][C]0.7666[/C][C]0.6147[/C][/ROW]
[ROW][C]84[/C][C]11632[/C][C]6548.9389[/C][C]-998.3407[/C][C]14096.2185[/C][C]0.0934[/C][C]0.4118[/C][C]0.417[/C][C]0.6475[/C][/ROW]
[ROW][C]85[/C][C]17611[/C][C]6825.1425[/C][C]-1229.0574[/C][C]14879.3425[/C][C]0.0043[/C][C]0.121[/C][C]0.3561[/C][C]0.6635[/C][/ROW]
[ROW][C]86[/C][C]9481[/C][C]6974.3389[/C][C]-1359.1679[/C][C]15307.8458[/C][C]0.2777[/C][C]0.0062[/C][C]0.0011[/C][C]0.6711[/C][/ROW]
[ROW][C]87[/C][C]7603[/C][C]7054.9301[/C][C]-1465.7244[/C][C]15575.5847[/C][C]0.4498[/C][C]0.2884[/C][C]0.2827[/C][C]0.6743[/C][/ROW]
[ROW][C]88[/C][C]4485[/C][C]7098.463[/C][C]-1567.39[/C][C]15764.3159[/C][C]0.2772[/C][C]0.4546[/C][C]0.5686[/C][C]0.6751[/C][/ROW]
[ROW][C]89[/C][C]10381[/C][C]7121.978[/C][C]-1668.2823[/C][C]15912.2383[/C][C]0.2337[/C][C]0.7217[/C][C]0.7345[/C][C]0.6747[/C][/ROW]
[ROW][C]90[/C][C]8796[/C][C]7134.6801[/C][C]-1768.9599[/C][C]16038.32[/C][C]0.3573[/C][C]0.2374[/C][C]0.7436[/C][C]0.6736[/C][/ROW]
[ROW][C]91[/C][C]10132[/C][C]7141.5413[/C][C]-1869.2434[/C][C]16152.3261[/C][C]0.2577[/C][C]0.3595[/C][C]0.4401[/C][C]0.6722[/C][/ROW]
[ROW][C]92[/C][C]10163[/C][C]7145.2476[/C][C]-1968.8979[/C][C]16259.393[/C][C]0.2582[/C][C]0.2603[/C][C]0.3364[/C][C]0.6707[/C][/ROW]
[ROW][C]93[/C][C]17969[/C][C]7147.2496[/C][C]-2067.7611[/C][C]16362.2602[/C][C]0.0107[/C][C]0.2606[/C][C]0.454[/C][C]0.6691[/C][/ROW]
[ROW][C]94[/C][C]6695[/C][C]7148.331[/C][C]-2165.7421[/C][C]16462.404[/C][C]0.462[/C][C]0.0114[/C][C]0.6675[/C][C]0.6675[/C][/ROW]
[/TABLE]
Source: https://freestatistics.org/blog/index.php?pk=309477&T=1

Globally Unique Identifier (entire table): ba.freestatistics.org/blog/index.php?pk=309477&T=1

As an alternative you can also use a QR Code:  

The GUIDs for individual cells are displayed in the table below:

Univariate ARIMA Extrapolation Forecast
timeY[t]F[t]95% LB95% UBp-value(H0: Y[t] = F[t])P(F[t]>Y[t-1])P(F[t]>Y[t-s])P(F[t]>Y[82])
704549-------
713675-------
727356-------
738341-------
7420001-------
759554-------
766334-------
774313-------
784161-------
797835-------
809109-------
817691-------
825091-------
8374076037.6101-326.020712401.24090.33660.61470.76660.6147
84116326548.9389-998.340714096.21850.09340.41180.4170.6475
85176116825.1425-1229.057414879.34250.00430.1210.35610.6635
8694816974.3389-1359.167915307.84580.27770.00620.00110.6711
8776037054.9301-1465.724415575.58470.44980.28840.28270.6743
8844857098.463-1567.3915764.31590.27720.45460.56860.6751
89103817121.978-1668.282315912.23830.23370.72170.73450.6747
9087967134.6801-1768.959916038.320.35730.23740.74360.6736
91101327141.5413-1869.243416152.32610.25770.35950.44010.6722
92101637145.2476-1968.897916259.3930.25820.26030.33640.6707
93179697147.2496-2067.761116362.26020.01070.26060.4540.6691
9466957148.331-2165.742116462.4040.4620.01140.66750.6675


Univariate ARIMA Extrapolation Forecast Performance
time% S.E.PEMAPEsMAPESq.EMSERMSEScaledEMASE
830.53780.18490.18490.20371875228.7063000.29390.2939
840.5880.4370.31090.381425837510.273513856369.48993722.41451.09080.6924
850.60210.61250.41140.5486116334721.930148015820.30336929.34492.31471.2331
860.60960.26440.37470.48766283349.627537582702.63446130.47330.53791.0593
870.61620.07210.31420.405300380.569230126238.22135488.73740.11760.871
880.6229-0.58270.35890.41276830188.60226243563.28485122.8472-0.56090.8193
890.62970.31390.35250.40710621224.414724011800.58914900.18370.69940.8022
900.63670.18890.3320.38222759983.877521355323.50014621.1820.35650.7465
910.64370.29510.32790.37828942842.983119976158.99824469.46970.64180.7348
920.65080.29690.32480.37529106829.673918889226.06584346.17370.64760.7261
930.65780.60220.35010.4195117110282.352127818413.00095274.31642.32240.8712
940.6648-0.06770.32650.39205508.980425517337.66595051.4689-0.09730.8067

\begin{tabular}{lllllllll}
\hline
Univariate ARIMA Extrapolation Forecast Performance \tabularnewline
time & % S.E. & PE & MAPE & sMAPE & Sq.E & MSE & RMSE & ScaledE & MASE \tabularnewline
83 & 0.5378 & 0.1849 & 0.1849 & 0.2037 & 1875228.7063 & 0 & 0 & 0.2939 & 0.2939 \tabularnewline
84 & 0.588 & 0.437 & 0.3109 & 0.3814 & 25837510.2735 & 13856369.4899 & 3722.4145 & 1.0908 & 0.6924 \tabularnewline
85 & 0.6021 & 0.6125 & 0.4114 & 0.5486 & 116334721.9301 & 48015820.3033 & 6929.3449 & 2.3147 & 1.2331 \tabularnewline
86 & 0.6096 & 0.2644 & 0.3747 & 0.4876 & 6283349.6275 & 37582702.6344 & 6130.4733 & 0.5379 & 1.0593 \tabularnewline
87 & 0.6162 & 0.0721 & 0.3142 & 0.405 & 300380.5692 & 30126238.2213 & 5488.7374 & 0.1176 & 0.871 \tabularnewline
88 & 0.6229 & -0.5827 & 0.3589 & 0.4127 & 6830188.602 & 26243563.2848 & 5122.8472 & -0.5609 & 0.8193 \tabularnewline
89 & 0.6297 & 0.3139 & 0.3525 & 0.407 & 10621224.4147 & 24011800.5891 & 4900.1837 & 0.6994 & 0.8022 \tabularnewline
90 & 0.6367 & 0.1889 & 0.332 & 0.3822 & 2759983.8775 & 21355323.5001 & 4621.182 & 0.3565 & 0.7465 \tabularnewline
91 & 0.6437 & 0.2951 & 0.3279 & 0.3782 & 8942842.9831 & 19976158.9982 & 4469.4697 & 0.6418 & 0.7348 \tabularnewline
92 & 0.6508 & 0.2969 & 0.3248 & 0.3752 & 9106829.6739 & 18889226.0658 & 4346.1737 & 0.6476 & 0.7261 \tabularnewline
93 & 0.6578 & 0.6022 & 0.3501 & 0.4195 & 117110282.3521 & 27818413.0009 & 5274.3164 & 2.3224 & 0.8712 \tabularnewline
94 & 0.6648 & -0.0677 & 0.3265 & 0.39 & 205508.9804 & 25517337.6659 & 5051.4689 & -0.0973 & 0.8067 \tabularnewline
\hline
\end{tabular}
%Source: https://freestatistics.org/blog/index.php?pk=309477&T=2

[TABLE]
[ROW][C]Univariate ARIMA Extrapolation Forecast Performance[/C][/ROW]
[ROW][C]time[/C][C]% S.E.[/C][C]PE[/C][C]MAPE[/C][C]sMAPE[/C][C]Sq.E[/C][C]MSE[/C][C]RMSE[/C][C]ScaledE[/C][C]MASE[/C][/ROW]
[ROW][C]83[/C][C]0.5378[/C][C]0.1849[/C][C]0.1849[/C][C]0.2037[/C][C]1875228.7063[/C][C]0[/C][C]0[/C][C]0.2939[/C][C]0.2939[/C][/ROW]
[ROW][C]84[/C][C]0.588[/C][C]0.437[/C][C]0.3109[/C][C]0.3814[/C][C]25837510.2735[/C][C]13856369.4899[/C][C]3722.4145[/C][C]1.0908[/C][C]0.6924[/C][/ROW]
[ROW][C]85[/C][C]0.6021[/C][C]0.6125[/C][C]0.4114[/C][C]0.5486[/C][C]116334721.9301[/C][C]48015820.3033[/C][C]6929.3449[/C][C]2.3147[/C][C]1.2331[/C][/ROW]
[ROW][C]86[/C][C]0.6096[/C][C]0.2644[/C][C]0.3747[/C][C]0.4876[/C][C]6283349.6275[/C][C]37582702.6344[/C][C]6130.4733[/C][C]0.5379[/C][C]1.0593[/C][/ROW]
[ROW][C]87[/C][C]0.6162[/C][C]0.0721[/C][C]0.3142[/C][C]0.405[/C][C]300380.5692[/C][C]30126238.2213[/C][C]5488.7374[/C][C]0.1176[/C][C]0.871[/C][/ROW]
[ROW][C]88[/C][C]0.6229[/C][C]-0.5827[/C][C]0.3589[/C][C]0.4127[/C][C]6830188.602[/C][C]26243563.2848[/C][C]5122.8472[/C][C]-0.5609[/C][C]0.8193[/C][/ROW]
[ROW][C]89[/C][C]0.6297[/C][C]0.3139[/C][C]0.3525[/C][C]0.407[/C][C]10621224.4147[/C][C]24011800.5891[/C][C]4900.1837[/C][C]0.6994[/C][C]0.8022[/C][/ROW]
[ROW][C]90[/C][C]0.6367[/C][C]0.1889[/C][C]0.332[/C][C]0.3822[/C][C]2759983.8775[/C][C]21355323.5001[/C][C]4621.182[/C][C]0.3565[/C][C]0.7465[/C][/ROW]
[ROW][C]91[/C][C]0.6437[/C][C]0.2951[/C][C]0.3279[/C][C]0.3782[/C][C]8942842.9831[/C][C]19976158.9982[/C][C]4469.4697[/C][C]0.6418[/C][C]0.7348[/C][/ROW]
[ROW][C]92[/C][C]0.6508[/C][C]0.2969[/C][C]0.3248[/C][C]0.3752[/C][C]9106829.6739[/C][C]18889226.0658[/C][C]4346.1737[/C][C]0.6476[/C][C]0.7261[/C][/ROW]
[ROW][C]93[/C][C]0.6578[/C][C]0.6022[/C][C]0.3501[/C][C]0.4195[/C][C]117110282.3521[/C][C]27818413.0009[/C][C]5274.3164[/C][C]2.3224[/C][C]0.8712[/C][/ROW]
[ROW][C]94[/C][C]0.6648[/C][C]-0.0677[/C][C]0.3265[/C][C]0.39[/C][C]205508.9804[/C][C]25517337.6659[/C][C]5051.4689[/C][C]-0.0973[/C][C]0.8067[/C][/ROW]
[/TABLE]
Source: https://freestatistics.org/blog/index.php?pk=309477&T=2

Globally Unique Identifier (entire table): ba.freestatistics.org/blog/index.php?pk=309477&T=2

As an alternative you can also use a QR Code:  

The GUIDs for individual cells are displayed in the table below:

Univariate ARIMA Extrapolation Forecast Performance
time% S.E.PEMAPEsMAPESq.EMSERMSEScaledEMASE
830.53780.18490.18490.20371875228.7063000.29390.2939
840.5880.4370.31090.381425837510.273513856369.48993722.41451.09080.6924
850.60210.61250.41140.5486116334721.930148015820.30336929.34492.31471.2331
860.60960.26440.37470.48766283349.627537582702.63446130.47330.53791.0593
870.61620.07210.31420.405300380.569230126238.22135488.73740.11760.871
880.6229-0.58270.35890.41276830188.60226243563.28485122.8472-0.56090.8193
890.62970.31390.35250.40710621224.414724011800.58914900.18370.69940.8022
900.63670.18890.3320.38222759983.877521355323.50014621.1820.35650.7465
910.64370.29510.32790.37828942842.983119976158.99824469.46970.64180.7348
920.65080.29690.32480.37529106829.673918889226.06584346.17370.64760.7261
930.65780.60220.35010.4195117110282.352127818413.00095274.31642.32240.8712
940.6648-0.06770.32650.39205508.980425517337.66595051.4689-0.09730.8067


Parameters (Session):
par1 = 12 ;
Parameters (R input):
par1 = 12 ; par2 = 1 ; par3 = 1 ; par4 = 0 ; par5 = 12 ; par6 = 1 ; par7 = 1 ; par8 = 0 ; par9 = 0 ; par10 = FALSE ;
R code (references can be found in the software module):
par10 <- 'FALSE'
par9 <- '0'
par8 <- '0'
par7 <- '1'
par6 <- '1'
par5 <- '12'
par4 <- '0'
par3 <- '1'
par2 <- '1'
par1 <- '12'
par1 <- as.numeric(par1) #cut off periods
par2 <- as.numeric(par2) #lambda
par3 <- as.numeric(par3) #degree of non-seasonal differencing
par4 <- as.numeric(par4) #degree of seasonal differencing
par5 <- as.numeric(par5) #seasonal period
par6 <- as.numeric(par6) #p
par7 <- as.numeric(par7) #q
par8 <- as.numeric(par8) #P
par9 <- as.numeric(par9) #Q
if (par10 == 'TRUE') par10 <- TRUE
if (par10 == 'FALSE') par10 <- FALSE
if (par2 == 0) x <- log(x)
if (par2 != 0) x <- x^par2
lx <- length(x)
first <- lx - 2*par1
nx <- lx - par1
nx1 <- nx + 1
fx <- lx - nx
if (fx < 1) {
fx <- par5*2
nx1 <- lx + fx - 1
first <- lx - 2*fx
}
first <- 1
if (fx < 3) fx <- round(lx/10,0)
(arima.out <- arima(x[1:nx], order=c(par6,par3,par7), seasonal=list(order=c(par8,par4,par9), period=par5), include.mean=par10, method='ML'))
(forecast <- predict(arima.out,fx))
(lb <- forecast$pred - 1.96 * forecast$se)
(ub <- forecast$pred + 1.96 * forecast$se)
if (par2 == 0) {
x <- exp(x)
forecast$pred <- exp(forecast$pred)
lb <- exp(lb)
ub <- exp(ub)
}
if (par2 != 0) {
x <- x^(1/par2)
forecast$pred <- forecast$pred^(1/par2)
lb <- lb^(1/par2)
ub <- ub^(1/par2)
}
if (par2 < 0) {
olb <- lb
lb <- ub
ub <- olb
}
(actandfor <- c(x[1:nx], forecast$pred))
(perc.se <- (ub-forecast$pred)/1.96/forecast$pred)
bitmap(file='test1.png')
opar <- par(mar=c(4,4,2,2),las=1)
ylim <- c( min(x[first:nx],lb), max(x[first:nx],ub))
plot(x,ylim=ylim,type='n',xlim=c(first,lx))
usr <- par('usr')
rect(usr[1],usr[3],nx+1,usr[4],border=NA,col='lemonchiffon')
rect(nx1,usr[3],usr[2],usr[4],border=NA,col='lavender')
abline(h= (-3:3)*2 , col ='gray', lty =3)
polygon( c(nx1:lx,lx:nx1), c(lb,rev(ub)), col = 'orange', lty=2,border=NA)
lines(nx1:lx, lb , lty=2)
lines(nx1:lx, ub , lty=2)
lines(x, lwd=2)
lines(nx1:lx, forecast$pred , lwd=2 , col ='white')
box()
par(opar)
dev.off()
prob.dec <- array(NA, dim=fx)
prob.sdec <- array(NA, dim=fx)
prob.ldec <- array(NA, dim=fx)
prob.pval <- array(NA, dim=fx)
perf.pe <- array(0, dim=fx)
perf.spe <- array(0, dim=fx)
perf.scalederr <- array(0, dim=fx)
perf.mase <- array(0, dim=fx)
perf.mase1 <- array(0, dim=fx)
perf.mape <- array(0, dim=fx)
perf.smape <- array(0, dim=fx)
perf.mape1 <- array(0, dim=fx)
perf.smape1 <- array(0,dim=fx)
perf.se <- array(0, dim=fx)
perf.mse <- array(0, dim=fx)
perf.mse1 <- array(0, dim=fx)
perf.rmse <- array(0, dim=fx)
perf.scaleddenom <- 0
for (i in 2:fx) {
perf.scaleddenom = perf.scaleddenom + abs(x[nx+i] - x[nx+i-1])
}
perf.scaleddenom = perf.scaleddenom / (fx-1)
for (i in 1:fx) {
locSD <- (ub[i] - forecast$pred[i]) / 1.96
perf.scalederr[i] = (x[nx+i] - forecast$pred[i]) / perf.scaleddenom
perf.pe[i] = (x[nx+i] - forecast$pred[i]) / x[nx+i]
perf.spe[i] = 2*(x[nx+i] - forecast$pred[i]) / (x[nx+i] + forecast$pred[i])
perf.se[i] = (x[nx+i] - forecast$pred[i])^2
prob.dec[i] = pnorm((x[nx+i-1] - forecast$pred[i]) / locSD)
prob.sdec[i] = pnorm((x[nx+i-par5] - forecast$pred[i]) / locSD)
prob.ldec[i] = pnorm((x[nx] - forecast$pred[i]) / locSD)
prob.pval[i] = pnorm(abs(x[nx+i] - forecast$pred[i]) / locSD)
}
perf.mape[1] = abs(perf.pe[1])
perf.smape[1] = abs(perf.spe[1])
perf.mape1[1] = perf.mape[1]
perf.smape1[1] = perf.smape[1]
perf.mse[1] = perf.se[1]
perf.mase[1] = abs(perf.scalederr[1])
perf.mase1[1] = perf.mase[1]
for (i in 2:fx) {
perf.mape[i] = perf.mape[i-1] + abs(perf.pe[i])
perf.mape1[i] = perf.mape[i] / i
perf.smape[i] = perf.smape[i-1] + abs(perf.spe[i])
perf.smape1[i] = perf.smape[i] / i
perf.mse[i] = perf.mse[i-1] + perf.se[i]
perf.mse1[i] = perf.mse[i] / i
perf.mase[i] = perf.mase[i-1] + abs(perf.scalederr[i])
perf.mase1[i] = perf.mase[i] / i
}
perf.rmse = sqrt(perf.mse1)
bitmap(file='test2.png')
plot(forecast$pred, pch=19, type='b',main='ARIMA Extrapolation Forecast', ylab='Forecast and 95% CI', xlab='time',ylim=c(min(lb),max(ub)))
dum <- forecast$pred
dum[1:par1] <- x[(nx+1):lx]
lines(dum, lty=1)
lines(ub,lty=3)
lines(lb,lty=3)
dev.off()
load(file='createtable')
a<-table.start()
a<-table.row.start(a)
a<-table.element(a,'Univariate ARIMA Extrapolation Forecast',9,TRUE)
a<-table.row.end(a)
a<-table.row.start(a)
a<-table.element(a,'time',1,header=TRUE)
a<-table.element(a,'Y[t]',1,header=TRUE)
a<-table.element(a,'F[t]',1,header=TRUE)
a<-table.element(a,'95% LB',1,header=TRUE)
a<-table.element(a,'95% UB',1,header=TRUE)
a<-table.element(a,'p-value
(H0: Y[t] = F[t])',1,header=TRUE)
a<-table.element(a,'P(F[t]>Y[t-1])',1,header=TRUE)
a<-table.element(a,'P(F[t]>Y[t-s])',1,header=TRUE)
mylab <- paste('P(F[t]>Y[',nx,sep='')
mylab <- paste(mylab,'])',sep='')
a<-table.element(a,mylab,1,header=TRUE)
a<-table.row.end(a)
for (i in (nx-par5):nx) {
a<-table.row.start(a)
a<-table.element(a,i,header=TRUE)
a<-table.element(a,x[i])
a<-table.element(a,'-')
a<-table.row.end(a)
}
for (i in 1:fx) {
a<-table.row.start(a)
a<-table.element(a,nx+i,header=TRUE)
a<-table.element(a,round(x[nx+i],4))
a<-table.element(a,round(forecast$pred[i],4))
a<-table.element(a,round(lb[i],4))
a<-table.element(a,round(ub[i],4))
a<-table.element(a,round((1-prob.pval[i]),4))
a<-table.element(a,round((1-prob.dec[i]),4))
a<-table.element(a,round((1-prob.sdec[i]),4))
a<-table.element(a,round((1-prob.ldec[i]),4))
a<-table.row.end(a)
}
a<-table.end(a)
table.save(a,file='mytable.tab')
a<-table.start()
a<-table.row.start(a)
a<-table.element(a,'Univariate ARIMA Extrapolation Forecast Performance',10,TRUE)
a<-table.row.end(a)
a<-table.row.start(a)
a<-table.element(a,'time',1,header=TRUE)
a<-table.element(a,'% S.E.',1,header=TRUE)
a<-table.element(a,'PE',1,header=TRUE)
a<-table.element(a,'MAPE',1,header=TRUE)
a<-table.element(a,'sMAPE',1,header=TRUE)
a<-table.element(a,'Sq.E',1,header=TRUE)
a<-table.element(a,'MSE',1,header=TRUE)
a<-table.element(a,'RMSE',1,header=TRUE)
a<-table.element(a,'ScaledE',1,header=TRUE)
a<-table.element(a,'MASE',1,header=TRUE)
a<-table.row.end(a)
for (i in 1:fx) {
a<-table.row.start(a)
a<-table.element(a,nx+i,header=TRUE)
a<-table.element(a,round(perc.se[i],4))
a<-table.element(a,round(perf.pe[i],4))
a<-table.element(a,round(perf.mape1[i],4))
a<-table.element(a,round(perf.smape1[i],4))
a<-table.element(a,round(perf.se[i],4))
a<-table.element(a,round(perf.mse1[i],4))
a<-table.element(a,round(perf.rmse[i],4))
a<-table.element(a,round(perf.scalederr[i],4))
a<-table.element(a,round(perf.mase1[i],4))
a<-table.row.end(a)
}
a<-table.end(a)
table.save(a,file='mytable1.tab')