Free Statistics

of Irreproducible Research!

Author's title

Author*The author of this computation has been verified*
R Software Modulerwasp_Two Factor ANOVA.wasp
Title produced by softwareTwo-Way ANOVA
Date of computationThu, 14 Dec 2017 12:44:13 +0100
Cite this page as followsStatistical Computations at FreeStatistics.org, Office for Research Development and Education, URL https://freestatistics.org/blog/index.php?v=date/2017/Dec/14/t1513251942v6ytvpfvdy74ai2.htm/, Retrieved Tue, 14 May 2024 10:36:50 +0000
Statistical Computations at FreeStatistics.org, Office for Research Development and Education, URL https://freestatistics.org/blog/index.php?pk=309470, Retrieved Tue, 14 May 2024 10:36:50 +0000
QR Codes:

Original text written by user:
IsPrivate?No (this computation is public)
User-defined keywords
Estimated Impact103
Family? (F = Feedback message, R = changed R code, M = changed R Module, P = changed Parameters, D = changed Data)
-       [Two-Way ANOVA] [Anova2 ] [2017-12-14 11:44:13] [fda4350e119ddbaf0177fa3308cc9af4] [Current]
Feedback Forum

Post a new message
Dataseries X:
1077	'AA'	'WEATHERDELAY'
120	'AA'	'WEATHERDELAY'
121	'AA'	'NA '
121	'AA'	'NA '
127	'AA'	'NA '
129	'AA'	'NA '
130	'AA'	'NA '
131	'AA'	'NA '
132	'AA'	'NA '
132	'AA'	'NA '
136	'AA'	'NA '
137	'AA'	'NA '
137	'AA'	'NA '
141	'AA'	'NA '
142	'AA'	'NA '
144	'AA'	'NA '
149	'AA'	'NA '
152	'AA'	'NA '
158	'AA'	'NA '
159	'AA'	'NA '
161	'AA'	'NA '
189	'AA'	'NA '
190	'AA'	'NA '
192	'AA'	'NA '
200	'AA'	'NA '
208	'AA'	'NA '
208	'AA'	'WEATHERDELAY'
216	'AA'	'NA '
222	'AA'	'NA '
242	'AA'	'NA '
249	'AA'	'NA '
290	'AA'	'NA '
305	'AA'	'NA '
306	'AA'	'NA '
344	'AA'	'NA '
610	'AA'	'NA '
741	'AA'	'NA '
782	'AA'	'NA '
120	'B6'	'NA '
124	'B6'	'NA '
124	'B6'	'NA '
125	'B6'	'NA '
126	'B6'	'NA '
127	'B6'	'NA '
128	'B6'	'WEATHERDELAY'
131	'B6'	'NA '
133	'B6'	'NA '
135	'B6'	'NA '
135	'B6'	'NA '
137	'B6'	'NA '
139	'B6'	'NA '
140	'B6'	'NA '
142	'B6'	'NA '
142	'B6'	'NA '
143	'B6'	'NA '
145	'B6'	'NA '
147	'B6'	'NA '
148	'B6'	'NA '
150	'B6'	'NA '
153	'B6'	'NA '
154	'B6'	'NA '
157	'B6'	'NA '
158	'B6'	'NA '
175	'B6'	'NA '
178	'B6'	'NA '
178	'B6'	'NA '
190	'B6'	'NA '
191	'B6'	'NA '
192	'B6'	'NA '
192	'B6'	'NA '
193	'B6'	'NA '
195	'B6'	'NA '
195	'B6'	'NA '
207	'B6'	'NA '
218	'B6'	'NA '
219	'B6'	'NA '
224	'B6'	'NA '
227	'B6'	'NA '
228	'B6'	'NA '
234	'B6'	'NA '
234	'B6'	'NA '
242	'B6'	'NA '
244	'B6'	'NA '
259	'B6'	'NA '
273	'B6'	'WEATHERDELAY'
286	'B6'	'NA '
291	'B6'	'NA '
343	'B6'	'NA '
568	'B6'	'NA '
134	'DL'	'NA '
134	'DL'	'NA '
138	'DL'	'NA '
140	'DL'	'NA '
142	'DL'	'NA '
144	'DL'	'NA '
155	'DL'	'NA '
167	'DL'	'NA '
177	'DL'	'WEATHERDELAY'
179	'DL'	'NA '
179	'DL'	'WEATHERDELAY'
182	'DL'	'NA '
210	'DL'	'NA '
224	'DL'	'NA '
248	'DL'	'NA '
273	'DL'	'NA '
293	'DL'	'NA '
410	'DL'	'NA '
430	'DL'	'NA '
452	'DL'	'NA '
454	'DL'	'NA '
520	'DL'	'NA '
586	'DL'	'NA '
617	'DL'	'WEATHERDELAY'
659	'DL'	'NA '
759	'DL'	'WEATHERDELAY'
924	'DL'	'NA '
941	'DL'	'NA '


Summary of computational transaction
Raw Input view raw input (R code)
Raw Outputview raw output of R engine
Computing time5 seconds
R ServerBig Analytics Cloud Computing Center

\begin{tabular}{lllllllll}
\hline
Summary of computational transaction \tabularnewline
Raw Input view raw input (R code)  \tabularnewline
Raw Outputview raw output of R engine  \tabularnewline
Computing time5 seconds \tabularnewline
R ServerBig Analytics Cloud Computing Center \tabularnewline
\hline
\end{tabular}
%Source: https://freestatistics.org/blog/index.php?pk=309470&T=0

[TABLE]
[ROW]
Summary of computational transaction[/C][/ROW] [ROW]Raw Input[/C] view raw input (R code) [/C][/ROW] [ROW]Raw Output[/C]view raw output of R engine [/C][/ROW] [ROW]Computing time[/C]5 seconds[/C][/ROW] [ROW]R Server[/C]Big Analytics Cloud Computing Center[/C][/ROW] [/TABLE] Source: https://freestatistics.org/blog/index.php?pk=309470&T=0

Globally Unique Identifier (entire table): ba.freestatistics.org/blog/index.php?pk=309470&T=0

As an alternative you can also use a QR Code:  

The GUIDs for individual cells are displayed in the table below:

Summary of computational transaction
Raw Input view raw input (R code)
Raw Outputview raw output of R engine
Computing time5 seconds
R ServerBig Analytics Cloud Computing Center


ANOVA Model
Response ~ Treatment_A * Treatment_B
means226.429-37.898112.696241.905-229.935-148.03

\begin{tabular}{lllllllll}
\hline
ANOVA Model \tabularnewline
Response ~ Treatment_A * Treatment_B \tabularnewline
means & 226.429 & -37.898 & 112.696 & 241.905 & -229.935 & -148.03 \tabularnewline
\hline
\end{tabular}
%Source: https://freestatistics.org/blog/index.php?pk=309470&T=1

[TABLE]
[ROW][C]ANOVA Model[/C][/ROW]
[ROW][C]Response ~ Treatment_A * Treatment_B[/C][/ROW]
[ROW][C]means[/C][C]226.429[/C][C]-37.898[/C][C]112.696[/C][C]241.905[/C][C]-229.935[/C][C]-148.03[/C][/ROW]
[/TABLE]
Source: https://freestatistics.org/blog/index.php?pk=309470&T=1

Globally Unique Identifier (entire table): ba.freestatistics.org/blog/index.php?pk=309470&T=1

As an alternative you can also use a QR Code:  

The GUIDs for individual cells are displayed in the table below:

ANOVA Model
Response ~ Treatment_A * Treatment_B
means226.429-37.898112.696241.905-229.935-148.03


ANOVA Statistics
DfSum SqMean SqF valuePr(>F)
2
Treatment_A2483474.81241737.4057.9950.001
Treatment_B2126549.365126549.3654.1850.043
Treatment_A:Treatment_B265634.50632817.2531.0850.341
Residuals1113356392.56730237.771

\begin{tabular}{lllllllll}
\hline
ANOVA Statistics \tabularnewline
  & Df & Sum Sq & Mean Sq & F value & Pr(>F) \tabularnewline
 & 2 &  &  &  &  \tabularnewline
Treatment_A & 2 & 483474.81 & 241737.405 & 7.995 & 0.001 \tabularnewline
Treatment_B & 2 & 126549.365 & 126549.365 & 4.185 & 0.043 \tabularnewline
Treatment_A:Treatment_B & 2 & 65634.506 & 32817.253 & 1.085 & 0.341 \tabularnewline
Residuals & 111 & 3356392.567 & 30237.771 &   &   \tabularnewline
\hline
\end{tabular}
%Source: https://freestatistics.org/blog/index.php?pk=309470&T=2

[TABLE]
[ROW][C]ANOVA Statistics[/C][/ROW]
[ROW][C] [/C][C]Df[/C][C]Sum Sq[/C][C]Mean Sq[/C][C]F value[/C][C]Pr(>F)[/C][/ROW]
[ROW][C][/C][C]2[/C][C][/C][C][/C][C][/C][C][/C][/ROW]
[ROW][C]Treatment_A[/C][C]2[/C][C]483474.81[/C][C]241737.405[/C][C]7.995[/C][C]0.001[/C][/ROW]
[ROW][C]Treatment_B[/C][C]2[/C][C]126549.365[/C][C]126549.365[/C][C]4.185[/C][C]0.043[/C][/ROW]
[ROW][C]Treatment_A:Treatment_B[/C][C]2[/C][C]65634.506[/C][C]32817.253[/C][C]1.085[/C][C]0.341[/C][/ROW]
[ROW][C]Residuals[/C][C]111[/C][C]3356392.567[/C][C]30237.771[/C][C] [/C][C] [/C][/ROW]
[/TABLE]
Source: https://freestatistics.org/blog/index.php?pk=309470&T=2

Globally Unique Identifier (entire table): ba.freestatistics.org/blog/index.php?pk=309470&T=2

As an alternative you can also use a QR Code:  

The GUIDs for individual cells are displayed in the table below:

ANOVA Statistics
DfSum SqMean SqF valuePr(>F)
2
Treatment_A2483474.81241737.4057.9950.001
Treatment_B2126549.365126549.3654.1850.043
Treatment_A:Treatment_B265634.50632817.2531.0850.341
Residuals1113356392.56730237.771


Tukey Honest Significant Difference Comparisons
difflwruprp adj
B6-AA-56.526-145.0531.9970.287
DL-AA107.0094.127209.8920.039
DL-B6163.53666.375260.6960
WEATHERDELAY-NA,121.9692.42241.5170.046
B6:NA,-AA:NA,-37.898-149.50773.7110.922
DL:NA,-AA:NA,112.696-20.956246.3490.15
AA:WEATHERDELAY-AA:NA,241.905-61.476545.2850.198
B6:WEATHERDELAY-AA:NA,-25.929-392.571340.7131
DL:WEATHERDELAY-AA:NA,206.571-59.598472.7410.223
DL:NA,-B6:NA,150.59424.949276.240.009
AA:WEATHERDELAY-B6:NA,279.803-20.137579.7420.082
B6:WEATHERDELAY-B6:NA,11.969-351.83375.7691
DL:WEATHERDELAY-B6:NA,244.469-17.771506.710.083
AA:WEATHERDELAY-DL:NA,129.208-179.612438.0290.829
B6:WEATHERDELAY-DL:NA,-138.625-509.781232.5310.887
DL:WEATHERDELAY-DL:NA,93.875-178.479366.2290.917
B6:WEATHERDELAY-AA:WEATHERDELAY-267.833-728.196192.5290.543
DL:WEATHERDELAY-AA:WEATHERDELAY-35.333-420.5349.8331
DL:WEATHERDELAY-B6:WEATHERDELAY232.5-204.238669.2380.637

\begin{tabular}{lllllllll}
\hline
Tukey Honest Significant Difference Comparisons \tabularnewline
  & diff & lwr & upr & p adj \tabularnewline
B6-AA & -56.526 & -145.05 & 31.997 & 0.287 \tabularnewline
DL-AA & 107.009 & 4.127 & 209.892 & 0.039 \tabularnewline
DL-B6 & 163.536 & 66.375 & 260.696 & 0 \tabularnewline
WEATHERDELAY-NA, & 121.969 & 2.42 & 241.517 & 0.046 \tabularnewline
B6:NA,-AA:NA, & -37.898 & -149.507 & 73.711 & 0.922 \tabularnewline
DL:NA,-AA:NA, & 112.696 & -20.956 & 246.349 & 0.15 \tabularnewline
AA:WEATHERDELAY-AA:NA, & 241.905 & -61.476 & 545.285 & 0.198 \tabularnewline
B6:WEATHERDELAY-AA:NA, & -25.929 & -392.571 & 340.713 & 1 \tabularnewline
DL:WEATHERDELAY-AA:NA, & 206.571 & -59.598 & 472.741 & 0.223 \tabularnewline
DL:NA,-B6:NA, & 150.594 & 24.949 & 276.24 & 0.009 \tabularnewline
AA:WEATHERDELAY-B6:NA, & 279.803 & -20.137 & 579.742 & 0.082 \tabularnewline
B6:WEATHERDELAY-B6:NA, & 11.969 & -351.83 & 375.769 & 1 \tabularnewline
DL:WEATHERDELAY-B6:NA, & 244.469 & -17.771 & 506.71 & 0.083 \tabularnewline
AA:WEATHERDELAY-DL:NA, & 129.208 & -179.612 & 438.029 & 0.829 \tabularnewline
B6:WEATHERDELAY-DL:NA, & -138.625 & -509.781 & 232.531 & 0.887 \tabularnewline
DL:WEATHERDELAY-DL:NA, & 93.875 & -178.479 & 366.229 & 0.917 \tabularnewline
B6:WEATHERDELAY-AA:WEATHERDELAY & -267.833 & -728.196 & 192.529 & 0.543 \tabularnewline
DL:WEATHERDELAY-AA:WEATHERDELAY & -35.333 & -420.5 & 349.833 & 1 \tabularnewline
DL:WEATHERDELAY-B6:WEATHERDELAY & 232.5 & -204.238 & 669.238 & 0.637 \tabularnewline
\hline
\end{tabular}
%Source: https://freestatistics.org/blog/index.php?pk=309470&T=3

[TABLE]
[ROW][C]Tukey Honest Significant Difference Comparisons[/C][/ROW]
[ROW][C] [/C][C]diff[/C][C]lwr[/C][C]upr[/C][C]p adj[/C][/ROW]
[ROW][C]B6-AA[/C][C]-56.526[/C][C]-145.05[/C][C]31.997[/C][C]0.287[/C][/ROW]
[ROW][C]DL-AA[/C][C]107.009[/C][C]4.127[/C][C]209.892[/C][C]0.039[/C][/ROW]
[ROW][C]DL-B6[/C][C]163.536[/C][C]66.375[/C][C]260.696[/C][C]0[/C][/ROW]
[ROW][C]WEATHERDELAY-NA,[/C][C]121.969[/C][C]2.42[/C][C]241.517[/C][C]0.046[/C][/ROW]
[ROW][C]B6:NA,-AA:NA,[/C][C]-37.898[/C][C]-149.507[/C][C]73.711[/C][C]0.922[/C][/ROW]
[ROW][C]DL:NA,-AA:NA,[/C][C]112.696[/C][C]-20.956[/C][C]246.349[/C][C]0.15[/C][/ROW]
[ROW][C]AA:WEATHERDELAY-AA:NA,[/C][C]241.905[/C][C]-61.476[/C][C]545.285[/C][C]0.198[/C][/ROW]
[ROW][C]B6:WEATHERDELAY-AA:NA,[/C][C]-25.929[/C][C]-392.571[/C][C]340.713[/C][C]1[/C][/ROW]
[ROW][C]DL:WEATHERDELAY-AA:NA,[/C][C]206.571[/C][C]-59.598[/C][C]472.741[/C][C]0.223[/C][/ROW]
[ROW][C]DL:NA,-B6:NA,[/C][C]150.594[/C][C]24.949[/C][C]276.24[/C][C]0.009[/C][/ROW]
[ROW][C]AA:WEATHERDELAY-B6:NA,[/C][C]279.803[/C][C]-20.137[/C][C]579.742[/C][C]0.082[/C][/ROW]
[ROW][C]B6:WEATHERDELAY-B6:NA,[/C][C]11.969[/C][C]-351.83[/C][C]375.769[/C][C]1[/C][/ROW]
[ROW][C]DL:WEATHERDELAY-B6:NA,[/C][C]244.469[/C][C]-17.771[/C][C]506.71[/C][C]0.083[/C][/ROW]
[ROW][C]AA:WEATHERDELAY-DL:NA,[/C][C]129.208[/C][C]-179.612[/C][C]438.029[/C][C]0.829[/C][/ROW]
[ROW][C]B6:WEATHERDELAY-DL:NA,[/C][C]-138.625[/C][C]-509.781[/C][C]232.531[/C][C]0.887[/C][/ROW]
[ROW][C]DL:WEATHERDELAY-DL:NA,[/C][C]93.875[/C][C]-178.479[/C][C]366.229[/C][C]0.917[/C][/ROW]
[ROW][C]B6:WEATHERDELAY-AA:WEATHERDELAY[/C][C]-267.833[/C][C]-728.196[/C][C]192.529[/C][C]0.543[/C][/ROW]
[ROW][C]DL:WEATHERDELAY-AA:WEATHERDELAY[/C][C]-35.333[/C][C]-420.5[/C][C]349.833[/C][C]1[/C][/ROW]
[ROW][C]DL:WEATHERDELAY-B6:WEATHERDELAY[/C][C]232.5[/C][C]-204.238[/C][C]669.238[/C][C]0.637[/C][/ROW]
[/TABLE]
Source: https://freestatistics.org/blog/index.php?pk=309470&T=3

Globally Unique Identifier (entire table): ba.freestatistics.org/blog/index.php?pk=309470&T=3

As an alternative you can also use a QR Code:  

The GUIDs for individual cells are displayed in the table below:

Tukey Honest Significant Difference Comparisons
difflwruprp adj
B6-AA-56.526-145.0531.9970.287
DL-AA107.0094.127209.8920.039
DL-B6163.53666.375260.6960
WEATHERDELAY-NA,121.9692.42241.5170.046
B6:NA,-AA:NA,-37.898-149.50773.7110.922
DL:NA,-AA:NA,112.696-20.956246.3490.15
AA:WEATHERDELAY-AA:NA,241.905-61.476545.2850.198
B6:WEATHERDELAY-AA:NA,-25.929-392.571340.7131
DL:WEATHERDELAY-AA:NA,206.571-59.598472.7410.223
DL:NA,-B6:NA,150.59424.949276.240.009
AA:WEATHERDELAY-B6:NA,279.803-20.137579.7420.082
B6:WEATHERDELAY-B6:NA,11.969-351.83375.7691
DL:WEATHERDELAY-B6:NA,244.469-17.771506.710.083
AA:WEATHERDELAY-DL:NA,129.208-179.612438.0290.829
B6:WEATHERDELAY-DL:NA,-138.625-509.781232.5310.887
DL:WEATHERDELAY-DL:NA,93.875-178.479366.2290.917
B6:WEATHERDELAY-AA:WEATHERDELAY-267.833-728.196192.5290.543
DL:WEATHERDELAY-AA:WEATHERDELAY-35.333-420.5349.8331
DL:WEATHERDELAY-B6:WEATHERDELAY232.5-204.238669.2380.637


Levenes Test for Homogeneity of Variance
DfF valuePr(>F)
Group55.0420
111

\begin{tabular}{lllllllll}
\hline
Levenes Test for Homogeneity of Variance \tabularnewline
  & Df & F value & Pr(>F) \tabularnewline
Group & 5 & 5.042 & 0 \tabularnewline
  & 111 &   &   \tabularnewline
\hline
\end{tabular}
%Source: https://freestatistics.org/blog/index.php?pk=309470&T=4

[TABLE]
[ROW][C]Levenes Test for Homogeneity of Variance[/C][/ROW]
[ROW][C] [/C][C]Df[/C][C]F value[/C][C]Pr(>F)[/C][/ROW]
[ROW][C]Group[/C][C]5[/C][C]5.042[/C][C]0[/C][/ROW]
[ROW][C] [/C][C]111[/C][C] [/C][C] [/C][/ROW]
[/TABLE]
Source: https://freestatistics.org/blog/index.php?pk=309470&T=4

Globally Unique Identifier (entire table): ba.freestatistics.org/blog/index.php?pk=309470&T=4

As an alternative you can also use a QR Code:  

The GUIDs for individual cells are displayed in the table below:

Levenes Test for Homogeneity of Variance
DfF valuePr(>F)
Group55.0420
111


Parameters (Session):
par1 = 1 ; par2 = Do not include Seasonal Dummies ; par3 = No Linear Trend ; par4 = 0 ; par5 = 0 ; par6 = 12 ;
Parameters (R input):
par1 = 1 ; par2 = 2 ; par3 = 3 ; par4 = TRUE ;
R code (references can be found in the software module):
par4 <- 'TRUE'
par3 <- '3'
par2 <- '2'
par1 <- '1'
cat1 <- as.numeric(par1) #
cat2<- as.numeric(par2) #
cat3 <- as.numeric(par3)
intercept<-as.logical(par4)
x <- t(x)
x1<-as.numeric(x[,cat1])
f1<-as.character(x[,cat2])
f2 <- as.character(x[,cat3])
xdf<-data.frame(x1,f1, f2)
(V1<-dimnames(y)[[1]][cat1])
(V2<-dimnames(y)[[1]][cat2])
(V3 <-dimnames(y)[[1]][cat3])
names(xdf)<-c('Response', 'Treatment_A', 'Treatment_B')
if(intercept == FALSE) (lmxdf<-lm(Response ~ Treatment_A * Treatment_B- 1, data = xdf) ) else (lmxdf<-lm(Response ~ Treatment_A * Treatment_B, data = xdf) )
(aov.xdf<-aov(lmxdf) )
(anova.xdf<-anova(lmxdf) )
load(file='createtable')
a<-table.start()
a<-table.row.start(a)
a<-table.element(a,'ANOVA Model', length(lmxdf$coefficients)+1,TRUE)
a<-table.row.end(a)
a<-table.row.start(a)
a<-table.element(a, lmxdf$call['formula'],length(lmxdf$coefficients)+1,TRUE)
a<-table.row.end(a)
a<-table.row.start(a)
a<-table.element(a, 'means',,TRUE)
for(i in 1:length(lmxdf$coefficients)){
a<-table.element(a, round(lmxdf$coefficients[i], digits=3),,FALSE)
}
a<-table.row.end(a)
a<-table.end(a)
table.save(a,file='mytable.tab')
a<-table.start()
a<-table.row.start(a)
a<-table.element(a,'ANOVA Statistics', 5+1,TRUE)
a<-table.row.end(a)
a<-table.row.start(a)
a<-table.element(a, ' ',,TRUE)
a<-table.element(a, 'Df',,FALSE)
a<-table.element(a, 'Sum Sq',,FALSE)
a<-table.element(a, 'Mean Sq',,FALSE)
a<-table.element(a, 'F value',,FALSE)
a<-table.element(a, 'Pr(>F)',,FALSE)
a<-table.row.end(a)
for(i in 1 : length(rownames(anova.xdf))-1){
a<-table.row.start(a)
a<-table.element(a,rownames(anova.xdf)[i] ,,TRUE)
a<-table.element(a, anova.xdf$Df[1],,FALSE)
a<-table.element(a, round(anova.xdf$'Sum Sq'[i], digits=3),,FALSE)
a<-table.element(a, round(anova.xdf$'Mean Sq'[i], digits=3),,FALSE)
a<-table.element(a, round(anova.xdf$'F value'[i], digits=3),,FALSE)
a<-table.element(a, round(anova.xdf$'Pr(>F)'[i], digits=3),,FALSE)
a<-table.row.end(a)
}
a<-table.row.start(a)
a<-table.element(a, 'Residuals',,TRUE)
a<-table.element(a, anova.xdf$'Df'[i+1],,FALSE)
a<-table.element(a, round(anova.xdf$'Sum Sq'[i+1], digits=3),,FALSE)
a<-table.element(a, round(anova.xdf$'Mean Sq'[i+1], digits=3),,FALSE)
a<-table.element(a, ' ',,FALSE)
a<-table.row.end(a)
a<-table.end(a)
table.save(a,file='mytable1.tab')
bitmap(file='anovaplot.png')
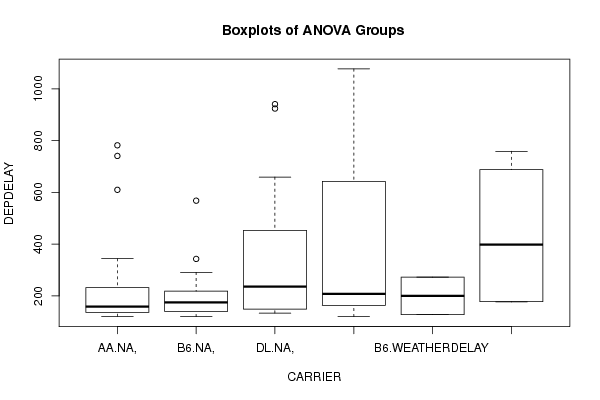
boxplot(Response ~ Treatment_A + Treatment_B, data=xdf, xlab=V2, ylab=V1, main='Boxplots of ANOVA Groups')
dev.off()
bitmap(file='designplot.png')
xdf2 <- xdf # to preserve xdf make copy for function
names(xdf2) <- c(V1, V2, V3)
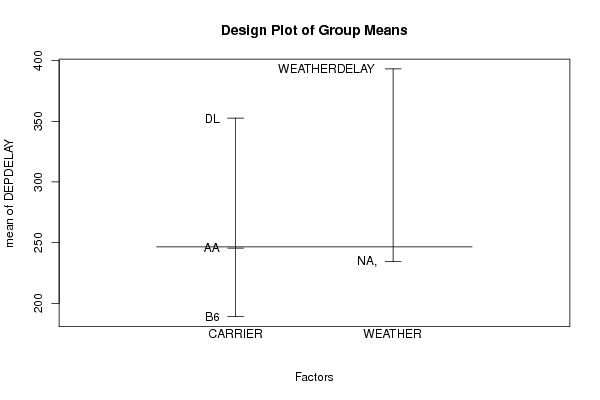
plot.design(xdf2, main='Design Plot of Group Means')
dev.off()
bitmap(file='interactionplot.png')
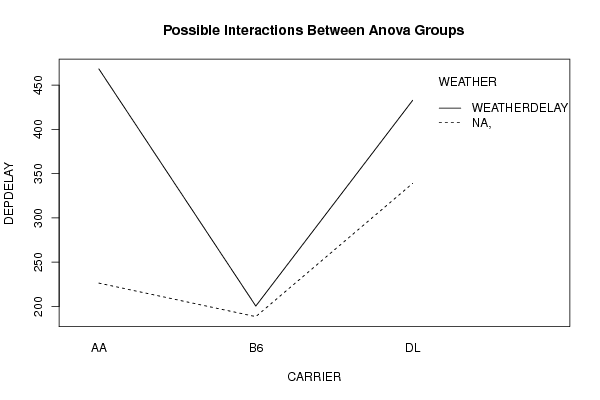
interaction.plot(xdf$Treatment_A, xdf$Treatment_B, xdf$Response, xlab=V2, ylab=V1, trace.label=V3, main='Possible Interactions Between Anova Groups')
dev.off()
if(intercept==TRUE){
thsd<-TukeyHSD(aov.xdf)
names(thsd) <- c(V2, V3, paste(V2, ':', V3, sep=''))
bitmap(file='TukeyHSDPlot.png')
layout(matrix(c(1,2,3,3), 2,2))
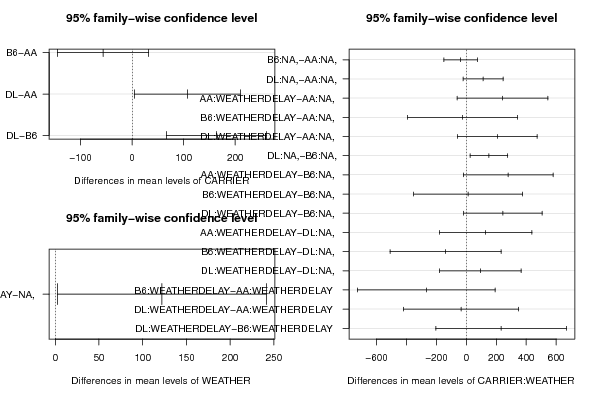
plot(thsd, las=1)
dev.off()
}
if(intercept==TRUE){
ntables<-length(names(thsd))
a<-table.start()
a<-table.row.start(a)
a<-table.element(a,'Tukey Honest Significant Difference Comparisons', 5,TRUE)
a<-table.row.end(a)
a<-table.row.start(a)
a<-table.element(a, ' ', 1, TRUE)
for(i in 1:4){
a<-table.element(a,colnames(thsd[[1]])[i], 1, TRUE)
}
a<-table.row.end(a)
for(nt in 1:ntables){
for(i in 1:length(rownames(thsd[[nt]]))){
a<-table.row.start(a)
a<-table.element(a,rownames(thsd[[nt]])[i], 1, TRUE)
for(j in 1:4){
a<-table.element(a,round(thsd[[nt]][i,j], digits=3), 1, FALSE)
}
a<-table.row.end(a)
}
} # end nt
a<-table.end(a)
table.save(a,file='hsdtable.tab')
}#end if hsd tables
if(intercept==FALSE){
a<-table.start()
a<-table.row.start(a)
a<-table.element(a,'TukeyHSD Message', 1,TRUE)
a<-table.row.end(a)
a<-table.start()
a<-table.row.start(a)
a<-table.element(a,'Must Include Intercept to use Tukey Test ', 1, FALSE)
a<-table.row.end(a)
a<-table.end(a)
table.save(a,file='mytable2.tab')
}
library(car)
lt.lmxdf<-levene.test(lmxdf)
a<-table.start()
a<-table.row.start(a)
a<-table.element(a,'Levenes Test for Homogeneity of Variance', 4,TRUE)
a<-table.row.end(a)
a<-table.row.start(a)
a<-table.element(a,' ', 1, TRUE)
for (i in 1:3){
a<-table.element(a,names(lt.lmxdf)[i], 1, FALSE)
}
a<-table.row.end(a)
a<-table.row.start(a)
a<-table.element(a,'Group', 1, TRUE)
for (i in 1:3){
a<-table.element(a,round(lt.lmxdf[[i]][1], digits=3), 1, FALSE)
}
a<-table.row.end(a)
a<-table.row.start(a)
a<-table.element(a,' ', 1, TRUE)
a<-table.element(a,lt.lmxdf[[1]][2], 1, FALSE)
a<-table.element(a,' ', 1, FALSE)
a<-table.row.end(a)
a<-table.end(a)
table.save(a,file='mytable3.tab')