Free Statistics

of Irreproducible Research!

Author's title

Author*The author of this computation has been verified*
R Software Modulerwasp_autocorrelation.wasp
Title produced by software(Partial) Autocorrelation Function
Date of computationThu, 14 Dec 2017 12:18:33 +0100
Cite this page as followsStatistical Computations at FreeStatistics.org, Office for Research Development and Education, URL https://freestatistics.org/blog/index.php?v=date/2017/Dec/14/t151325032600qxte82n8ap9fv.htm/, Retrieved Tue, 14 May 2024 07:12:52 +0000
Statistical Computations at FreeStatistics.org, Office for Research Development and Education, URL https://freestatistics.org/blog/index.php?pk=309463, Retrieved Tue, 14 May 2024 07:12:52 +0000
QR Codes:

Original text written by user:
IsPrivate?No (this computation is public)
User-defined keywords
Estimated Impact105
Family? (F = Feedback message, R = changed R code, M = changed R Module, P = changed Parameters, D = changed Data)
-       [(Partial) Autocorrelation Function] [] [2017-12-14 11:18:33] [c594df30d4ca3ffb9387e41ef17d0596] [Current]
Feedback Forum

Post a new message
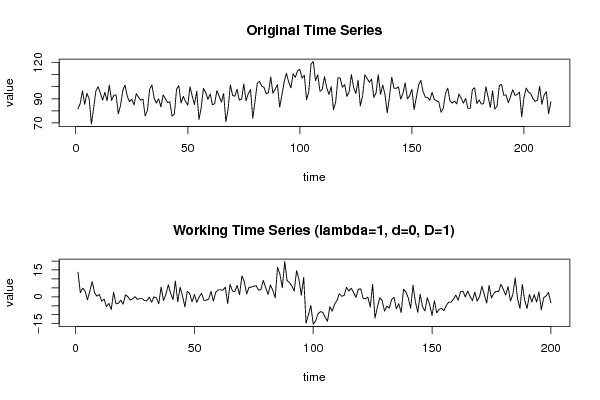
Dataseries X:
81.6
86.1
96.5
85.4
94.5
90
69.1
82.4
96.5
100
94.7
88.8
95.4
88.4
101.3
88.7
92.8
93.3
77.6
84.6
96.9
101.3
92.2
87.6
89.8
84.8
94.2
91.3
88.9
89.7
75.8
80.5
98
101.4
90.4
86.5
89.9
83.4
93.2
90.3
86.8
87.5
75.7
77.4
98
100.8
86.5
92
87.8
84.7
99.9
92.2
85.3
96.3
72.9
82.8
98.5
95.2
89.5
94
85
86
96.8
92.1
87.3
94.3
71
81.5
101.5
92.8
92.1
97.9
88.9
89.7
102.2
88.4
94.3
97.6
73.9
87.9
102.7
104.5
100.5
99.5
94.2
95.1
108.1
94.6
98
101.7
83.1
92.9
104.1
111.1
104.1
99
110.7
107.7
113.2
114.3
107.1
109.6
89.2
96.1
118.7
120.8
105
109.8
96.1
97.8
108.3
99.1
93.6
100.1
80.9
87.5
107.4
107.1
99.5
101.8
92
95.8
110
99.4
94.4
105.4
84.1
92.3
109.8
106.8
103.8
106.2
91.2
94.7
109.9
93.7
101.4
93.6
78.3
91.8
107.8
98.8
98.6
99.9
89.7
94.4
103.2
89.9
92.6
97.8
81.1
91.2
101.4
105.3
95.8
91.3
91.1
88.8
95.3
89.4
88.3
87.4
78.9
82.2
94.5
98.8
88.1
86.5
88.1
85.8
94
90.4
86.4
90.3
82.1
82.1
97.7
99.1
85.9
89.1
85.7
85.9
99.9
91.6
82.9
96.6
81.5
84
100.8
102
92.9
93.2
86.7
91.6
97.6
92.8
93.5
95.5
75.1
90.9
98.9
95.5
94.3
90.3
87.9
88.7
100.3
85.5
93
96
77.6
87.5


Summary of computational transaction
Raw Input view raw input (R code)
Raw Outputview raw output of R engine
Computing time1 seconds
R ServerBig Analytics Cloud Computing Center

\begin{tabular}{lllllllll}
\hline
Summary of computational transaction \tabularnewline
Raw Input view raw input (R code)  \tabularnewline
Raw Outputview raw output of R engine  \tabularnewline
Computing time1 seconds \tabularnewline
R ServerBig Analytics Cloud Computing Center \tabularnewline
\hline
\end{tabular}
%Source: https://freestatistics.org/blog/index.php?pk=309463&T=0

[TABLE]
[ROW]
Summary of computational transaction[/C][/ROW] [ROW]Raw Input[/C] view raw input (R code) [/C][/ROW] [ROW]Raw Output[/C]view raw output of R engine [/C][/ROW] [ROW]Computing time[/C]1 seconds[/C][/ROW] [ROW]R Server[/C]Big Analytics Cloud Computing Center[/C][/ROW] [/TABLE] Source: https://freestatistics.org/blog/index.php?pk=309463&T=0

Globally Unique Identifier (entire table): ba.freestatistics.org/blog/index.php?pk=309463&T=0

As an alternative you can also use a QR Code:  

The GUIDs for individual cells are displayed in the table below:

Summary of computational transaction
Raw Input view raw input (R code)
Raw Outputview raw output of R engine
Computing time1 seconds
R ServerBig Analytics Cloud Computing Center


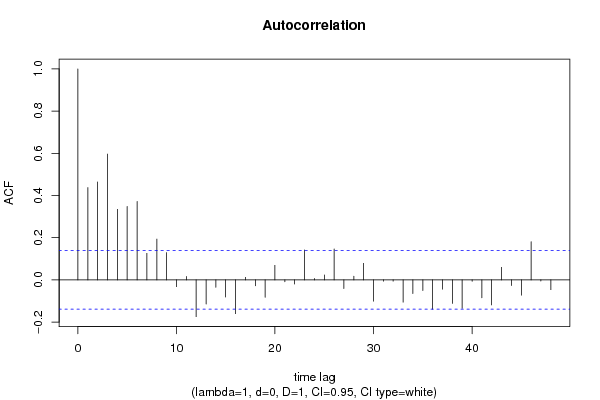
Autocorrelation Function
Time lag kACF(k)T-STATP-value
10.4375796.18830
20.4644036.56760
30.596298.43280
40.3343474.72842e-06
50.3480394.9221e-06
60.3725.26090
70.1257421.77830.03844
80.1931452.73150.003434
90.1293811.82970.03439
10-0.031913-0.45130.326124
110.0159070.2250.411118
12-0.174295-2.46490.007274
13-0.114201-1.61510.053938
14-0.03508-0.49610.310183
15-0.081348-1.15040.125668
16-0.160151-2.26490.012296
170.0119790.16940.432822
18-0.027557-0.38970.348582
19-0.082296-1.16380.122938
200.0690240.97610.165086
21-0.00926-0.1310.447969
22-0.019755-0.27940.39012
230.1419522.00750.023021
240.0066520.09410.462574
250.022910.3240.373139
260.1465342.07230.01976
27-0.041216-0.58290.280313
280.0173060.24480.40345
290.0781941.10580.135063
30-0.100725-1.42450.077934
31-0.005974-0.08450.466375
32-0.005999-0.08480.466239
33-0.105622-1.49370.068412
34-0.064616-0.91380.18096
35-0.050011-0.70730.240111
36-0.138817-1.96320.025507
37-0.043975-0.62190.267359
38-0.111564-1.57780.058101
39-0.134599-1.90350.029205
40-0.006892-0.09750.461225
41-0.084931-1.20110.115566
42-0.11869-1.67850.047403
430.0592880.83850.201389
44-0.026696-0.37750.353085
45-0.072422-1.02420.153489
460.1809062.55840.005628
47-0.005125-0.07250.471147
48-0.046391-0.65610.256266

\begin{tabular}{lllllllll}
\hline
Autocorrelation Function \tabularnewline
Time lag k & ACF(k) & T-STAT & P-value \tabularnewline
1 & 0.437579 & 6.1883 & 0 \tabularnewline
2 & 0.464403 & 6.5676 & 0 \tabularnewline
3 & 0.59629 & 8.4328 & 0 \tabularnewline
4 & 0.334347 & 4.7284 & 2e-06 \tabularnewline
5 & 0.348039 & 4.922 & 1e-06 \tabularnewline
6 & 0.372 & 5.2609 & 0 \tabularnewline
7 & 0.125742 & 1.7783 & 0.03844 \tabularnewline
8 & 0.193145 & 2.7315 & 0.003434 \tabularnewline
9 & 0.129381 & 1.8297 & 0.03439 \tabularnewline
10 & -0.031913 & -0.4513 & 0.326124 \tabularnewline
11 & 0.015907 & 0.225 & 0.411118 \tabularnewline
12 & -0.174295 & -2.4649 & 0.007274 \tabularnewline
13 & -0.114201 & -1.6151 & 0.053938 \tabularnewline
14 & -0.03508 & -0.4961 & 0.310183 \tabularnewline
15 & -0.081348 & -1.1504 & 0.125668 \tabularnewline
16 & -0.160151 & -2.2649 & 0.012296 \tabularnewline
17 & 0.011979 & 0.1694 & 0.432822 \tabularnewline
18 & -0.027557 & -0.3897 & 0.348582 \tabularnewline
19 & -0.082296 & -1.1638 & 0.122938 \tabularnewline
20 & 0.069024 & 0.9761 & 0.165086 \tabularnewline
21 & -0.00926 & -0.131 & 0.447969 \tabularnewline
22 & -0.019755 & -0.2794 & 0.39012 \tabularnewline
23 & 0.141952 & 2.0075 & 0.023021 \tabularnewline
24 & 0.006652 & 0.0941 & 0.462574 \tabularnewline
25 & 0.02291 & 0.324 & 0.373139 \tabularnewline
26 & 0.146534 & 2.0723 & 0.01976 \tabularnewline
27 & -0.041216 & -0.5829 & 0.280313 \tabularnewline
28 & 0.017306 & 0.2448 & 0.40345 \tabularnewline
29 & 0.078194 & 1.1058 & 0.135063 \tabularnewline
30 & -0.100725 & -1.4245 & 0.077934 \tabularnewline
31 & -0.005974 & -0.0845 & 0.466375 \tabularnewline
32 & -0.005999 & -0.0848 & 0.466239 \tabularnewline
33 & -0.105622 & -1.4937 & 0.068412 \tabularnewline
34 & -0.064616 & -0.9138 & 0.18096 \tabularnewline
35 & -0.050011 & -0.7073 & 0.240111 \tabularnewline
36 & -0.138817 & -1.9632 & 0.025507 \tabularnewline
37 & -0.043975 & -0.6219 & 0.267359 \tabularnewline
38 & -0.111564 & -1.5778 & 0.058101 \tabularnewline
39 & -0.134599 & -1.9035 & 0.029205 \tabularnewline
40 & -0.006892 & -0.0975 & 0.461225 \tabularnewline
41 & -0.084931 & -1.2011 & 0.115566 \tabularnewline
42 & -0.11869 & -1.6785 & 0.047403 \tabularnewline
43 & 0.059288 & 0.8385 & 0.201389 \tabularnewline
44 & -0.026696 & -0.3775 & 0.353085 \tabularnewline
45 & -0.072422 & -1.0242 & 0.153489 \tabularnewline
46 & 0.180906 & 2.5584 & 0.005628 \tabularnewline
47 & -0.005125 & -0.0725 & 0.471147 \tabularnewline
48 & -0.046391 & -0.6561 & 0.256266 \tabularnewline
\hline
\end{tabular}
%Source: https://freestatistics.org/blog/index.php?pk=309463&T=1

[TABLE]
[ROW][C]Autocorrelation Function[/C][/ROW]
[ROW][C]Time lag k[/C][C]ACF(k)[/C][C]T-STAT[/C][C]P-value[/C][/ROW]
[ROW][C]1[/C][C]0.437579[/C][C]6.1883[/C][C]0[/C][/ROW]
[ROW][C]2[/C][C]0.464403[/C][C]6.5676[/C][C]0[/C][/ROW]
[ROW][C]3[/C][C]0.59629[/C][C]8.4328[/C][C]0[/C][/ROW]
[ROW][C]4[/C][C]0.334347[/C][C]4.7284[/C][C]2e-06[/C][/ROW]
[ROW][C]5[/C][C]0.348039[/C][C]4.922[/C][C]1e-06[/C][/ROW]
[ROW][C]6[/C][C]0.372[/C][C]5.2609[/C][C]0[/C][/ROW]
[ROW][C]7[/C][C]0.125742[/C][C]1.7783[/C][C]0.03844[/C][/ROW]
[ROW][C]8[/C][C]0.193145[/C][C]2.7315[/C][C]0.003434[/C][/ROW]
[ROW][C]9[/C][C]0.129381[/C][C]1.8297[/C][C]0.03439[/C][/ROW]
[ROW][C]10[/C][C]-0.031913[/C][C]-0.4513[/C][C]0.326124[/C][/ROW]
[ROW][C]11[/C][C]0.015907[/C][C]0.225[/C][C]0.411118[/C][/ROW]
[ROW][C]12[/C][C]-0.174295[/C][C]-2.4649[/C][C]0.007274[/C][/ROW]
[ROW][C]13[/C][C]-0.114201[/C][C]-1.6151[/C][C]0.053938[/C][/ROW]
[ROW][C]14[/C][C]-0.03508[/C][C]-0.4961[/C][C]0.310183[/C][/ROW]
[ROW][C]15[/C][C]-0.081348[/C][C]-1.1504[/C][C]0.125668[/C][/ROW]
[ROW][C]16[/C][C]-0.160151[/C][C]-2.2649[/C][C]0.012296[/C][/ROW]
[ROW][C]17[/C][C]0.011979[/C][C]0.1694[/C][C]0.432822[/C][/ROW]
[ROW][C]18[/C][C]-0.027557[/C][C]-0.3897[/C][C]0.348582[/C][/ROW]
[ROW][C]19[/C][C]-0.082296[/C][C]-1.1638[/C][C]0.122938[/C][/ROW]
[ROW][C]20[/C][C]0.069024[/C][C]0.9761[/C][C]0.165086[/C][/ROW]
[ROW][C]21[/C][C]-0.00926[/C][C]-0.131[/C][C]0.447969[/C][/ROW]
[ROW][C]22[/C][C]-0.019755[/C][C]-0.2794[/C][C]0.39012[/C][/ROW]
[ROW][C]23[/C][C]0.141952[/C][C]2.0075[/C][C]0.023021[/C][/ROW]
[ROW][C]24[/C][C]0.006652[/C][C]0.0941[/C][C]0.462574[/C][/ROW]
[ROW][C]25[/C][C]0.02291[/C][C]0.324[/C][C]0.373139[/C][/ROW]
[ROW][C]26[/C][C]0.146534[/C][C]2.0723[/C][C]0.01976[/C][/ROW]
[ROW][C]27[/C][C]-0.041216[/C][C]-0.5829[/C][C]0.280313[/C][/ROW]
[ROW][C]28[/C][C]0.017306[/C][C]0.2448[/C][C]0.40345[/C][/ROW]
[ROW][C]29[/C][C]0.078194[/C][C]1.1058[/C][C]0.135063[/C][/ROW]
[ROW][C]30[/C][C]-0.100725[/C][C]-1.4245[/C][C]0.077934[/C][/ROW]
[ROW][C]31[/C][C]-0.005974[/C][C]-0.0845[/C][C]0.466375[/C][/ROW]
[ROW][C]32[/C][C]-0.005999[/C][C]-0.0848[/C][C]0.466239[/C][/ROW]
[ROW][C]33[/C][C]-0.105622[/C][C]-1.4937[/C][C]0.068412[/C][/ROW]
[ROW][C]34[/C][C]-0.064616[/C][C]-0.9138[/C][C]0.18096[/C][/ROW]
[ROW][C]35[/C][C]-0.050011[/C][C]-0.7073[/C][C]0.240111[/C][/ROW]
[ROW][C]36[/C][C]-0.138817[/C][C]-1.9632[/C][C]0.025507[/C][/ROW]
[ROW][C]37[/C][C]-0.043975[/C][C]-0.6219[/C][C]0.267359[/C][/ROW]
[ROW][C]38[/C][C]-0.111564[/C][C]-1.5778[/C][C]0.058101[/C][/ROW]
[ROW][C]39[/C][C]-0.134599[/C][C]-1.9035[/C][C]0.029205[/C][/ROW]
[ROW][C]40[/C][C]-0.006892[/C][C]-0.0975[/C][C]0.461225[/C][/ROW]
[ROW][C]41[/C][C]-0.084931[/C][C]-1.2011[/C][C]0.115566[/C][/ROW]
[ROW][C]42[/C][C]-0.11869[/C][C]-1.6785[/C][C]0.047403[/C][/ROW]
[ROW][C]43[/C][C]0.059288[/C][C]0.8385[/C][C]0.201389[/C][/ROW]
[ROW][C]44[/C][C]-0.026696[/C][C]-0.3775[/C][C]0.353085[/C][/ROW]
[ROW][C]45[/C][C]-0.072422[/C][C]-1.0242[/C][C]0.153489[/C][/ROW]
[ROW][C]46[/C][C]0.180906[/C][C]2.5584[/C][C]0.005628[/C][/ROW]
[ROW][C]47[/C][C]-0.005125[/C][C]-0.0725[/C][C]0.471147[/C][/ROW]
[ROW][C]48[/C][C]-0.046391[/C][C]-0.6561[/C][C]0.256266[/C][/ROW]
[/TABLE]
Source: https://freestatistics.org/blog/index.php?pk=309463&T=1

Globally Unique Identifier (entire table): ba.freestatistics.org/blog/index.php?pk=309463&T=1

As an alternative you can also use a QR Code:  

The GUIDs for individual cells are displayed in the table below:

Autocorrelation Function
Time lag kACF(k)T-STATP-value
10.4375796.18830
20.4644036.56760
30.596298.43280
40.3343474.72842e-06
50.3480394.9221e-06
60.3725.26090
70.1257421.77830.03844
80.1931452.73150.003434
90.1293811.82970.03439
10-0.031913-0.45130.326124
110.0159070.2250.411118
12-0.174295-2.46490.007274
13-0.114201-1.61510.053938
14-0.03508-0.49610.310183
15-0.081348-1.15040.125668
16-0.160151-2.26490.012296
170.0119790.16940.432822
18-0.027557-0.38970.348582
19-0.082296-1.16380.122938
200.0690240.97610.165086
21-0.00926-0.1310.447969
22-0.019755-0.27940.39012
230.1419522.00750.023021
240.0066520.09410.462574
250.022910.3240.373139
260.1465342.07230.01976
27-0.041216-0.58290.280313
280.0173060.24480.40345
290.0781941.10580.135063
30-0.100725-1.42450.077934
31-0.005974-0.08450.466375
32-0.005999-0.08480.466239
33-0.105622-1.49370.068412
34-0.064616-0.91380.18096
35-0.050011-0.70730.240111
36-0.138817-1.96320.025507
37-0.043975-0.62190.267359
38-0.111564-1.57780.058101
39-0.134599-1.90350.029205
40-0.006892-0.09750.461225
41-0.084931-1.20110.115566
42-0.11869-1.67850.047403
430.0592880.83850.201389
44-0.026696-0.37750.353085
45-0.072422-1.02420.153489
460.1809062.55840.005628
47-0.005125-0.07250.471147
48-0.046391-0.65610.256266


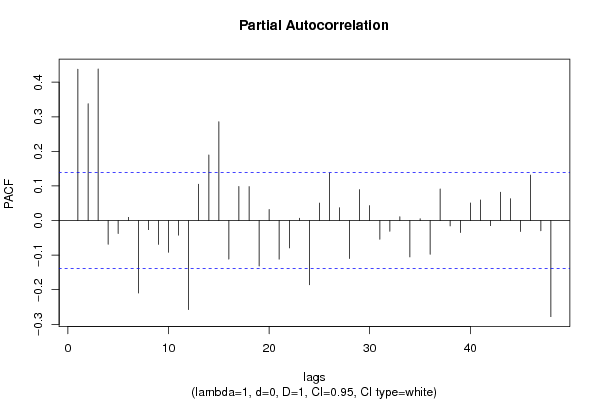
Partial Autocorrelation Function
Time lag kPACF(k)T-STATP-value
10.4375796.18830
20.3375624.77382e-06
30.4382556.19790
4-0.068805-0.97310.165851
5-0.037536-0.53080.298059
60.0092910.13140.447799
7-0.209313-2.96010.001723
8-0.026352-0.37270.354891
9-0.069003-0.97590.165158
10-0.091618-1.29570.09829
11-0.04215-0.59610.275896
12-0.257474-3.64120.000173
130.1051411.48690.069306
140.1894512.67920.003997
150.2855074.03773.8e-05
16-0.111463-1.57630.058265
170.0984661.39250.082656
180.0980881.38720.083467
19-0.131244-1.85610.032457
200.0321070.45410.325139
21-0.111559-1.57770.05811
22-0.079091-1.11850.132343
230.0065960.09330.462888
24-0.185552-2.62410.004679
250.0504090.71290.238371
260.1371851.94010.026887
270.0368390.5210.301478
28-0.109619-1.55020.061332
290.0892931.26280.104066
300.0432110.61110.270917
31-0.053957-0.76310.223161
32-0.031042-0.4390.330566
330.0109320.15460.438648
34-0.105087-1.48620.069406
350.0050850.07190.471372
36-0.097628-1.38070.084462
370.0912261.29010.099248
38-0.015501-0.21920.413353
39-0.034493-0.48780.313111
400.0507530.71780.236873
410.0593720.83960.201055
42-0.014778-0.2090.417331
430.0816141.15420.124898
440.0631760.89350.186345
45-0.031612-0.44710.327656
460.1313321.85730.032368
47-0.02952-0.41750.338387
48-0.27786-3.92955.9e-05

\begin{tabular}{lllllllll}
\hline
Partial Autocorrelation Function \tabularnewline
Time lag k & PACF(k) & T-STAT & P-value \tabularnewline
1 & 0.437579 & 6.1883 & 0 \tabularnewline
2 & 0.337562 & 4.7738 & 2e-06 \tabularnewline
3 & 0.438255 & 6.1979 & 0 \tabularnewline
4 & -0.068805 & -0.9731 & 0.165851 \tabularnewline
5 & -0.037536 & -0.5308 & 0.298059 \tabularnewline
6 & 0.009291 & 0.1314 & 0.447799 \tabularnewline
7 & -0.209313 & -2.9601 & 0.001723 \tabularnewline
8 & -0.026352 & -0.3727 & 0.354891 \tabularnewline
9 & -0.069003 & -0.9759 & 0.165158 \tabularnewline
10 & -0.091618 & -1.2957 & 0.09829 \tabularnewline
11 & -0.04215 & -0.5961 & 0.275896 \tabularnewline
12 & -0.257474 & -3.6412 & 0.000173 \tabularnewline
13 & 0.105141 & 1.4869 & 0.069306 \tabularnewline
14 & 0.189451 & 2.6792 & 0.003997 \tabularnewline
15 & 0.285507 & 4.0377 & 3.8e-05 \tabularnewline
16 & -0.111463 & -1.5763 & 0.058265 \tabularnewline
17 & 0.098466 & 1.3925 & 0.082656 \tabularnewline
18 & 0.098088 & 1.3872 & 0.083467 \tabularnewline
19 & -0.131244 & -1.8561 & 0.032457 \tabularnewline
20 & 0.032107 & 0.4541 & 0.325139 \tabularnewline
21 & -0.111559 & -1.5777 & 0.05811 \tabularnewline
22 & -0.079091 & -1.1185 & 0.132343 \tabularnewline
23 & 0.006596 & 0.0933 & 0.462888 \tabularnewline
24 & -0.185552 & -2.6241 & 0.004679 \tabularnewline
25 & 0.050409 & 0.7129 & 0.238371 \tabularnewline
26 & 0.137185 & 1.9401 & 0.026887 \tabularnewline
27 & 0.036839 & 0.521 & 0.301478 \tabularnewline
28 & -0.109619 & -1.5502 & 0.061332 \tabularnewline
29 & 0.089293 & 1.2628 & 0.104066 \tabularnewline
30 & 0.043211 & 0.6111 & 0.270917 \tabularnewline
31 & -0.053957 & -0.7631 & 0.223161 \tabularnewline
32 & -0.031042 & -0.439 & 0.330566 \tabularnewline
33 & 0.010932 & 0.1546 & 0.438648 \tabularnewline
34 & -0.105087 & -1.4862 & 0.069406 \tabularnewline
35 & 0.005085 & 0.0719 & 0.471372 \tabularnewline
36 & -0.097628 & -1.3807 & 0.084462 \tabularnewline
37 & 0.091226 & 1.2901 & 0.099248 \tabularnewline
38 & -0.015501 & -0.2192 & 0.413353 \tabularnewline
39 & -0.034493 & -0.4878 & 0.313111 \tabularnewline
40 & 0.050753 & 0.7178 & 0.236873 \tabularnewline
41 & 0.059372 & 0.8396 & 0.201055 \tabularnewline
42 & -0.014778 & -0.209 & 0.417331 \tabularnewline
43 & 0.081614 & 1.1542 & 0.124898 \tabularnewline
44 & 0.063176 & 0.8935 & 0.186345 \tabularnewline
45 & -0.031612 & -0.4471 & 0.327656 \tabularnewline
46 & 0.131332 & 1.8573 & 0.032368 \tabularnewline
47 & -0.02952 & -0.4175 & 0.338387 \tabularnewline
48 & -0.27786 & -3.9295 & 5.9e-05 \tabularnewline
\hline
\end{tabular}
%Source: https://freestatistics.org/blog/index.php?pk=309463&T=2

[TABLE]
[ROW][C]Partial Autocorrelation Function[/C][/ROW]
[ROW][C]Time lag k[/C][C]PACF(k)[/C][C]T-STAT[/C][C]P-value[/C][/ROW]
[ROW][C]1[/C][C]0.437579[/C][C]6.1883[/C][C]0[/C][/ROW]
[ROW][C]2[/C][C]0.337562[/C][C]4.7738[/C][C]2e-06[/C][/ROW]
[ROW][C]3[/C][C]0.438255[/C][C]6.1979[/C][C]0[/C][/ROW]
[ROW][C]4[/C][C]-0.068805[/C][C]-0.9731[/C][C]0.165851[/C][/ROW]
[ROW][C]5[/C][C]-0.037536[/C][C]-0.5308[/C][C]0.298059[/C][/ROW]
[ROW][C]6[/C][C]0.009291[/C][C]0.1314[/C][C]0.447799[/C][/ROW]
[ROW][C]7[/C][C]-0.209313[/C][C]-2.9601[/C][C]0.001723[/C][/ROW]
[ROW][C]8[/C][C]-0.026352[/C][C]-0.3727[/C][C]0.354891[/C][/ROW]
[ROW][C]9[/C][C]-0.069003[/C][C]-0.9759[/C][C]0.165158[/C][/ROW]
[ROW][C]10[/C][C]-0.091618[/C][C]-1.2957[/C][C]0.09829[/C][/ROW]
[ROW][C]11[/C][C]-0.04215[/C][C]-0.5961[/C][C]0.275896[/C][/ROW]
[ROW][C]12[/C][C]-0.257474[/C][C]-3.6412[/C][C]0.000173[/C][/ROW]
[ROW][C]13[/C][C]0.105141[/C][C]1.4869[/C][C]0.069306[/C][/ROW]
[ROW][C]14[/C][C]0.189451[/C][C]2.6792[/C][C]0.003997[/C][/ROW]
[ROW][C]15[/C][C]0.285507[/C][C]4.0377[/C][C]3.8e-05[/C][/ROW]
[ROW][C]16[/C][C]-0.111463[/C][C]-1.5763[/C][C]0.058265[/C][/ROW]
[ROW][C]17[/C][C]0.098466[/C][C]1.3925[/C][C]0.082656[/C][/ROW]
[ROW][C]18[/C][C]0.098088[/C][C]1.3872[/C][C]0.083467[/C][/ROW]
[ROW][C]19[/C][C]-0.131244[/C][C]-1.8561[/C][C]0.032457[/C][/ROW]
[ROW][C]20[/C][C]0.032107[/C][C]0.4541[/C][C]0.325139[/C][/ROW]
[ROW][C]21[/C][C]-0.111559[/C][C]-1.5777[/C][C]0.05811[/C][/ROW]
[ROW][C]22[/C][C]-0.079091[/C][C]-1.1185[/C][C]0.132343[/C][/ROW]
[ROW][C]23[/C][C]0.006596[/C][C]0.0933[/C][C]0.462888[/C][/ROW]
[ROW][C]24[/C][C]-0.185552[/C][C]-2.6241[/C][C]0.004679[/C][/ROW]
[ROW][C]25[/C][C]0.050409[/C][C]0.7129[/C][C]0.238371[/C][/ROW]
[ROW][C]26[/C][C]0.137185[/C][C]1.9401[/C][C]0.026887[/C][/ROW]
[ROW][C]27[/C][C]0.036839[/C][C]0.521[/C][C]0.301478[/C][/ROW]
[ROW][C]28[/C][C]-0.109619[/C][C]-1.5502[/C][C]0.061332[/C][/ROW]
[ROW][C]29[/C][C]0.089293[/C][C]1.2628[/C][C]0.104066[/C][/ROW]
[ROW][C]30[/C][C]0.043211[/C][C]0.6111[/C][C]0.270917[/C][/ROW]
[ROW][C]31[/C][C]-0.053957[/C][C]-0.7631[/C][C]0.223161[/C][/ROW]
[ROW][C]32[/C][C]-0.031042[/C][C]-0.439[/C][C]0.330566[/C][/ROW]
[ROW][C]33[/C][C]0.010932[/C][C]0.1546[/C][C]0.438648[/C][/ROW]
[ROW][C]34[/C][C]-0.105087[/C][C]-1.4862[/C][C]0.069406[/C][/ROW]
[ROW][C]35[/C][C]0.005085[/C][C]0.0719[/C][C]0.471372[/C][/ROW]
[ROW][C]36[/C][C]-0.097628[/C][C]-1.3807[/C][C]0.084462[/C][/ROW]
[ROW][C]37[/C][C]0.091226[/C][C]1.2901[/C][C]0.099248[/C][/ROW]
[ROW][C]38[/C][C]-0.015501[/C][C]-0.2192[/C][C]0.413353[/C][/ROW]
[ROW][C]39[/C][C]-0.034493[/C][C]-0.4878[/C][C]0.313111[/C][/ROW]
[ROW][C]40[/C][C]0.050753[/C][C]0.7178[/C][C]0.236873[/C][/ROW]
[ROW][C]41[/C][C]0.059372[/C][C]0.8396[/C][C]0.201055[/C][/ROW]
[ROW][C]42[/C][C]-0.014778[/C][C]-0.209[/C][C]0.417331[/C][/ROW]
[ROW][C]43[/C][C]0.081614[/C][C]1.1542[/C][C]0.124898[/C][/ROW]
[ROW][C]44[/C][C]0.063176[/C][C]0.8935[/C][C]0.186345[/C][/ROW]
[ROW][C]45[/C][C]-0.031612[/C][C]-0.4471[/C][C]0.327656[/C][/ROW]
[ROW][C]46[/C][C]0.131332[/C][C]1.8573[/C][C]0.032368[/C][/ROW]
[ROW][C]47[/C][C]-0.02952[/C][C]-0.4175[/C][C]0.338387[/C][/ROW]
[ROW][C]48[/C][C]-0.27786[/C][C]-3.9295[/C][C]5.9e-05[/C][/ROW]
[/TABLE]
Source: https://freestatistics.org/blog/index.php?pk=309463&T=2

Globally Unique Identifier (entire table): ba.freestatistics.org/blog/index.php?pk=309463&T=2

As an alternative you can also use a QR Code:  

The GUIDs for individual cells are displayed in the table below:

Partial Autocorrelation Function
Time lag kPACF(k)T-STATP-value
10.4375796.18830
20.3375624.77382e-06
30.4382556.19790
4-0.068805-0.97310.165851
5-0.037536-0.53080.298059
60.0092910.13140.447799
7-0.209313-2.96010.001723
8-0.026352-0.37270.354891
9-0.069003-0.97590.165158
10-0.091618-1.29570.09829
11-0.04215-0.59610.275896
12-0.257474-3.64120.000173
130.1051411.48690.069306
140.1894512.67920.003997
150.2855074.03773.8e-05
16-0.111463-1.57630.058265
170.0984661.39250.082656
180.0980881.38720.083467
19-0.131244-1.85610.032457
200.0321070.45410.325139
21-0.111559-1.57770.05811
22-0.079091-1.11850.132343
230.0065960.09330.462888
24-0.185552-2.62410.004679
250.0504090.71290.238371
260.1371851.94010.026887
270.0368390.5210.301478
28-0.109619-1.55020.061332
290.0892931.26280.104066
300.0432110.61110.270917
31-0.053957-0.76310.223161
32-0.031042-0.4390.330566
330.0109320.15460.438648
34-0.105087-1.48620.069406
350.0050850.07190.471372
36-0.097628-1.38070.084462
370.0912261.29010.099248
38-0.015501-0.21920.413353
39-0.034493-0.48780.313111
400.0507530.71780.236873
410.0593720.83960.201055
42-0.014778-0.2090.417331
430.0816141.15420.124898
440.0631760.89350.186345
45-0.031612-0.44710.327656
460.1313321.85730.032368
47-0.02952-0.41750.338387
48-0.27786-3.92955.9e-05


Parameters (Session):
Parameters (R input):
par1 = 48 ; par2 = 1 ; par3 = 0 ; par4 = 1 ; par5 = 12 ; par6 = White Noise ; par7 = 0.95 ; par8 = ;
R code (references can be found in the software module):
par8 <- ''
par7 <- ''
par6 <- 'White Noise'
par5 <- '12'
par4 <- '1'
par3 <- '0'
par2 <- '1'
par1 <- '48'
if (par1 == 'Default') {
par1 = 10*log10(length(x))
} else {
par1 <- as.numeric(par1)
}
par2 <- as.numeric(par2)
par3 <- as.numeric(par3)
par4 <- as.numeric(par4)
par5 <- as.numeric(par5)
if (par6 == 'White Noise') par6 <- 'white' else par6 <- 'ma'
par7 <- as.numeric(par7)
if (par8 != '') par8 <- as.numeric(par8)
x <- na.omit(x)
ox <- x
if (par8 == '') {
if (par2 == 0) {
x <- log(x)
} else {
x <- (x ^ par2 - 1) / par2
}
} else {
x <- log(x,base=par8)
}
if (par3 > 0) x <- diff(x,lag=1,difference=par3)
if (par4 > 0) x <- diff(x,lag=par5,difference=par4)
bitmap(file='picts.png')
op <- par(mfrow=c(2,1))
plot(ox,type='l',main='Original Time Series',xlab='time',ylab='value')
if (par8=='') {
mytitle <- paste('Working Time Series (lambda=',par2,', d=',par3,', D=',par4,')',sep='')
mysub <- paste('(lambda=',par2,', d=',par3,', D=',par4,', CI=', par7, ', CI type=',par6,')',sep='')
} else {
mytitle <- paste('Working Time Series (base=',par8,', d=',par3,', D=',par4,')',sep='')
mysub <- paste('(base=',par8,', d=',par3,', D=',par4,', CI=', par7, ', CI type=',par6,')',sep='')
}
plot(x,type='l', main=mytitle,xlab='time',ylab='value')
par(op)
dev.off()
bitmap(file='pic1.png')
racf <- acf(x, par1, main='Autocorrelation', xlab='time lag', ylab='ACF', ci.type=par6, ci=par7, sub=mysub)
dev.off()
bitmap(file='pic2.png')
rpacf <- pacf(x,par1,main='Partial Autocorrelation',xlab='lags',ylab='PACF',sub=mysub)
dev.off()
(myacf <- c(racf$acf))
(mypacf <- c(rpacf$acf))
lengthx <- length(x)
sqrtn <- sqrt(lengthx)
load(file='createtable')
a<-table.start()
a<-table.row.start(a)
a<-table.element(a,'Autocorrelation Function',4,TRUE)
a<-table.row.end(a)
a<-table.row.start(a)
a<-table.element(a,'Time lag k',header=TRUE)
a<-table.element(a,'ACF(k)',header=TRUE)
a<-table.element(a,'T-STAT',header=TRUE)
a<-table.element(a,'P-value',header=TRUE)
a<-table.row.end(a)
for (i in 2:(par1+1)) {
a<-table.row.start(a)
a<-table.element(a,i-1,header=TRUE)
a<-table.element(a,round(myacf[i],6))
mytstat <- myacf[i]*sqrtn
a<-table.element(a,round(mytstat,4))
a<-table.element(a,round(1-pt(abs(mytstat),lengthx),6))
a<-table.row.end(a)
}
a<-table.end(a)
table.save(a,file='mytable.tab')
a<-table.start()
a<-table.row.start(a)
a<-table.element(a,'Partial Autocorrelation Function',4,TRUE)
a<-table.row.end(a)
a<-table.row.start(a)
a<-table.element(a,'Time lag k',header=TRUE)
a<-table.element(a,'PACF(k)',header=TRUE)
a<-table.element(a,'T-STAT',header=TRUE)
a<-table.element(a,'P-value',header=TRUE)
a<-table.row.end(a)
for (i in 1:par1) {
a<-table.row.start(a)
a<-table.element(a,i,header=TRUE)
a<-table.element(a,round(mypacf[i],6))
mytstat <- mypacf[i]*sqrtn
a<-table.element(a,round(mytstat,4))
a<-table.element(a,round(1-pt(abs(mytstat),lengthx),6))
a<-table.row.end(a)
}
a<-table.end(a)
table.save(a,file='mytable1.tab')