Free Statistics

of Irreproducible Research!

Author's title

Author*The author of this computation has been verified*
R Software Modulerwasp_autocorrelation.wasp
Title produced by software(Partial) Autocorrelation Function
Date of computationThu, 14 Dec 2017 12:14:16 +0100
Cite this page as followsStatistical Computations at FreeStatistics.org, Office for Research Development and Education, URL https://freestatistics.org/blog/index.php?v=date/2017/Dec/14/t1513250066nxyrcd2lw9igpty.htm/, Retrieved Mon, 13 May 2024 21:12:23 +0000
Statistical Computations at FreeStatistics.org, Office for Research Development and Education, URL https://freestatistics.org/blog/index.php?pk=309457, Retrieved Mon, 13 May 2024 21:12:23 +0000
QR Codes:

Original text written by user:
IsPrivate?No (this computation is public)
User-defined keywords
Estimated Impact99
Family? (F = Feedback message, R = changed R code, M = changed R Module, P = changed Parameters, D = changed Data)
-       [(Partial) Autocorrelation Function] [Autocorrelatie] [2017-12-14 11:14:16] [b5977ab717675b0b3b579d30e37b73cc] [Current]
Feedback Forum

Post a new message
Dataseries X:
57.7
60.1
66.5
63.4
71.4
68.5
61.6
68.3
69.3
76.1
73.3
69.7
67.4
63.7
73
67.5
74.4
72.9
71.7
75.6
72.5
80
75.4
71
70.6
67.5
74.1
73.2
74
73
74
73
76
81.7
73.5
77
73.6
70.4
74.7
76.8
72.7
76
77.5
73.6
78.5
84.3
74.4
78.5
72.7
71.3
84.4
79.1
76.2
84.9
77.1
78.7
84.7
83.7
82.5
85.2
76
72.2
83.2
80.2
81.1
86
76
83.9
87.9
85
88.1
87.4
79.5
75.2
87.3
79.5
87.6
89.1
83
88.3
88.9
93.9
91.7
87.2
87.8
81
93.7
87.5
91.4
93.8
89.5
93.3
92.8
104.1
99.9
93.4
99
93.2
95.7
102.6
98.8
98
101.5
94.9
104.7
108.4
97
102.3
90.8
89.6
99.9
99.2
94
103
99.8
94.9
102
103.2
98
101.1
88.2
90.3
105.5
99.4
94.3
105.9
98
99
103.9
104.3
105.7
105.5
97.4
95.4
110.5
102.8
110
104.3
96.5
105.6
111.3
108.5
109.1
107.7
102.3
102.4
110.8
101.7
108.9
111.5
104
109.9
106.8
118.4
111.8
105
104.9
96.5
106.3
105.6
109.3
105.1
111.5
103.1
106.5
114.4
104.7
105.5
100.5
96.4
105.1
108.4
105.7
109
107.2
101.6
112.7
115.9
105
110.4
100.9
98.5
111.3
109.6
103.4
115.7
110.4
105.2
113.2
117.4
112.3
113.9
102.2
106.9
118
113.8
114.9
118.8
106.3
114.2
117.3
114.7
117
116.6
106.5
105.7
121
107.8
119.7
121
108.8
115


Summary of computational transaction
Raw Input view raw input (R code)
Raw Outputview raw output of R engine
Computing time1 seconds
R ServerBig Analytics Cloud Computing Center

\begin{tabular}{lllllllll}
\hline
Summary of computational transaction \tabularnewline
Raw Input view raw input (R code)  \tabularnewline
Raw Outputview raw output of R engine  \tabularnewline
Computing time1 seconds \tabularnewline
R ServerBig Analytics Cloud Computing Center \tabularnewline
\hline
\end{tabular}
%Source: https://freestatistics.org/blog/index.php?pk=309457&T=0

[TABLE]
[ROW]
Summary of computational transaction[/C][/ROW] [ROW]Raw Input[/C] view raw input (R code) [/C][/ROW] [ROW]Raw Output[/C]view raw output of R engine [/C][/ROW] [ROW]Computing time[/C]1 seconds[/C][/ROW] [ROW]R Server[/C]Big Analytics Cloud Computing Center[/C][/ROW] [/TABLE] Source: https://freestatistics.org/blog/index.php?pk=309457&T=0

Globally Unique Identifier (entire table): ba.freestatistics.org/blog/index.php?pk=309457&T=0

As an alternative you can also use a QR Code:  

The GUIDs for individual cells are displayed in the table below:

Summary of computational transaction
Raw Input view raw input (R code)
Raw Outputview raw output of R engine
Computing time1 seconds
R ServerBig Analytics Cloud Computing Center


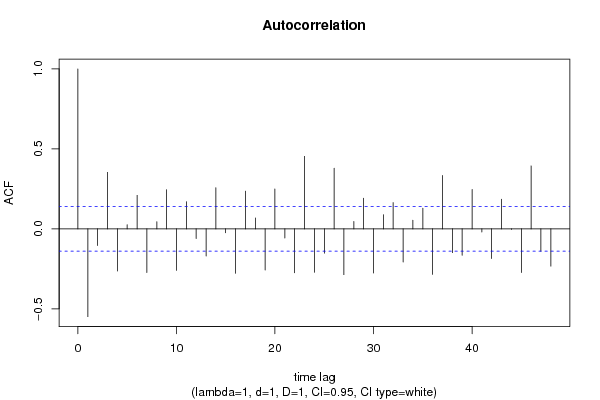
Autocorrelation Function
Time lag kACF(k)T-STATP-value
1-0.54896-7.7440
2-0.104296-1.47130.071399
30.3534374.98581e-06
4-0.264052-3.72490.000127
50.025350.35760.360511
60.2094622.95480.001753
7-0.272939-3.85037.9e-05
80.044260.62440.26655
90.244363.44710.000346
10-0.259578-3.66180.00016
110.1697222.39420.008792
12-0.059837-0.84410.199812
13-0.169479-2.39080.008872
140.257063.62630.000183
15-0.024314-0.3430.365982
16-0.277272-3.91146.3e-05
170.2358133.32650.000524
180.0684380.96540.167749
19-0.256862-3.62350.000185
200.2489433.51180.000275
21-0.05764-0.81310.208561
22-0.274717-3.87547.2e-05
230.4534916.39730
24-0.271066-3.82398.8e-05
25-0.15165-2.13930.016815
260.3794515.35280
27-0.286276-4.03843.8e-05
280.0465930.65730.255881
290.1912012.69720.003796
30-0.275946-3.89276.8e-05
310.0881941.24410.107457
320.1643472.31840.010722
33-0.207454-2.92650.001913
340.053960.76120.223718
350.1285881.8140.035595
36-0.284626-4.01514.2e-05
370.3342594.71532e-06
38-0.14876-2.09850.01856
39-0.164539-2.32110.010647
400.2464623.47680.000312
41-0.020058-0.2830.388751
42-0.185435-2.61590.004791
430.1853682.61490.004804
44-0.003512-0.04950.480268
45-0.272487-3.84398.1e-05
460.393725.55410
47-0.139822-1.97240.024972
48-0.23326-3.29050.000591

\begin{tabular}{lllllllll}
\hline
Autocorrelation Function \tabularnewline
Time lag k & ACF(k) & T-STAT & P-value \tabularnewline
1 & -0.54896 & -7.744 & 0 \tabularnewline
2 & -0.104296 & -1.4713 & 0.071399 \tabularnewline
3 & 0.353437 & 4.9858 & 1e-06 \tabularnewline
4 & -0.264052 & -3.7249 & 0.000127 \tabularnewline
5 & 0.02535 & 0.3576 & 0.360511 \tabularnewline
6 & 0.209462 & 2.9548 & 0.001753 \tabularnewline
7 & -0.272939 & -3.8503 & 7.9e-05 \tabularnewline
8 & 0.04426 & 0.6244 & 0.26655 \tabularnewline
9 & 0.24436 & 3.4471 & 0.000346 \tabularnewline
10 & -0.259578 & -3.6618 & 0.00016 \tabularnewline
11 & 0.169722 & 2.3942 & 0.008792 \tabularnewline
12 & -0.059837 & -0.8441 & 0.199812 \tabularnewline
13 & -0.169479 & -2.3908 & 0.008872 \tabularnewline
14 & 0.25706 & 3.6263 & 0.000183 \tabularnewline
15 & -0.024314 & -0.343 & 0.365982 \tabularnewline
16 & -0.277272 & -3.9114 & 6.3e-05 \tabularnewline
17 & 0.235813 & 3.3265 & 0.000524 \tabularnewline
18 & 0.068438 & 0.9654 & 0.167749 \tabularnewline
19 & -0.256862 & -3.6235 & 0.000185 \tabularnewline
20 & 0.248943 & 3.5118 & 0.000275 \tabularnewline
21 & -0.05764 & -0.8131 & 0.208561 \tabularnewline
22 & -0.274717 & -3.8754 & 7.2e-05 \tabularnewline
23 & 0.453491 & 6.3973 & 0 \tabularnewline
24 & -0.271066 & -3.8239 & 8.8e-05 \tabularnewline
25 & -0.15165 & -2.1393 & 0.016815 \tabularnewline
26 & 0.379451 & 5.3528 & 0 \tabularnewline
27 & -0.286276 & -4.0384 & 3.8e-05 \tabularnewline
28 & 0.046593 & 0.6573 & 0.255881 \tabularnewline
29 & 0.191201 & 2.6972 & 0.003796 \tabularnewline
30 & -0.275946 & -3.8927 & 6.8e-05 \tabularnewline
31 & 0.088194 & 1.2441 & 0.107457 \tabularnewline
32 & 0.164347 & 2.3184 & 0.010722 \tabularnewline
33 & -0.207454 & -2.9265 & 0.001913 \tabularnewline
34 & 0.05396 & 0.7612 & 0.223718 \tabularnewline
35 & 0.128588 & 1.814 & 0.035595 \tabularnewline
36 & -0.284626 & -4.0151 & 4.2e-05 \tabularnewline
37 & 0.334259 & 4.7153 & 2e-06 \tabularnewline
38 & -0.14876 & -2.0985 & 0.01856 \tabularnewline
39 & -0.164539 & -2.3211 & 0.010647 \tabularnewline
40 & 0.246462 & 3.4768 & 0.000312 \tabularnewline
41 & -0.020058 & -0.283 & 0.388751 \tabularnewline
42 & -0.185435 & -2.6159 & 0.004791 \tabularnewline
43 & 0.185368 & 2.6149 & 0.004804 \tabularnewline
44 & -0.003512 & -0.0495 & 0.480268 \tabularnewline
45 & -0.272487 & -3.8439 & 8.1e-05 \tabularnewline
46 & 0.39372 & 5.5541 & 0 \tabularnewline
47 & -0.139822 & -1.9724 & 0.024972 \tabularnewline
48 & -0.23326 & -3.2905 & 0.000591 \tabularnewline
\hline
\end{tabular}
%Source: https://freestatistics.org/blog/index.php?pk=309457&T=1

[TABLE]
[ROW][C]Autocorrelation Function[/C][/ROW]
[ROW][C]Time lag k[/C][C]ACF(k)[/C][C]T-STAT[/C][C]P-value[/C][/ROW]
[ROW][C]1[/C][C]-0.54896[/C][C]-7.744[/C][C]0[/C][/ROW]
[ROW][C]2[/C][C]-0.104296[/C][C]-1.4713[/C][C]0.071399[/C][/ROW]
[ROW][C]3[/C][C]0.353437[/C][C]4.9858[/C][C]1e-06[/C][/ROW]
[ROW][C]4[/C][C]-0.264052[/C][C]-3.7249[/C][C]0.000127[/C][/ROW]
[ROW][C]5[/C][C]0.02535[/C][C]0.3576[/C][C]0.360511[/C][/ROW]
[ROW][C]6[/C][C]0.209462[/C][C]2.9548[/C][C]0.001753[/C][/ROW]
[ROW][C]7[/C][C]-0.272939[/C][C]-3.8503[/C][C]7.9e-05[/C][/ROW]
[ROW][C]8[/C][C]0.04426[/C][C]0.6244[/C][C]0.26655[/C][/ROW]
[ROW][C]9[/C][C]0.24436[/C][C]3.4471[/C][C]0.000346[/C][/ROW]
[ROW][C]10[/C][C]-0.259578[/C][C]-3.6618[/C][C]0.00016[/C][/ROW]
[ROW][C]11[/C][C]0.169722[/C][C]2.3942[/C][C]0.008792[/C][/ROW]
[ROW][C]12[/C][C]-0.059837[/C][C]-0.8441[/C][C]0.199812[/C][/ROW]
[ROW][C]13[/C][C]-0.169479[/C][C]-2.3908[/C][C]0.008872[/C][/ROW]
[ROW][C]14[/C][C]0.25706[/C][C]3.6263[/C][C]0.000183[/C][/ROW]
[ROW][C]15[/C][C]-0.024314[/C][C]-0.343[/C][C]0.365982[/C][/ROW]
[ROW][C]16[/C][C]-0.277272[/C][C]-3.9114[/C][C]6.3e-05[/C][/ROW]
[ROW][C]17[/C][C]0.235813[/C][C]3.3265[/C][C]0.000524[/C][/ROW]
[ROW][C]18[/C][C]0.068438[/C][C]0.9654[/C][C]0.167749[/C][/ROW]
[ROW][C]19[/C][C]-0.256862[/C][C]-3.6235[/C][C]0.000185[/C][/ROW]
[ROW][C]20[/C][C]0.248943[/C][C]3.5118[/C][C]0.000275[/C][/ROW]
[ROW][C]21[/C][C]-0.05764[/C][C]-0.8131[/C][C]0.208561[/C][/ROW]
[ROW][C]22[/C][C]-0.274717[/C][C]-3.8754[/C][C]7.2e-05[/C][/ROW]
[ROW][C]23[/C][C]0.453491[/C][C]6.3973[/C][C]0[/C][/ROW]
[ROW][C]24[/C][C]-0.271066[/C][C]-3.8239[/C][C]8.8e-05[/C][/ROW]
[ROW][C]25[/C][C]-0.15165[/C][C]-2.1393[/C][C]0.016815[/C][/ROW]
[ROW][C]26[/C][C]0.379451[/C][C]5.3528[/C][C]0[/C][/ROW]
[ROW][C]27[/C][C]-0.286276[/C][C]-4.0384[/C][C]3.8e-05[/C][/ROW]
[ROW][C]28[/C][C]0.046593[/C][C]0.6573[/C][C]0.255881[/C][/ROW]
[ROW][C]29[/C][C]0.191201[/C][C]2.6972[/C][C]0.003796[/C][/ROW]
[ROW][C]30[/C][C]-0.275946[/C][C]-3.8927[/C][C]6.8e-05[/C][/ROW]
[ROW][C]31[/C][C]0.088194[/C][C]1.2441[/C][C]0.107457[/C][/ROW]
[ROW][C]32[/C][C]0.164347[/C][C]2.3184[/C][C]0.010722[/C][/ROW]
[ROW][C]33[/C][C]-0.207454[/C][C]-2.9265[/C][C]0.001913[/C][/ROW]
[ROW][C]34[/C][C]0.05396[/C][C]0.7612[/C][C]0.223718[/C][/ROW]
[ROW][C]35[/C][C]0.128588[/C][C]1.814[/C][C]0.035595[/C][/ROW]
[ROW][C]36[/C][C]-0.284626[/C][C]-4.0151[/C][C]4.2e-05[/C][/ROW]
[ROW][C]37[/C][C]0.334259[/C][C]4.7153[/C][C]2e-06[/C][/ROW]
[ROW][C]38[/C][C]-0.14876[/C][C]-2.0985[/C][C]0.01856[/C][/ROW]
[ROW][C]39[/C][C]-0.164539[/C][C]-2.3211[/C][C]0.010647[/C][/ROW]
[ROW][C]40[/C][C]0.246462[/C][C]3.4768[/C][C]0.000312[/C][/ROW]
[ROW][C]41[/C][C]-0.020058[/C][C]-0.283[/C][C]0.388751[/C][/ROW]
[ROW][C]42[/C][C]-0.185435[/C][C]-2.6159[/C][C]0.004791[/C][/ROW]
[ROW][C]43[/C][C]0.185368[/C][C]2.6149[/C][C]0.004804[/C][/ROW]
[ROW][C]44[/C][C]-0.003512[/C][C]-0.0495[/C][C]0.480268[/C][/ROW]
[ROW][C]45[/C][C]-0.272487[/C][C]-3.8439[/C][C]8.1e-05[/C][/ROW]
[ROW][C]46[/C][C]0.39372[/C][C]5.5541[/C][C]0[/C][/ROW]
[ROW][C]47[/C][C]-0.139822[/C][C]-1.9724[/C][C]0.024972[/C][/ROW]
[ROW][C]48[/C][C]-0.23326[/C][C]-3.2905[/C][C]0.000591[/C][/ROW]
[/TABLE]
Source: https://freestatistics.org/blog/index.php?pk=309457&T=1

Globally Unique Identifier (entire table): ba.freestatistics.org/blog/index.php?pk=309457&T=1

As an alternative you can also use a QR Code:  

The GUIDs for individual cells are displayed in the table below:

Autocorrelation Function
Time lag kACF(k)T-STATP-value
1-0.54896-7.7440
2-0.104296-1.47130.071399
30.3534374.98581e-06
4-0.264052-3.72490.000127
50.025350.35760.360511
60.2094622.95480.001753
7-0.272939-3.85037.9e-05
80.044260.62440.26655
90.244363.44710.000346
10-0.259578-3.66180.00016
110.1697222.39420.008792
12-0.059837-0.84410.199812
13-0.169479-2.39080.008872
140.257063.62630.000183
15-0.024314-0.3430.365982
16-0.277272-3.91146.3e-05
170.2358133.32650.000524
180.0684380.96540.167749
19-0.256862-3.62350.000185
200.2489433.51180.000275
21-0.05764-0.81310.208561
22-0.274717-3.87547.2e-05
230.4534916.39730
24-0.271066-3.82398.8e-05
25-0.15165-2.13930.016815
260.3794515.35280
27-0.286276-4.03843.8e-05
280.0465930.65730.255881
290.1912012.69720.003796
30-0.275946-3.89276.8e-05
310.0881941.24410.107457
320.1643472.31840.010722
33-0.207454-2.92650.001913
340.053960.76120.223718
350.1285881.8140.035595
36-0.284626-4.01514.2e-05
370.3342594.71532e-06
38-0.14876-2.09850.01856
39-0.164539-2.32110.010647
400.2464623.47680.000312
41-0.020058-0.2830.388751
42-0.185435-2.61590.004791
430.1853682.61490.004804
44-0.003512-0.04950.480268
45-0.272487-3.84398.1e-05
460.393725.55410
47-0.139822-1.97240.024972
48-0.23326-3.29050.000591


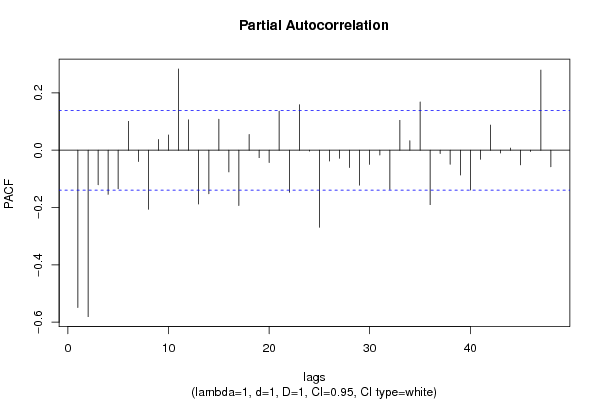
Partial Autocorrelation Function
Time lag kPACF(k)T-STATP-value
1-0.54896-7.7440
2-0.58063-8.19080
3-0.120498-1.69980.045362
4-0.153942-2.17160.015533
5-0.13426-1.8940.02984
60.1006451.41980.078619
7-0.039559-0.5580.288721
8-0.205678-2.90150.002066
90.0374280.5280.299049
100.0532570.75130.226685
110.2835774.00044.5e-05
120.1058631.49340.068461
13-0.187853-2.650.004348
14-0.15204-2.14480.016591
150.1082321.52680.064199
16-0.075555-1.06580.143895
17-0.192854-2.72050.003547
180.0550960.77720.218973
19-0.025854-0.36470.357856
20-0.043098-0.6080.271949
210.1357751.91530.028441
22-0.14668-2.06920.019911
230.1584322.2350.013266
24-0.003048-0.0430.482874
25-0.268852-3.79269.9e-05
26-0.03738-0.52730.299284
27-0.027945-0.39420.346923
28-0.060523-0.85380.197127
29-0.121704-1.71680.043782
30-0.049256-0.69480.243981
31-0.016871-0.2380.406064
32-0.136546-1.92620.027751
330.1042711.47090.071445
340.0328990.46410.321542
350.168562.37780.009181
36-0.189909-2.6790.004001
37-0.011191-0.15790.437359
38-0.048799-0.68840.246003
39-0.086515-1.22040.11187
40-0.138652-1.95590.025937
41-0.03176-0.4480.327312
420.087581.23550.109056
43-0.009972-0.14070.444134
440.0072760.10260.459173
45-0.051003-0.71950.236341
46-0.004373-0.06170.475439
470.2794913.94275.6e-05
48-0.057894-0.81670.207538

\begin{tabular}{lllllllll}
\hline
Partial Autocorrelation Function \tabularnewline
Time lag k & PACF(k) & T-STAT & P-value \tabularnewline
1 & -0.54896 & -7.744 & 0 \tabularnewline
2 & -0.58063 & -8.1908 & 0 \tabularnewline
3 & -0.120498 & -1.6998 & 0.045362 \tabularnewline
4 & -0.153942 & -2.1716 & 0.015533 \tabularnewline
5 & -0.13426 & -1.894 & 0.02984 \tabularnewline
6 & 0.100645 & 1.4198 & 0.078619 \tabularnewline
7 & -0.039559 & -0.558 & 0.288721 \tabularnewline
8 & -0.205678 & -2.9015 & 0.002066 \tabularnewline
9 & 0.037428 & 0.528 & 0.299049 \tabularnewline
10 & 0.053257 & 0.7513 & 0.226685 \tabularnewline
11 & 0.283577 & 4.0004 & 4.5e-05 \tabularnewline
12 & 0.105863 & 1.4934 & 0.068461 \tabularnewline
13 & -0.187853 & -2.65 & 0.004348 \tabularnewline
14 & -0.15204 & -2.1448 & 0.016591 \tabularnewline
15 & 0.108232 & 1.5268 & 0.064199 \tabularnewline
16 & -0.075555 & -1.0658 & 0.143895 \tabularnewline
17 & -0.192854 & -2.7205 & 0.003547 \tabularnewline
18 & 0.055096 & 0.7772 & 0.218973 \tabularnewline
19 & -0.025854 & -0.3647 & 0.357856 \tabularnewline
20 & -0.043098 & -0.608 & 0.271949 \tabularnewline
21 & 0.135775 & 1.9153 & 0.028441 \tabularnewline
22 & -0.14668 & -2.0692 & 0.019911 \tabularnewline
23 & 0.158432 & 2.235 & 0.013266 \tabularnewline
24 & -0.003048 & -0.043 & 0.482874 \tabularnewline
25 & -0.268852 & -3.7926 & 9.9e-05 \tabularnewline
26 & -0.03738 & -0.5273 & 0.299284 \tabularnewline
27 & -0.027945 & -0.3942 & 0.346923 \tabularnewline
28 & -0.060523 & -0.8538 & 0.197127 \tabularnewline
29 & -0.121704 & -1.7168 & 0.043782 \tabularnewline
30 & -0.049256 & -0.6948 & 0.243981 \tabularnewline
31 & -0.016871 & -0.238 & 0.406064 \tabularnewline
32 & -0.136546 & -1.9262 & 0.027751 \tabularnewline
33 & 0.104271 & 1.4709 & 0.071445 \tabularnewline
34 & 0.032899 & 0.4641 & 0.321542 \tabularnewline
35 & 0.16856 & 2.3778 & 0.009181 \tabularnewline
36 & -0.189909 & -2.679 & 0.004001 \tabularnewline
37 & -0.011191 & -0.1579 & 0.437359 \tabularnewline
38 & -0.048799 & -0.6884 & 0.246003 \tabularnewline
39 & -0.086515 & -1.2204 & 0.11187 \tabularnewline
40 & -0.138652 & -1.9559 & 0.025937 \tabularnewline
41 & -0.03176 & -0.448 & 0.327312 \tabularnewline
42 & 0.08758 & 1.2355 & 0.109056 \tabularnewline
43 & -0.009972 & -0.1407 & 0.444134 \tabularnewline
44 & 0.007276 & 0.1026 & 0.459173 \tabularnewline
45 & -0.051003 & -0.7195 & 0.236341 \tabularnewline
46 & -0.004373 & -0.0617 & 0.475439 \tabularnewline
47 & 0.279491 & 3.9427 & 5.6e-05 \tabularnewline
48 & -0.057894 & -0.8167 & 0.207538 \tabularnewline
\hline
\end{tabular}
%Source: https://freestatistics.org/blog/index.php?pk=309457&T=2

[TABLE]
[ROW][C]Partial Autocorrelation Function[/C][/ROW]
[ROW][C]Time lag k[/C][C]PACF(k)[/C][C]T-STAT[/C][C]P-value[/C][/ROW]
[ROW][C]1[/C][C]-0.54896[/C][C]-7.744[/C][C]0[/C][/ROW]
[ROW][C]2[/C][C]-0.58063[/C][C]-8.1908[/C][C]0[/C][/ROW]
[ROW][C]3[/C][C]-0.120498[/C][C]-1.6998[/C][C]0.045362[/C][/ROW]
[ROW][C]4[/C][C]-0.153942[/C][C]-2.1716[/C][C]0.015533[/C][/ROW]
[ROW][C]5[/C][C]-0.13426[/C][C]-1.894[/C][C]0.02984[/C][/ROW]
[ROW][C]6[/C][C]0.100645[/C][C]1.4198[/C][C]0.078619[/C][/ROW]
[ROW][C]7[/C][C]-0.039559[/C][C]-0.558[/C][C]0.288721[/C][/ROW]
[ROW][C]8[/C][C]-0.205678[/C][C]-2.9015[/C][C]0.002066[/C][/ROW]
[ROW][C]9[/C][C]0.037428[/C][C]0.528[/C][C]0.299049[/C][/ROW]
[ROW][C]10[/C][C]0.053257[/C][C]0.7513[/C][C]0.226685[/C][/ROW]
[ROW][C]11[/C][C]0.283577[/C][C]4.0004[/C][C]4.5e-05[/C][/ROW]
[ROW][C]12[/C][C]0.105863[/C][C]1.4934[/C][C]0.068461[/C][/ROW]
[ROW][C]13[/C][C]-0.187853[/C][C]-2.65[/C][C]0.004348[/C][/ROW]
[ROW][C]14[/C][C]-0.15204[/C][C]-2.1448[/C][C]0.016591[/C][/ROW]
[ROW][C]15[/C][C]0.108232[/C][C]1.5268[/C][C]0.064199[/C][/ROW]
[ROW][C]16[/C][C]-0.075555[/C][C]-1.0658[/C][C]0.143895[/C][/ROW]
[ROW][C]17[/C][C]-0.192854[/C][C]-2.7205[/C][C]0.003547[/C][/ROW]
[ROW][C]18[/C][C]0.055096[/C][C]0.7772[/C][C]0.218973[/C][/ROW]
[ROW][C]19[/C][C]-0.025854[/C][C]-0.3647[/C][C]0.357856[/C][/ROW]
[ROW][C]20[/C][C]-0.043098[/C][C]-0.608[/C][C]0.271949[/C][/ROW]
[ROW][C]21[/C][C]0.135775[/C][C]1.9153[/C][C]0.028441[/C][/ROW]
[ROW][C]22[/C][C]-0.14668[/C][C]-2.0692[/C][C]0.019911[/C][/ROW]
[ROW][C]23[/C][C]0.158432[/C][C]2.235[/C][C]0.013266[/C][/ROW]
[ROW][C]24[/C][C]-0.003048[/C][C]-0.043[/C][C]0.482874[/C][/ROW]
[ROW][C]25[/C][C]-0.268852[/C][C]-3.7926[/C][C]9.9e-05[/C][/ROW]
[ROW][C]26[/C][C]-0.03738[/C][C]-0.5273[/C][C]0.299284[/C][/ROW]
[ROW][C]27[/C][C]-0.027945[/C][C]-0.3942[/C][C]0.346923[/C][/ROW]
[ROW][C]28[/C][C]-0.060523[/C][C]-0.8538[/C][C]0.197127[/C][/ROW]
[ROW][C]29[/C][C]-0.121704[/C][C]-1.7168[/C][C]0.043782[/C][/ROW]
[ROW][C]30[/C][C]-0.049256[/C][C]-0.6948[/C][C]0.243981[/C][/ROW]
[ROW][C]31[/C][C]-0.016871[/C][C]-0.238[/C][C]0.406064[/C][/ROW]
[ROW][C]32[/C][C]-0.136546[/C][C]-1.9262[/C][C]0.027751[/C][/ROW]
[ROW][C]33[/C][C]0.104271[/C][C]1.4709[/C][C]0.071445[/C][/ROW]
[ROW][C]34[/C][C]0.032899[/C][C]0.4641[/C][C]0.321542[/C][/ROW]
[ROW][C]35[/C][C]0.16856[/C][C]2.3778[/C][C]0.009181[/C][/ROW]
[ROW][C]36[/C][C]-0.189909[/C][C]-2.679[/C][C]0.004001[/C][/ROW]
[ROW][C]37[/C][C]-0.011191[/C][C]-0.1579[/C][C]0.437359[/C][/ROW]
[ROW][C]38[/C][C]-0.048799[/C][C]-0.6884[/C][C]0.246003[/C][/ROW]
[ROW][C]39[/C][C]-0.086515[/C][C]-1.2204[/C][C]0.11187[/C][/ROW]
[ROW][C]40[/C][C]-0.138652[/C][C]-1.9559[/C][C]0.025937[/C][/ROW]
[ROW][C]41[/C][C]-0.03176[/C][C]-0.448[/C][C]0.327312[/C][/ROW]
[ROW][C]42[/C][C]0.08758[/C][C]1.2355[/C][C]0.109056[/C][/ROW]
[ROW][C]43[/C][C]-0.009972[/C][C]-0.1407[/C][C]0.444134[/C][/ROW]
[ROW][C]44[/C][C]0.007276[/C][C]0.1026[/C][C]0.459173[/C][/ROW]
[ROW][C]45[/C][C]-0.051003[/C][C]-0.7195[/C][C]0.236341[/C][/ROW]
[ROW][C]46[/C][C]-0.004373[/C][C]-0.0617[/C][C]0.475439[/C][/ROW]
[ROW][C]47[/C][C]0.279491[/C][C]3.9427[/C][C]5.6e-05[/C][/ROW]
[ROW][C]48[/C][C]-0.057894[/C][C]-0.8167[/C][C]0.207538[/C][/ROW]
[/TABLE]
Source: https://freestatistics.org/blog/index.php?pk=309457&T=2

Globally Unique Identifier (entire table): ba.freestatistics.org/blog/index.php?pk=309457&T=2

As an alternative you can also use a QR Code:  

The GUIDs for individual cells are displayed in the table below:

Partial Autocorrelation Function
Time lag kPACF(k)T-STATP-value
1-0.54896-7.7440
2-0.58063-8.19080
3-0.120498-1.69980.045362
4-0.153942-2.17160.015533
5-0.13426-1.8940.02984
60.1006451.41980.078619
7-0.039559-0.5580.288721
8-0.205678-2.90150.002066
90.0374280.5280.299049
100.0532570.75130.226685
110.2835774.00044.5e-05
120.1058631.49340.068461
13-0.187853-2.650.004348
14-0.15204-2.14480.016591
150.1082321.52680.064199
16-0.075555-1.06580.143895
17-0.192854-2.72050.003547
180.0550960.77720.218973
19-0.025854-0.36470.357856
20-0.043098-0.6080.271949
210.1357751.91530.028441
22-0.14668-2.06920.019911
230.1584322.2350.013266
24-0.003048-0.0430.482874
25-0.268852-3.79269.9e-05
26-0.03738-0.52730.299284
27-0.027945-0.39420.346923
28-0.060523-0.85380.197127
29-0.121704-1.71680.043782
30-0.049256-0.69480.243981
31-0.016871-0.2380.406064
32-0.136546-1.92620.027751
330.1042711.47090.071445
340.0328990.46410.321542
350.168562.37780.009181
36-0.189909-2.6790.004001
37-0.011191-0.15790.437359
38-0.048799-0.68840.246003
39-0.086515-1.22040.11187
40-0.138652-1.95590.025937
41-0.03176-0.4480.327312
420.087581.23550.109056
43-0.009972-0.14070.444134
440.0072760.10260.459173
45-0.051003-0.71950.236341
46-0.004373-0.06170.475439
470.2794913.94275.6e-05
48-0.057894-0.81670.207538


Parameters (Session):
par1 = 48 ; par2 = 1 ; par3 = 1 ; par4 = 1 ; par5 = 12 ; par6 = White Noise ; par7 = 0.95 ;
Parameters (R input):
par1 = 48 ; par2 = 1 ; par3 = 1 ; par4 = 1 ; par5 = 12 ; par6 = White Noise ; par7 = 0.95 ; par8 = ;
R code (references can be found in the software module):
if (par1 == 'Default') {
par1 = 10*log10(length(x))
} else {
par1 <- as.numeric(par1)
}
par2 <- as.numeric(par2)
par3 <- as.numeric(par3)
par4 <- as.numeric(par4)
par5 <- as.numeric(par5)
if (par6 == 'White Noise') par6 <- 'white' else par6 <- 'ma'
par7 <- as.numeric(par7)
if (par8 != '') par8 <- as.numeric(par8)
x <- na.omit(x)
ox <- x
if (par8 == '') {
if (par2 == 0) {
x <- log(x)
} else {
x <- (x ^ par2 - 1) / par2
}
} else {
x <- log(x,base=par8)
}
if (par3 > 0) x <- diff(x,lag=1,difference=par3)
if (par4 > 0) x <- diff(x,lag=par5,difference=par4)
bitmap(file='picts.png')
op <- par(mfrow=c(2,1))
plot(ox,type='l',main='Original Time Series',xlab='time',ylab='value')
if (par8=='') {
mytitle <- paste('Working Time Series (lambda=',par2,', d=',par3,', D=',par4,')',sep='')
mysub <- paste('(lambda=',par2,', d=',par3,', D=',par4,', CI=', par7, ', CI type=',par6,')',sep='')
} else {
mytitle <- paste('Working Time Series (base=',par8,', d=',par3,', D=',par4,')',sep='')
mysub <- paste('(base=',par8,', d=',par3,', D=',par4,', CI=', par7, ', CI type=',par6,')',sep='')
}
plot(x,type='l', main=mytitle,xlab='time',ylab='value')
par(op)
dev.off()
bitmap(file='pic1.png')
racf <- acf(x, par1, main='Autocorrelation', xlab='time lag', ylab='ACF', ci.type=par6, ci=par7, sub=mysub)
dev.off()
bitmap(file='pic2.png')
rpacf <- pacf(x,par1,main='Partial Autocorrelation',xlab='lags',ylab='PACF',sub=mysub)
dev.off()
(myacf <- c(racf$acf))
(mypacf <- c(rpacf$acf))
lengthx <- length(x)
sqrtn <- sqrt(lengthx)
load(file='createtable')
a<-table.start()
a<-table.row.start(a)
a<-table.element(a,'Autocorrelation Function',4,TRUE)
a<-table.row.end(a)
a<-table.row.start(a)
a<-table.element(a,'Time lag k',header=TRUE)
a<-table.element(a,'ACF(k)',header=TRUE)
a<-table.element(a,'T-STAT',header=TRUE)
a<-table.element(a,'P-value',header=TRUE)
a<-table.row.end(a)
for (i in 2:(par1+1)) {
a<-table.row.start(a)
a<-table.element(a,i-1,header=TRUE)
a<-table.element(a,round(myacf[i],6))
mytstat <- myacf[i]*sqrtn
a<-table.element(a,round(mytstat,4))
a<-table.element(a,round(1-pt(abs(mytstat),lengthx),6))
a<-table.row.end(a)
}
a<-table.end(a)
table.save(a,file='mytable.tab')
a<-table.start()
a<-table.row.start(a)
a<-table.element(a,'Partial Autocorrelation Function',4,TRUE)
a<-table.row.end(a)
a<-table.row.start(a)
a<-table.element(a,'Time lag k',header=TRUE)
a<-table.element(a,'PACF(k)',header=TRUE)
a<-table.element(a,'T-STAT',header=TRUE)
a<-table.element(a,'P-value',header=TRUE)
a<-table.row.end(a)
for (i in 1:par1) {
a<-table.row.start(a)
a<-table.element(a,i,header=TRUE)
a<-table.element(a,round(mypacf[i],6))
mytstat <- mypacf[i]*sqrtn
a<-table.element(a,round(mytstat,4))
a<-table.element(a,round(1-pt(abs(mytstat),lengthx),6))
a<-table.row.end(a)
}
a<-table.end(a)
table.save(a,file='mytable1.tab')