Free Statistics

of Irreproducible Research!

Author's title

Author*The author of this computation has been verified*
R Software Modulerwasp_autocorrelation.wasp
Title produced by software(Partial) Autocorrelation Function
Date of computationThu, 14 Dec 2017 12:11:32 +0100
Cite this page as followsStatistical Computations at FreeStatistics.org, Office for Research Development and Education, URL https://freestatistics.org/blog/index.php?v=date/2017/Dec/14/t15132499644o4adidxaknonmx.htm/, Retrieved Tue, 14 May 2024 14:43:45 +0000
Statistical Computations at FreeStatistics.org, Office for Research Development and Education, URL https://freestatistics.org/blog/index.php?pk=309455, Retrieved Tue, 14 May 2024 14:43:45 +0000
QR Codes:

Original text written by user:
IsPrivate?No (this computation is public)
User-defined keywords
Estimated Impact95
Family? (F = Feedback message, R = changed R code, M = changed R Module, P = changed Parameters, D = changed Data)
-       [(Partial) Autocorrelation Function] [Autocorrelatie] [2017-12-14 11:11:32] [b5977ab717675b0b3b579d30e37b73cc] [Current]
Feedback Forum

Post a new message
Dataseries X:
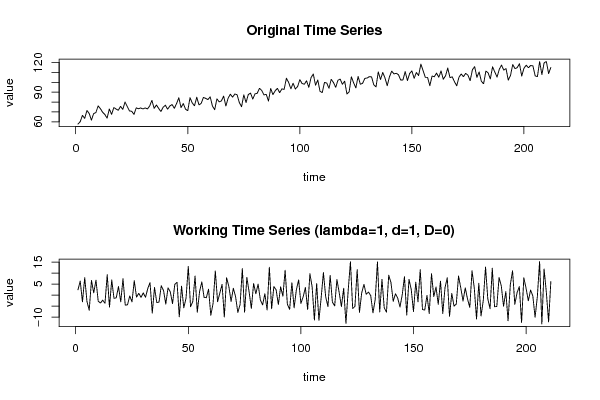
57.7
60.1
66.5
63.4
71.4
68.5
61.6
68.3
69.3
76.1
73.3
69.7
67.4
63.7
73
67.5
74.4
72.9
71.7
75.6
72.5
80
75.4
71
70.6
67.5
74.1
73.2
74
73
74
73
76
81.7
73.5
77
73.6
70.4
74.7
76.8
72.7
76
77.5
73.6
78.5
84.3
74.4
78.5
72.7
71.3
84.4
79.1
76.2
84.9
77.1
78.7
84.7
83.7
82.5
85.2
76
72.2
83.2
80.2
81.1
86
76
83.9
87.9
85
88.1
87.4
79.5
75.2
87.3
79.5
87.6
89.1
83
88.3
88.9
93.9
91.7
87.2
87.8
81
93.7
87.5
91.4
93.8
89.5
93.3
92.8
104.1
99.9
93.4
99
93.2
95.7
102.6
98.8
98
101.5
94.9
104.7
108.4
97
102.3
90.8
89.6
99.9
99.2
94
103
99.8
94.9
102
103.2
98
101.1
88.2
90.3
105.5
99.4
94.3
105.9
98
99
103.9
104.3
105.7
105.5
97.4
95.4
110.5
102.8
110
104.3
96.5
105.6
111.3
108.5
109.1
107.7
102.3
102.4
110.8
101.7
108.9
111.5
104
109.9
106.8
118.4
111.8
105
104.9
96.5
106.3
105.6
109.3
105.1
111.5
103.1
106.5
114.4
104.7
105.5
100.5
96.4
105.1
108.4
105.7
109
107.2
101.6
112.7
115.9
105
110.4
100.9
98.5
111.3
109.6
103.4
115.7
110.4
105.2
113.2
117.4
112.3
113.9
102.2
106.9
118
113.8
114.9
118.8
106.3
114.2
117.3
114.7
117
116.6
106.5
105.7
121
107.8
119.7
121
108.8
115


Summary of computational transaction
Raw Input view raw input (R code)
Raw Outputview raw output of R engine
Computing time2 seconds
R ServerBig Analytics Cloud Computing Center

\begin{tabular}{lllllllll}
\hline
Summary of computational transaction \tabularnewline
Raw Input view raw input (R code)  \tabularnewline
Raw Outputview raw output of R engine  \tabularnewline
Computing time2 seconds \tabularnewline
R ServerBig Analytics Cloud Computing Center \tabularnewline
\hline
\end{tabular}
%Source: https://freestatistics.org/blog/index.php?pk=309455&T=0

[TABLE]
[ROW]
Summary of computational transaction[/C][/ROW] [ROW]Raw Input[/C] view raw input (R code) [/C][/ROW] [ROW]Raw Output[/C]view raw output of R engine [/C][/ROW] [ROW]Computing time[/C]2 seconds[/C][/ROW] [ROW]R Server[/C]Big Analytics Cloud Computing Center[/C][/ROW] [/TABLE] Source: https://freestatistics.org/blog/index.php?pk=309455&T=0

Globally Unique Identifier (entire table): ba.freestatistics.org/blog/index.php?pk=309455&T=0

As an alternative you can also use a QR Code:  

The GUIDs for individual cells are displayed in the table below:

Summary of computational transaction
Raw Input view raw input (R code)
Raw Outputview raw output of R engine
Computing time2 seconds
R ServerBig Analytics Cloud Computing Center


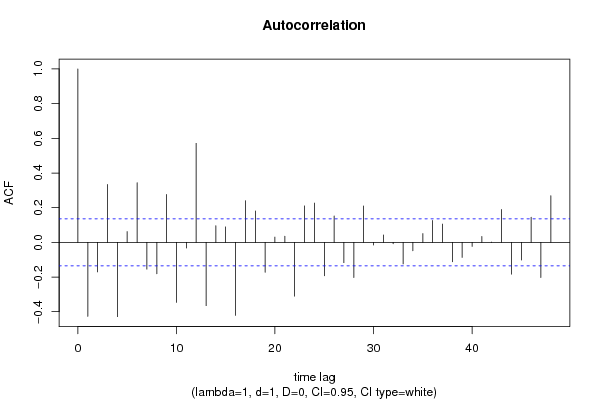
Autocorrelation Function
Time lag kACF(k)T-STATP-value
1-0.426635-6.19720
2-0.170348-2.47440.007066
30.3341474.85381e-06
4-0.42838-6.22260
50.0620770.90170.184117
60.344084.99811e-06
7-0.154314-2.24150.013016
8-0.181128-2.6310.00457
90.2762514.01284.2e-05
10-0.346291-5.03021e-06
11-0.03299-0.47920.316146
120.5707088.290
13-0.364791-5.29890
140.0961721.3970.081945
150.0891681.29520.098326
16-0.421226-6.11870
170.2403423.49120.000293
180.1805332.62240.004684
19-0.172184-2.50110.00657
200.0304260.4420.329483
210.0355360.51620.30313
22-0.310103-4.50456e-06
230.2102713.05440.001273
240.2263373.28770.000592
25-0.193024-2.80380.002761
260.151712.20370.014313
27-0.116842-1.69720.045565
28-0.202397-2.940.001824
290.2095093.04330.001319
30-0.015419-0.2240.411499
310.0427010.62030.267878
32-0.007763-0.11280.455165
33-0.124065-1.80210.036475
34-0.048677-0.70710.240151
350.0502970.73060.232916
360.1265951.83890.033667
370.105231.52860.063936
38-0.111607-1.62120.053236
39-0.086799-1.26080.104381
40-0.023279-0.33820.367792
410.03410.49530.31044
420.0008710.01270.494957
430.1892782.74940.003244
44-0.183242-2.66170.004186
45-0.101344-1.47210.07124
460.1449672.10580.018204
47-0.202485-2.94130.001817
480.268513.90036.5e-05

\begin{tabular}{lllllllll}
\hline
Autocorrelation Function \tabularnewline
Time lag k & ACF(k) & T-STAT & P-value \tabularnewline
1 & -0.426635 & -6.1972 & 0 \tabularnewline
2 & -0.170348 & -2.4744 & 0.007066 \tabularnewline
3 & 0.334147 & 4.8538 & 1e-06 \tabularnewline
4 & -0.42838 & -6.2226 & 0 \tabularnewline
5 & 0.062077 & 0.9017 & 0.184117 \tabularnewline
6 & 0.34408 & 4.9981 & 1e-06 \tabularnewline
7 & -0.154314 & -2.2415 & 0.013016 \tabularnewline
8 & -0.181128 & -2.631 & 0.00457 \tabularnewline
9 & 0.276251 & 4.0128 & 4.2e-05 \tabularnewline
10 & -0.346291 & -5.0302 & 1e-06 \tabularnewline
11 & -0.03299 & -0.4792 & 0.316146 \tabularnewline
12 & 0.570708 & 8.29 & 0 \tabularnewline
13 & -0.364791 & -5.2989 & 0 \tabularnewline
14 & 0.096172 & 1.397 & 0.081945 \tabularnewline
15 & 0.089168 & 1.2952 & 0.098326 \tabularnewline
16 & -0.421226 & -6.1187 & 0 \tabularnewline
17 & 0.240342 & 3.4912 & 0.000293 \tabularnewline
18 & 0.180533 & 2.6224 & 0.004684 \tabularnewline
19 & -0.172184 & -2.5011 & 0.00657 \tabularnewline
20 & 0.030426 & 0.442 & 0.329483 \tabularnewline
21 & 0.035536 & 0.5162 & 0.30313 \tabularnewline
22 & -0.310103 & -4.5045 & 6e-06 \tabularnewline
23 & 0.210271 & 3.0544 & 0.001273 \tabularnewline
24 & 0.226337 & 3.2877 & 0.000592 \tabularnewline
25 & -0.193024 & -2.8038 & 0.002761 \tabularnewline
26 & 0.15171 & 2.2037 & 0.014313 \tabularnewline
27 & -0.116842 & -1.6972 & 0.045565 \tabularnewline
28 & -0.202397 & -2.94 & 0.001824 \tabularnewline
29 & 0.209509 & 3.0433 & 0.001319 \tabularnewline
30 & -0.015419 & -0.224 & 0.411499 \tabularnewline
31 & 0.042701 & 0.6203 & 0.267878 \tabularnewline
32 & -0.007763 & -0.1128 & 0.455165 \tabularnewline
33 & -0.124065 & -1.8021 & 0.036475 \tabularnewline
34 & -0.048677 & -0.7071 & 0.240151 \tabularnewline
35 & 0.050297 & 0.7306 & 0.232916 \tabularnewline
36 & 0.126595 & 1.8389 & 0.033667 \tabularnewline
37 & 0.10523 & 1.5286 & 0.063936 \tabularnewline
38 & -0.111607 & -1.6212 & 0.053236 \tabularnewline
39 & -0.086799 & -1.2608 & 0.104381 \tabularnewline
40 & -0.023279 & -0.3382 & 0.367792 \tabularnewline
41 & 0.0341 & 0.4953 & 0.31044 \tabularnewline
42 & 0.000871 & 0.0127 & 0.494957 \tabularnewline
43 & 0.189278 & 2.7494 & 0.003244 \tabularnewline
44 & -0.183242 & -2.6617 & 0.004186 \tabularnewline
45 & -0.101344 & -1.4721 & 0.07124 \tabularnewline
46 & 0.144967 & 2.1058 & 0.018204 \tabularnewline
47 & -0.202485 & -2.9413 & 0.001817 \tabularnewline
48 & 0.26851 & 3.9003 & 6.5e-05 \tabularnewline
\hline
\end{tabular}
%Source: https://freestatistics.org/blog/index.php?pk=309455&T=1

[TABLE]
[ROW][C]Autocorrelation Function[/C][/ROW]
[ROW][C]Time lag k[/C][C]ACF(k)[/C][C]T-STAT[/C][C]P-value[/C][/ROW]
[ROW][C]1[/C][C]-0.426635[/C][C]-6.1972[/C][C]0[/C][/ROW]
[ROW][C]2[/C][C]-0.170348[/C][C]-2.4744[/C][C]0.007066[/C][/ROW]
[ROW][C]3[/C][C]0.334147[/C][C]4.8538[/C][C]1e-06[/C][/ROW]
[ROW][C]4[/C][C]-0.42838[/C][C]-6.2226[/C][C]0[/C][/ROW]
[ROW][C]5[/C][C]0.062077[/C][C]0.9017[/C][C]0.184117[/C][/ROW]
[ROW][C]6[/C][C]0.34408[/C][C]4.9981[/C][C]1e-06[/C][/ROW]
[ROW][C]7[/C][C]-0.154314[/C][C]-2.2415[/C][C]0.013016[/C][/ROW]
[ROW][C]8[/C][C]-0.181128[/C][C]-2.631[/C][C]0.00457[/C][/ROW]
[ROW][C]9[/C][C]0.276251[/C][C]4.0128[/C][C]4.2e-05[/C][/ROW]
[ROW][C]10[/C][C]-0.346291[/C][C]-5.0302[/C][C]1e-06[/C][/ROW]
[ROW][C]11[/C][C]-0.03299[/C][C]-0.4792[/C][C]0.316146[/C][/ROW]
[ROW][C]12[/C][C]0.570708[/C][C]8.29[/C][C]0[/C][/ROW]
[ROW][C]13[/C][C]-0.364791[/C][C]-5.2989[/C][C]0[/C][/ROW]
[ROW][C]14[/C][C]0.096172[/C][C]1.397[/C][C]0.081945[/C][/ROW]
[ROW][C]15[/C][C]0.089168[/C][C]1.2952[/C][C]0.098326[/C][/ROW]
[ROW][C]16[/C][C]-0.421226[/C][C]-6.1187[/C][C]0[/C][/ROW]
[ROW][C]17[/C][C]0.240342[/C][C]3.4912[/C][C]0.000293[/C][/ROW]
[ROW][C]18[/C][C]0.180533[/C][C]2.6224[/C][C]0.004684[/C][/ROW]
[ROW][C]19[/C][C]-0.172184[/C][C]-2.5011[/C][C]0.00657[/C][/ROW]
[ROW][C]20[/C][C]0.030426[/C][C]0.442[/C][C]0.329483[/C][/ROW]
[ROW][C]21[/C][C]0.035536[/C][C]0.5162[/C][C]0.30313[/C][/ROW]
[ROW][C]22[/C][C]-0.310103[/C][C]-4.5045[/C][C]6e-06[/C][/ROW]
[ROW][C]23[/C][C]0.210271[/C][C]3.0544[/C][C]0.001273[/C][/ROW]
[ROW][C]24[/C][C]0.226337[/C][C]3.2877[/C][C]0.000592[/C][/ROW]
[ROW][C]25[/C][C]-0.193024[/C][C]-2.8038[/C][C]0.002761[/C][/ROW]
[ROW][C]26[/C][C]0.15171[/C][C]2.2037[/C][C]0.014313[/C][/ROW]
[ROW][C]27[/C][C]-0.116842[/C][C]-1.6972[/C][C]0.045565[/C][/ROW]
[ROW][C]28[/C][C]-0.202397[/C][C]-2.94[/C][C]0.001824[/C][/ROW]
[ROW][C]29[/C][C]0.209509[/C][C]3.0433[/C][C]0.001319[/C][/ROW]
[ROW][C]30[/C][C]-0.015419[/C][C]-0.224[/C][C]0.411499[/C][/ROW]
[ROW][C]31[/C][C]0.042701[/C][C]0.6203[/C][C]0.267878[/C][/ROW]
[ROW][C]32[/C][C]-0.007763[/C][C]-0.1128[/C][C]0.455165[/C][/ROW]
[ROW][C]33[/C][C]-0.124065[/C][C]-1.8021[/C][C]0.036475[/C][/ROW]
[ROW][C]34[/C][C]-0.048677[/C][C]-0.7071[/C][C]0.240151[/C][/ROW]
[ROW][C]35[/C][C]0.050297[/C][C]0.7306[/C][C]0.232916[/C][/ROW]
[ROW][C]36[/C][C]0.126595[/C][C]1.8389[/C][C]0.033667[/C][/ROW]
[ROW][C]37[/C][C]0.10523[/C][C]1.5286[/C][C]0.063936[/C][/ROW]
[ROW][C]38[/C][C]-0.111607[/C][C]-1.6212[/C][C]0.053236[/C][/ROW]
[ROW][C]39[/C][C]-0.086799[/C][C]-1.2608[/C][C]0.104381[/C][/ROW]
[ROW][C]40[/C][C]-0.023279[/C][C]-0.3382[/C][C]0.367792[/C][/ROW]
[ROW][C]41[/C][C]0.0341[/C][C]0.4953[/C][C]0.31044[/C][/ROW]
[ROW][C]42[/C][C]0.000871[/C][C]0.0127[/C][C]0.494957[/C][/ROW]
[ROW][C]43[/C][C]0.189278[/C][C]2.7494[/C][C]0.003244[/C][/ROW]
[ROW][C]44[/C][C]-0.183242[/C][C]-2.6617[/C][C]0.004186[/C][/ROW]
[ROW][C]45[/C][C]-0.101344[/C][C]-1.4721[/C][C]0.07124[/C][/ROW]
[ROW][C]46[/C][C]0.144967[/C][C]2.1058[/C][C]0.018204[/C][/ROW]
[ROW][C]47[/C][C]-0.202485[/C][C]-2.9413[/C][C]0.001817[/C][/ROW]
[ROW][C]48[/C][C]0.26851[/C][C]3.9003[/C][C]6.5e-05[/C][/ROW]
[/TABLE]
Source: https://freestatistics.org/blog/index.php?pk=309455&T=1

Globally Unique Identifier (entire table): ba.freestatistics.org/blog/index.php?pk=309455&T=1

As an alternative you can also use a QR Code:  

The GUIDs for individual cells are displayed in the table below:

Autocorrelation Function
Time lag kACF(k)T-STATP-value
1-0.426635-6.19720
2-0.170348-2.47440.007066
30.3341474.85381e-06
4-0.42838-6.22260
50.0620770.90170.184117
60.344084.99811e-06
7-0.154314-2.24150.013016
8-0.181128-2.6310.00457
90.2762514.01284.2e-05
10-0.346291-5.03021e-06
11-0.03299-0.47920.316146
120.5707088.290
13-0.364791-5.29890
140.0961721.3970.081945
150.0891681.29520.098326
16-0.421226-6.11870
170.2403423.49120.000293
180.1805332.62240.004684
19-0.172184-2.50110.00657
200.0304260.4420.329483
210.0355360.51620.30313
22-0.310103-4.50456e-06
230.2102713.05440.001273
240.2263373.28770.000592
25-0.193024-2.80380.002761
260.151712.20370.014313
27-0.116842-1.69720.045565
28-0.202397-2.940.001824
290.2095093.04330.001319
30-0.015419-0.2240.411499
310.0427010.62030.267878
32-0.007763-0.11280.455165
33-0.124065-1.80210.036475
34-0.048677-0.70710.240151
350.0502970.73060.232916
360.1265951.83890.033667
370.105231.52860.063936
38-0.111607-1.62120.053236
39-0.086799-1.26080.104381
40-0.023279-0.33820.367792
410.03410.49530.31044
420.0008710.01270.494957
430.1892782.74940.003244
44-0.183242-2.66170.004186
45-0.101344-1.47210.07124
460.1449672.10580.018204
47-0.202485-2.94130.001817
480.268513.90036.5e-05


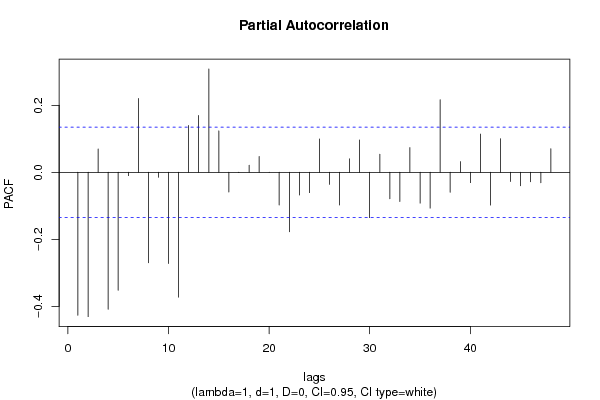
Partial Autocorrelation Function
Time lag kPACF(k)T-STATP-value
1-0.426635-6.19720
2-0.430773-6.25730
30.069621.01130.156519
4-0.408577-5.93490
5-0.352137-5.11510
6-0.010118-0.1470.441645
70.2202073.19870.000797
8-0.269932-3.9216e-05
9-0.0149-0.21640.41443
10-0.272356-3.95625.2e-05
11-0.372546-5.41150
120.1396362.02830.021891
130.1692762.45890.007371
140.3083014.47836e-06
150.1234571.79330.037177
16-0.058926-0.85590.1965
17-0.000741-0.01080.495711
180.0208490.30280.381154
190.0473480.68780.246178
20-0.000218-0.00320.498737
21-0.097426-1.41520.079244
22-0.177536-2.57890.005296
23-0.067881-0.9860.162625
24-0.060781-0.88290.18915
250.0994681.44490.07499
26-0.036104-0.52440.300261
27-0.09773-1.41960.078599
280.0400580.58190.280637
290.0961751.3970.081936
30-0.135451-1.96750.025215
310.0540080.78450.216812
32-0.079051-1.14830.126076
33-0.087346-1.26880.102961
340.0735081.06780.143424
35-0.092058-1.33720.091295
36-0.106923-1.55310.060944
370.2165923.14620.000946
38-0.05942-0.86310.194525
390.03180.46190.322309
40-0.030896-0.44880.327023
410.113921.65480.049728
42-0.097921-1.42240.078195
430.099971.45210.073973
44-0.027522-0.39980.344864
45-0.040291-0.58530.279499
46-0.028352-0.41180.34044
47-0.031521-0.45790.32376
480.0702741.02080.154262

\begin{tabular}{lllllllll}
\hline
Partial Autocorrelation Function \tabularnewline
Time lag k & PACF(k) & T-STAT & P-value \tabularnewline
1 & -0.426635 & -6.1972 & 0 \tabularnewline
2 & -0.430773 & -6.2573 & 0 \tabularnewline
3 & 0.06962 & 1.0113 & 0.156519 \tabularnewline
4 & -0.408577 & -5.9349 & 0 \tabularnewline
5 & -0.352137 & -5.1151 & 0 \tabularnewline
6 & -0.010118 & -0.147 & 0.441645 \tabularnewline
7 & 0.220207 & 3.1987 & 0.000797 \tabularnewline
8 & -0.269932 & -3.921 & 6e-05 \tabularnewline
9 & -0.0149 & -0.2164 & 0.41443 \tabularnewline
10 & -0.272356 & -3.9562 & 5.2e-05 \tabularnewline
11 & -0.372546 & -5.4115 & 0 \tabularnewline
12 & 0.139636 & 2.0283 & 0.021891 \tabularnewline
13 & 0.169276 & 2.4589 & 0.007371 \tabularnewline
14 & 0.308301 & 4.4783 & 6e-06 \tabularnewline
15 & 0.123457 & 1.7933 & 0.037177 \tabularnewline
16 & -0.058926 & -0.8559 & 0.1965 \tabularnewline
17 & -0.000741 & -0.0108 & 0.495711 \tabularnewline
18 & 0.020849 & 0.3028 & 0.381154 \tabularnewline
19 & 0.047348 & 0.6878 & 0.246178 \tabularnewline
20 & -0.000218 & -0.0032 & 0.498737 \tabularnewline
21 & -0.097426 & -1.4152 & 0.079244 \tabularnewline
22 & -0.177536 & -2.5789 & 0.005296 \tabularnewline
23 & -0.067881 & -0.986 & 0.162625 \tabularnewline
24 & -0.060781 & -0.8829 & 0.18915 \tabularnewline
25 & 0.099468 & 1.4449 & 0.07499 \tabularnewline
26 & -0.036104 & -0.5244 & 0.300261 \tabularnewline
27 & -0.09773 & -1.4196 & 0.078599 \tabularnewline
28 & 0.040058 & 0.5819 & 0.280637 \tabularnewline
29 & 0.096175 & 1.397 & 0.081936 \tabularnewline
30 & -0.135451 & -1.9675 & 0.025215 \tabularnewline
31 & 0.054008 & 0.7845 & 0.216812 \tabularnewline
32 & -0.079051 & -1.1483 & 0.126076 \tabularnewline
33 & -0.087346 & -1.2688 & 0.102961 \tabularnewline
34 & 0.073508 & 1.0678 & 0.143424 \tabularnewline
35 & -0.092058 & -1.3372 & 0.091295 \tabularnewline
36 & -0.106923 & -1.5531 & 0.060944 \tabularnewline
37 & 0.216592 & 3.1462 & 0.000946 \tabularnewline
38 & -0.05942 & -0.8631 & 0.194525 \tabularnewline
39 & 0.0318 & 0.4619 & 0.322309 \tabularnewline
40 & -0.030896 & -0.4488 & 0.327023 \tabularnewline
41 & 0.11392 & 1.6548 & 0.049728 \tabularnewline
42 & -0.097921 & -1.4224 & 0.078195 \tabularnewline
43 & 0.09997 & 1.4521 & 0.073973 \tabularnewline
44 & -0.027522 & -0.3998 & 0.344864 \tabularnewline
45 & -0.040291 & -0.5853 & 0.279499 \tabularnewline
46 & -0.028352 & -0.4118 & 0.34044 \tabularnewline
47 & -0.031521 & -0.4579 & 0.32376 \tabularnewline
48 & 0.070274 & 1.0208 & 0.154262 \tabularnewline
\hline
\end{tabular}
%Source: https://freestatistics.org/blog/index.php?pk=309455&T=2

[TABLE]
[ROW][C]Partial Autocorrelation Function[/C][/ROW]
[ROW][C]Time lag k[/C][C]PACF(k)[/C][C]T-STAT[/C][C]P-value[/C][/ROW]
[ROW][C]1[/C][C]-0.426635[/C][C]-6.1972[/C][C]0[/C][/ROW]
[ROW][C]2[/C][C]-0.430773[/C][C]-6.2573[/C][C]0[/C][/ROW]
[ROW][C]3[/C][C]0.06962[/C][C]1.0113[/C][C]0.156519[/C][/ROW]
[ROW][C]4[/C][C]-0.408577[/C][C]-5.9349[/C][C]0[/C][/ROW]
[ROW][C]5[/C][C]-0.352137[/C][C]-5.1151[/C][C]0[/C][/ROW]
[ROW][C]6[/C][C]-0.010118[/C][C]-0.147[/C][C]0.441645[/C][/ROW]
[ROW][C]7[/C][C]0.220207[/C][C]3.1987[/C][C]0.000797[/C][/ROW]
[ROW][C]8[/C][C]-0.269932[/C][C]-3.921[/C][C]6e-05[/C][/ROW]
[ROW][C]9[/C][C]-0.0149[/C][C]-0.2164[/C][C]0.41443[/C][/ROW]
[ROW][C]10[/C][C]-0.272356[/C][C]-3.9562[/C][C]5.2e-05[/C][/ROW]
[ROW][C]11[/C][C]-0.372546[/C][C]-5.4115[/C][C]0[/C][/ROW]
[ROW][C]12[/C][C]0.139636[/C][C]2.0283[/C][C]0.021891[/C][/ROW]
[ROW][C]13[/C][C]0.169276[/C][C]2.4589[/C][C]0.007371[/C][/ROW]
[ROW][C]14[/C][C]0.308301[/C][C]4.4783[/C][C]6e-06[/C][/ROW]
[ROW][C]15[/C][C]0.123457[/C][C]1.7933[/C][C]0.037177[/C][/ROW]
[ROW][C]16[/C][C]-0.058926[/C][C]-0.8559[/C][C]0.1965[/C][/ROW]
[ROW][C]17[/C][C]-0.000741[/C][C]-0.0108[/C][C]0.495711[/C][/ROW]
[ROW][C]18[/C][C]0.020849[/C][C]0.3028[/C][C]0.381154[/C][/ROW]
[ROW][C]19[/C][C]0.047348[/C][C]0.6878[/C][C]0.246178[/C][/ROW]
[ROW][C]20[/C][C]-0.000218[/C][C]-0.0032[/C][C]0.498737[/C][/ROW]
[ROW][C]21[/C][C]-0.097426[/C][C]-1.4152[/C][C]0.079244[/C][/ROW]
[ROW][C]22[/C][C]-0.177536[/C][C]-2.5789[/C][C]0.005296[/C][/ROW]
[ROW][C]23[/C][C]-0.067881[/C][C]-0.986[/C][C]0.162625[/C][/ROW]
[ROW][C]24[/C][C]-0.060781[/C][C]-0.8829[/C][C]0.18915[/C][/ROW]
[ROW][C]25[/C][C]0.099468[/C][C]1.4449[/C][C]0.07499[/C][/ROW]
[ROW][C]26[/C][C]-0.036104[/C][C]-0.5244[/C][C]0.300261[/C][/ROW]
[ROW][C]27[/C][C]-0.09773[/C][C]-1.4196[/C][C]0.078599[/C][/ROW]
[ROW][C]28[/C][C]0.040058[/C][C]0.5819[/C][C]0.280637[/C][/ROW]
[ROW][C]29[/C][C]0.096175[/C][C]1.397[/C][C]0.081936[/C][/ROW]
[ROW][C]30[/C][C]-0.135451[/C][C]-1.9675[/C][C]0.025215[/C][/ROW]
[ROW][C]31[/C][C]0.054008[/C][C]0.7845[/C][C]0.216812[/C][/ROW]
[ROW][C]32[/C][C]-0.079051[/C][C]-1.1483[/C][C]0.126076[/C][/ROW]
[ROW][C]33[/C][C]-0.087346[/C][C]-1.2688[/C][C]0.102961[/C][/ROW]
[ROW][C]34[/C][C]0.073508[/C][C]1.0678[/C][C]0.143424[/C][/ROW]
[ROW][C]35[/C][C]-0.092058[/C][C]-1.3372[/C][C]0.091295[/C][/ROW]
[ROW][C]36[/C][C]-0.106923[/C][C]-1.5531[/C][C]0.060944[/C][/ROW]
[ROW][C]37[/C][C]0.216592[/C][C]3.1462[/C][C]0.000946[/C][/ROW]
[ROW][C]38[/C][C]-0.05942[/C][C]-0.8631[/C][C]0.194525[/C][/ROW]
[ROW][C]39[/C][C]0.0318[/C][C]0.4619[/C][C]0.322309[/C][/ROW]
[ROW][C]40[/C][C]-0.030896[/C][C]-0.4488[/C][C]0.327023[/C][/ROW]
[ROW][C]41[/C][C]0.11392[/C][C]1.6548[/C][C]0.049728[/C][/ROW]
[ROW][C]42[/C][C]-0.097921[/C][C]-1.4224[/C][C]0.078195[/C][/ROW]
[ROW][C]43[/C][C]0.09997[/C][C]1.4521[/C][C]0.073973[/C][/ROW]
[ROW][C]44[/C][C]-0.027522[/C][C]-0.3998[/C][C]0.344864[/C][/ROW]
[ROW][C]45[/C][C]-0.040291[/C][C]-0.5853[/C][C]0.279499[/C][/ROW]
[ROW][C]46[/C][C]-0.028352[/C][C]-0.4118[/C][C]0.34044[/C][/ROW]
[ROW][C]47[/C][C]-0.031521[/C][C]-0.4579[/C][C]0.32376[/C][/ROW]
[ROW][C]48[/C][C]0.070274[/C][C]1.0208[/C][C]0.154262[/C][/ROW]
[/TABLE]
Source: https://freestatistics.org/blog/index.php?pk=309455&T=2

Globally Unique Identifier (entire table): ba.freestatistics.org/blog/index.php?pk=309455&T=2

As an alternative you can also use a QR Code:  

The GUIDs for individual cells are displayed in the table below:

Partial Autocorrelation Function
Time lag kPACF(k)T-STATP-value
1-0.426635-6.19720
2-0.430773-6.25730
30.069621.01130.156519
4-0.408577-5.93490
5-0.352137-5.11510
6-0.010118-0.1470.441645
70.2202073.19870.000797
8-0.269932-3.9216e-05
9-0.0149-0.21640.41443
10-0.272356-3.95625.2e-05
11-0.372546-5.41150
120.1396362.02830.021891
130.1692762.45890.007371
140.3083014.47836e-06
150.1234571.79330.037177
16-0.058926-0.85590.1965
17-0.000741-0.01080.495711
180.0208490.30280.381154
190.0473480.68780.246178
20-0.000218-0.00320.498737
21-0.097426-1.41520.079244
22-0.177536-2.57890.005296
23-0.067881-0.9860.162625
24-0.060781-0.88290.18915
250.0994681.44490.07499
26-0.036104-0.52440.300261
27-0.09773-1.41960.078599
280.0400580.58190.280637
290.0961751.3970.081936
30-0.135451-1.96750.025215
310.0540080.78450.216812
32-0.079051-1.14830.126076
33-0.087346-1.26880.102961
340.0735081.06780.143424
35-0.092058-1.33720.091295
36-0.106923-1.55310.060944
370.2165923.14620.000946
38-0.05942-0.86310.194525
390.03180.46190.322309
40-0.030896-0.44880.327023
410.113921.65480.049728
42-0.097921-1.42240.078195
430.099971.45210.073973
44-0.027522-0.39980.344864
45-0.040291-0.58530.279499
46-0.028352-0.41180.34044
47-0.031521-0.45790.32376
480.0702741.02080.154262


Parameters (Session):
par1 = 48 ; par2 = 1 ; par3 = 1 ; par4 = 0 ; par5 = 12 ; par6 = White Noise ; par7 = 0.95 ;
Parameters (R input):
par1 = 48 ; par2 = 1 ; par3 = 1 ; par4 = 0 ; par5 = 12 ; par6 = White Noise ; par7 = 0.95 ; par8 = ;
R code (references can be found in the software module):
par8 <- ''
par7 <- '0.95'
par6 <- 'White Noise'
par5 <- '12'
par4 <- '0'
par3 <- '1'
par2 <- '1'
par1 <- 'Default'
if (par1 == 'Default') {
par1 = 10*log10(length(x))
} else {
par1 <- as.numeric(par1)
}
par2 <- as.numeric(par2)
par3 <- as.numeric(par3)
par4 <- as.numeric(par4)
par5 <- as.numeric(par5)
if (par6 == 'White Noise') par6 <- 'white' else par6 <- 'ma'
par7 <- as.numeric(par7)
if (par8 != '') par8 <- as.numeric(par8)
x <- na.omit(x)
ox <- x
if (par8 == '') {
if (par2 == 0) {
x <- log(x)
} else {
x <- (x ^ par2 - 1) / par2
}
} else {
x <- log(x,base=par8)
}
if (par3 > 0) x <- diff(x,lag=1,difference=par3)
if (par4 > 0) x <- diff(x,lag=par5,difference=par4)
bitmap(file='picts.png')
op <- par(mfrow=c(2,1))
plot(ox,type='l',main='Original Time Series',xlab='time',ylab='value')
if (par8=='') {
mytitle <- paste('Working Time Series (lambda=',par2,', d=',par3,', D=',par4,')',sep='')
mysub <- paste('(lambda=',par2,', d=',par3,', D=',par4,', CI=', par7, ', CI type=',par6,')',sep='')
} else {
mytitle <- paste('Working Time Series (base=',par8,', d=',par3,', D=',par4,')',sep='')
mysub <- paste('(base=',par8,', d=',par3,', D=',par4,', CI=', par7, ', CI type=',par6,')',sep='')
}
plot(x,type='l', main=mytitle,xlab='time',ylab='value')
par(op)
dev.off()
bitmap(file='pic1.png')
racf <- acf(x, par1, main='Autocorrelation', xlab='time lag', ylab='ACF', ci.type=par6, ci=par7, sub=mysub)
dev.off()
bitmap(file='pic2.png')
rpacf <- pacf(x,par1,main='Partial Autocorrelation',xlab='lags',ylab='PACF',sub=mysub)
dev.off()
(myacf <- c(racf$acf))
(mypacf <- c(rpacf$acf))
lengthx <- length(x)
sqrtn <- sqrt(lengthx)
load(file='createtable')
a<-table.start()
a<-table.row.start(a)
a<-table.element(a,'Autocorrelation Function',4,TRUE)
a<-table.row.end(a)
a<-table.row.start(a)
a<-table.element(a,'Time lag k',header=TRUE)
a<-table.element(a,'ACF(k)',header=TRUE)
a<-table.element(a,'T-STAT',header=TRUE)
a<-table.element(a,'P-value',header=TRUE)
a<-table.row.end(a)
for (i in 2:(par1+1)) {
a<-table.row.start(a)
a<-table.element(a,i-1,header=TRUE)
a<-table.element(a,round(myacf[i],6))
mytstat <- myacf[i]*sqrtn
a<-table.element(a,round(mytstat,4))
a<-table.element(a,round(1-pt(abs(mytstat),lengthx),6))
a<-table.row.end(a)
}
a<-table.end(a)
table.save(a,file='mytable.tab')
a<-table.start()
a<-table.row.start(a)
a<-table.element(a,'Partial Autocorrelation Function',4,TRUE)
a<-table.row.end(a)
a<-table.row.start(a)
a<-table.element(a,'Time lag k',header=TRUE)
a<-table.element(a,'PACF(k)',header=TRUE)
a<-table.element(a,'T-STAT',header=TRUE)
a<-table.element(a,'P-value',header=TRUE)
a<-table.row.end(a)
for (i in 1:par1) {
a<-table.row.start(a)
a<-table.element(a,i,header=TRUE)
a<-table.element(a,round(mypacf[i],6))
mytstat <- mypacf[i]*sqrtn
a<-table.element(a,round(mytstat,4))
a<-table.element(a,round(1-pt(abs(mytstat),lengthx),6))
a<-table.row.end(a)
}
a<-table.end(a)
table.save(a,file='mytable1.tab')