Free Statistics

of Irreproducible Research!

Author's title

Author*The author of this computation has been verified*
R Software Modulerwasp_correlation.wasp
Title produced by softwarePearson Correlation
Date of computationThu, 14 Dec 2017 11:32:48 +0100
Cite this page as followsStatistical Computations at FreeStatistics.org, Office for Research Development and Education, URL https://freestatistics.org/blog/index.php?v=date/2017/Dec/14/t1513248658bfj2tcwjaze5tpw.htm/, Retrieved Tue, 14 May 2024 10:25:13 +0000
Statistical Computations at FreeStatistics.org, Office for Research Development and Education, URL https://freestatistics.org/blog/index.php?pk=309451, Retrieved Tue, 14 May 2024 10:25:13 +0000
QR Codes:

Original text written by user:
IsPrivate?No (this computation is public)
User-defined keywords
Estimated Impact115
Family? (F = Feedback message, R = changed R code, M = changed R Module, P = changed Parameters, D = changed Data)
-       [Pearson Correlation] [] [2017-12-14 10:32:48] [9a0500678ac6582dde72933c6904687c] [Current]
Feedback Forum

Post a new message
Dataseries X:
89080.61599
54394.33427
47681.16746
53561.89212
75799.60618
44874.88121
59471.01588
51865.71799
50497.2368
51965.89141
44477.93581
50067.04279
50782.5207
11493.72654
26977.62882
36006.0215
40621.31307
46466.12297
24323.57284
32954.23304
107352.7109
41431.03961
44670.37007
6665.193496
17972.09208
23258.93644
33615.97151
45239.3688
29494.41285
20343.68375
22479.00875
33313.83278
17352.66344
24080.76256
67901.21881
14090.11941
14932.60268
14701.95389
21183.46489
21533.46995
39034.37628
14042.28147
10323.20694
13517.83487
22390.68285
7045.118138
9158.519314
36259.39194
17132.08878
13856.69518
7299.552445
10645.45626
10398.76096
10229.2269
9077.414805
5593.061202
5916.289691
13312.02706
3506.731828
4419.442634
Dataseries Y:
0,948
0,937
0,892
0,909
0,938
0,924
0,923
0,924
0,923
0,92
0,919
0,919
0,918
0,805
0,854
0,913
0,908
0,902
0,899
0,898
0,896
0,894
0,895
0,798
0,842
0,888
0,881
0,893
0,882
0,875
0,865
0,864
0,863
0,853
0,855
0,852
0,846
0,845
0,845
0,841
0,836
0,834
0,826
0,823
0,823
0,804
0,798
0,799
0,795
0,794
0,792
0,793
0,787
0,785
0,775
0,775
0,774
0,764
0,764
0,762


Summary of computational transaction
Raw Input view raw input (R code)
Raw Outputview raw output of R engine
Computing time5 seconds
R ServerBig Analytics Cloud Computing Center

\begin{tabular}{lllllllll}
\hline
Summary of computational transaction \tabularnewline
Raw Input view raw input (R code)  \tabularnewline
Raw Outputview raw output of R engine  \tabularnewline
Computing time5 seconds \tabularnewline
R ServerBig Analytics Cloud Computing Center \tabularnewline
\hline
\end{tabular}
%Source: https://freestatistics.org/blog/index.php?pk=309451&T=0

[TABLE]
[ROW]
Summary of computational transaction[/C][/ROW] [ROW]Raw Input[/C] view raw input (R code) [/C][/ROW] [ROW]Raw Output[/C]view raw output of R engine [/C][/ROW] [ROW]Computing time[/C]5 seconds[/C][/ROW] [ROW]R Server[/C]Big Analytics Cloud Computing Center[/C][/ROW] [/TABLE] Source: https://freestatistics.org/blog/index.php?pk=309451&T=0

Globally Unique Identifier (entire table): ba.freestatistics.org/blog/index.php?pk=309451&T=0

As an alternative you can also use a QR Code:  

The GUIDs for individual cells are displayed in the table below:

Summary of computational transaction
Raw Input view raw input (R code)
Raw Outputview raw output of R engine
Computing time5 seconds
R ServerBig Analytics Cloud Computing Center


Pearson Product Moment Correlation - Ungrouped Data
StatisticVariable XVariable Y
Mean30468.89189338330.855816666666667
Biased Variance478724137.8906160.00285884972222222
Biased Standard Deviation21879.76548984510.0534682122594558
Covariance939.266222481699
Correlation0.789498191723877
Determination0.623307394735272
T-Test9.79651457660334
p-value (2 sided)6.61234794115947e-14
p-value (1 sided)3.30617397057973e-14
95% CI of Correlation[0.669862996336109, 0.869176410434377]
Degrees of Freedom58
Number of Observations60

\begin{tabular}{lllllllll}
\hline
Pearson Product Moment Correlation - Ungrouped Data \tabularnewline
Statistic & Variable X & Variable Y \tabularnewline
Mean & 30468.8918933833 & 0.855816666666667 \tabularnewline
Biased Variance & 478724137.890616 & 0.00285884972222222 \tabularnewline
Biased Standard Deviation & 21879.7654898451 & 0.0534682122594558 \tabularnewline
Covariance & 939.266222481699 \tabularnewline
Correlation & 0.789498191723877 \tabularnewline
Determination & 0.623307394735272 \tabularnewline
T-Test & 9.79651457660334 \tabularnewline
p-value (2 sided) & 6.61234794115947e-14 \tabularnewline
p-value (1 sided) & 3.30617397057973e-14 \tabularnewline
95% CI of Correlation & [0.669862996336109, 0.869176410434377] \tabularnewline
Degrees of Freedom & 58 \tabularnewline
Number of Observations & 60 \tabularnewline
\hline
\end{tabular}
%Source: https://freestatistics.org/blog/index.php?pk=309451&T=1

[TABLE]
[ROW][C]Pearson Product Moment Correlation - Ungrouped Data[/C][/ROW]
[ROW][C]Statistic[/C][C]Variable X[/C][C]Variable Y[/C][/ROW]
[ROW][C]Mean[/C][C]30468.8918933833[/C][C]0.855816666666667[/C][/ROW]
[ROW][C]Biased Variance[/C][C]478724137.890616[/C][C]0.00285884972222222[/C][/ROW]
[ROW][C]Biased Standard Deviation[/C][C]21879.7654898451[/C][C]0.0534682122594558[/C][/ROW]
[ROW][C]Covariance[/C][C]939.266222481699[/C][/ROW]
[ROW][C]Correlation[/C][C]0.789498191723877[/C][/ROW]
[ROW][C]Determination[/C][C]0.623307394735272[/C][/ROW]
[ROW][C]T-Test[/C][C]9.79651457660334[/C][/ROW]
[ROW][C]p-value (2 sided)[/C][C]6.61234794115947e-14[/C][/ROW]
[ROW][C]p-value (1 sided)[/C][C]3.30617397057973e-14[/C][/ROW]
[ROW][C]95% CI of Correlation[/C][C][0.669862996336109, 0.869176410434377][/C][/ROW]
[ROW][C]Degrees of Freedom[/C][C]58[/C][/ROW]
[ROW][C]Number of Observations[/C][C]60[/C][/ROW]
[/TABLE]
Source: https://freestatistics.org/blog/index.php?pk=309451&T=1

Globally Unique Identifier (entire table): ba.freestatistics.org/blog/index.php?pk=309451&T=1

As an alternative you can also use a QR Code:  

The GUIDs for individual cells are displayed in the table below:

Pearson Product Moment Correlation - Ungrouped Data
StatisticVariable XVariable Y
Mean30468.89189338330.855816666666667
Biased Variance478724137.8906160.00285884972222222
Biased Standard Deviation21879.76548984510.0534682122594558
Covariance939.266222481699
Correlation0.789498191723877
Determination0.623307394735272
T-Test9.79651457660334
p-value (2 sided)6.61234794115947e-14
p-value (1 sided)3.30617397057973e-14
95% CI of Correlation[0.669862996336109, 0.869176410434377]
Degrees of Freedom58
Number of Observations60


Normality Tests
> jarque.x
	Jarque-Bera Normality Test
data:  x
JB = 17.508, p-value = 0.0001578
alternative hypothesis: greater
> jarque.y
	Jarque-Bera Normality Test
data:  y
JB = 4.0189, p-value = 0.1341
alternative hypothesis: greater
> ad.x
	Anderson-Darling normality test
data:  x
A = 1.5545, p-value = 0.0004756
> ad.y
	Anderson-Darling normality test
data:  y
A = 1.0162, p-value = 0.01042

\begin{tabular}{lllllllll}
\hline
Normality Tests \tabularnewline
> jarque.x
	Jarque-Bera Normality Test
data:  x
JB = 17.508, p-value = 0.0001578
alternative hypothesis: greater
\tabularnewline
> jarque.y
	Jarque-Bera Normality Test
data:  y
JB = 4.0189, p-value = 0.1341
alternative hypothesis: greater
\tabularnewline
> ad.x
	Anderson-Darling normality test
data:  x
A = 1.5545, p-value = 0.0004756
\tabularnewline
> ad.y
	Anderson-Darling normality test
data:  y
A = 1.0162, p-value = 0.01042
\tabularnewline \hline \end{tabular} %Source: https://freestatistics.org/blog/index.php?pk=309451&T=2

[TABLE]
[ROW][C]Normality Tests[/C][/ROW]
[ROW][C]
> jarque.x
	Jarque-Bera Normality Test
data:  x
JB = 17.508, p-value = 0.0001578
alternative hypothesis: greater
[/C][/ROW] [ROW][C]
> jarque.y
	Jarque-Bera Normality Test
data:  y
JB = 4.0189, p-value = 0.1341
alternative hypothesis: greater
[/C][/ROW] [ROW][C]
> ad.x
	Anderson-Darling normality test
data:  x
A = 1.5545, p-value = 0.0004756
[/C][/ROW] [ROW][C]
> ad.y
	Anderson-Darling normality test
data:  y
A = 1.0162, p-value = 0.01042
[/C][/ROW] [/TABLE] Source: https://freestatistics.org/blog/index.php?pk=309451&T=2

Globally Unique Identifier (entire table): ba.freestatistics.org/blog/index.php?pk=309451&T=2

As an alternative you can also use a QR Code:  

The GUIDs for individual cells are displayed in the table below:

Normality Tests
> jarque.x
	Jarque-Bera Normality Test
data:  x
JB = 17.508, p-value = 0.0001578
alternative hypothesis: greater
> jarque.y
	Jarque-Bera Normality Test
data:  y
JB = 4.0189, p-value = 0.1341
alternative hypothesis: greater
> ad.x
	Anderson-Darling normality test
data:  x
A = 1.5545, p-value = 0.0004756
> ad.y
	Anderson-Darling normality test
data:  y
A = 1.0162, p-value = 0.01042


Parameters (Session):
Parameters (R input):
R code (references can be found in the software module):
library(psychometric)
x <- x[!is.na(y)]
y <- y[!is.na(y)]
y <- y[!is.na(x)]
x <- x[!is.na(x)]
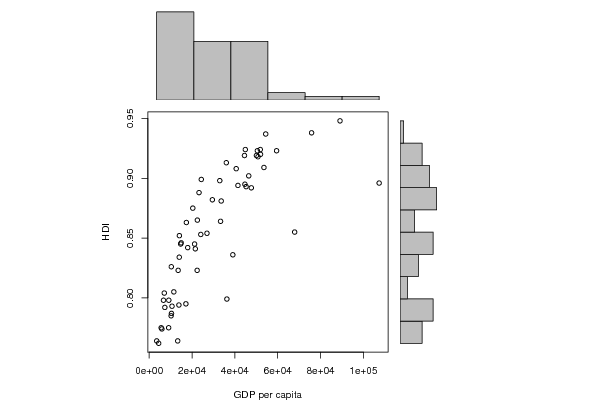
bitmap(file='test1.png')
histx <- hist(x, plot=FALSE)
histy <- hist(y, plot=FALSE)
maxcounts <- max(c(histx$counts, histx$counts))
xrange <- c(min(x),max(x))
yrange <- c(min(y),max(y))
nf <- layout(matrix(c(2,0,1,3),2,2,byrow=TRUE), c(3,1), c(1,3), TRUE)
par(mar=c(4,4,1,1))
plot(x, y, xlim=xrange, ylim=yrange, xlab=xlab, ylab=ylab, sub=main)
par(mar=c(0,4,1,1))
barplot(histx$counts, axes=FALSE, ylim=c(0, maxcounts), space=0)
par(mar=c(4,0,1,1))
barplot(histy$counts, axes=FALSE, xlim=c(0, maxcounts), space=0, horiz=TRUE)
dev.off()
lx = length(x)
makebiased = (lx-1)/lx
varx = var(x)*makebiased
vary = var(y)*makebiased
corxy <- cor.test(x,y,method='pearson', na.rm = T)
cxy <- as.matrix(corxy$estimate)[1,1]
load(file='createtable')
a<-table.start()
a<-table.row.start(a)
a<-table.element(a,'Pearson Product Moment Correlation - Ungrouped Data',3,TRUE)
a<-table.row.end(a)
a<-table.row.start(a)
a<-table.element(a,'Statistic',1,TRUE)
a<-table.element(a,'Variable X',1,TRUE)
a<-table.element(a,'Variable Y',1,TRUE)
a<-table.row.end(a)
a<-table.row.start(a)
a<-table.element(a,'Mean',header=TRUE)
a<-table.element(a,mean(x))
a<-table.element(a,mean(y))
a<-table.row.end(a)
a<-table.row.start(a)
a<-table.element(a,'Biased Variance',header=TRUE)
a<-table.element(a,varx)
a<-table.element(a,vary)
a<-table.row.end(a)
a<-table.row.start(a)
a<-table.element(a,'Biased Standard Deviation',header=TRUE)
a<-table.element(a,sqrt(varx))
a<-table.element(a,sqrt(vary))
a<-table.row.end(a)
a<-table.row.start(a)
a<-table.element(a,'Covariance',header=TRUE)
a<-table.element(a,cov(x,y),2)
a<-table.row.end(a)
a<-table.row.start(a)
a<-table.element(a,'Correlation',header=TRUE)
a<-table.element(a,cxy,2)
a<-table.row.end(a)
a<-table.row.start(a)
a<-table.element(a,'Determination',header=TRUE)
a<-table.element(a,cxy*cxy,2)
a<-table.row.end(a)
a<-table.row.start(a)
a<-table.element(a,'T-Test',header=TRUE)
a<-table.element(a,as.matrix(corxy$statistic)[1,1],2)
a<-table.row.end(a)
a<-table.row.start(a)
a<-table.element(a,'p-value (2 sided)',header=TRUE)
a<-table.element(a,(p2 <- as.matrix(corxy$p.value)[1,1]),2)
a<-table.row.end(a)
a<-table.row.start(a)
a<-table.element(a,'p-value (1 sided)',header=TRUE)
a<-table.element(a,p2/2,2)
a<-table.row.end(a)
a<-table.row.start(a)
a<-table.element(a,'95% CI of Correlation',header=TRUE)
a<-table.element(a,paste('[',CIr(r=cxy, n = lx, level = .95)[1],', ', CIr(r=cxy, n = lx, level = .95)[2],']',sep=''),2)
a<-table.row.end(a)
a<-table.row.start(a)
a<-table.element(a,'Degrees of Freedom',header=TRUE)
a<-table.element(a,lx-2,2)
a<-table.row.end(a)
a<-table.row.start(a)
a<-table.element(a,'Number of Observations',header=TRUE)
a<-table.element(a,lx,2)
a<-table.row.end(a)
a<-table.end(a)
table.save(a,file='mytable.tab')
library(moments)
library(nortest)
jarque.x <- jarque.test(x)
jarque.y <- jarque.test(y)
if(lx>7) {
ad.x <- ad.test(x)
ad.y <- ad.test(y)
}
a<-table.start()
a<-table.row.start(a)
a<-table.element(a,'Normality Tests',1,TRUE)
a<-table.row.end(a)
a<-table.row.start(a)
a<-table.element(a,paste('
',RC.texteval('jarque.x'),'
',sep=''))
a<-table.row.end(a)
a<-table.row.start(a)
a<-table.element(a,paste('
',RC.texteval('jarque.y'),'
',sep=''))
a<-table.row.end(a)
if(lx>7) {
a<-table.row.start(a)
a<-table.element(a,paste('
',RC.texteval('ad.x'),'
',sep=''))
a<-table.row.end(a)
a<-table.row.start(a)
a<-table.element(a,paste('
',RC.texteval('ad.y'),'
',sep=''))
a<-table.row.end(a)
}
a<-table.end(a)
table.save(a,file='mytable1.tab')
library(car)
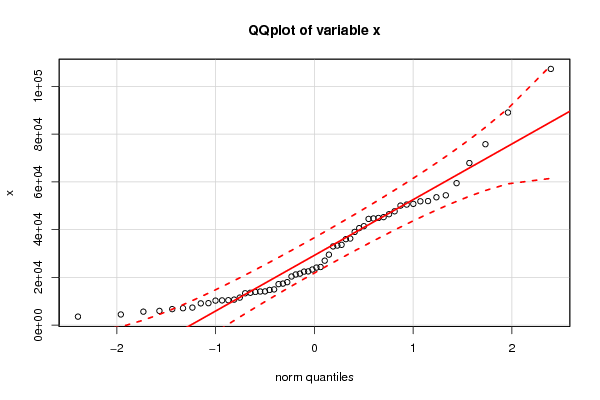
bitmap(file='test2.png')
qqPlot(x,main='QQplot of variable x')
dev.off()
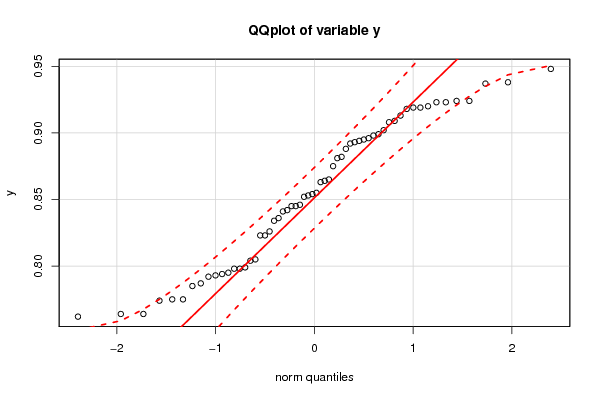
bitmap(file='test3.png')
qqPlot(y,main='QQplot of variable y')
dev.off()