par9 <- '0'
par8 <- '1'
par7 <- '1'
par6 <- '3'
par5 <- '12'
par4 <- '0'
par3 <- '1'
par2 <- '1.2'
par1 <- 'FALSE'
library(lattice)
if (par1 == 'TRUE') par1 <- TRUE
if (par1 == 'FALSE') par1 <- FALSE
par2 <- as.numeric(par2) #Box-Cox lambda transformation parameter
par3 <- as.numeric(par3) #degree of non-seasonal differencing
par4 <- as.numeric(par4) #degree of seasonal differencing
par5 <- as.numeric(par5) #seasonal period
par6 <- as.numeric(par6) #degree (p) of the non-seasonal AR(p) polynomial
par7 <- as.numeric(par7) #degree (q) of the non-seasonal MA(q) polynomial
par8 <- as.numeric(par8) #degree (P) of the seasonal AR(P) polynomial
par9 <- as.numeric(par9) #degree (Q) of the seasonal MA(Q) polynomial
armaGR <- function(arima.out, names, n){
try1 <- arima.out$coef
try2 <- sqrt(diag(arima.out$var.coef))
try.data.frame  <- data.frame(matrix(NA,ncol=4,nrow=length(names)))
dimnames(try.data.frame) <- list(names,c('coef','std','tstat','pv'))
try.data.frame[,1] <- try1
for(i in 1:length(try2)) try.data.frame[which(rownames(try.data.frame)==names(try2)[i]),2] <- try2[i]
try.data.frame[,3] <- try.data.frame[,1] / try.data.frame[,2]
try.data.frame[,4] <- round((1-pt(abs(try.data.frame[,3]),df=n-(length(try2)+1)))*2,5)
vector <- rep(NA,length(names))
vector[is.na(try.data.frame[,4])] <- 0
maxi <- which.max(try.data.frame[,4])
continue <- max(try.data.frame[,4],na.rm=TRUE) > .05
vector[maxi] <- 0
list(summary=try.data.frame,next.vector=vector,continue=continue)
}
arimaSelect <- function(series, order=c(13,0,0), seasonal=list(order=c(2,0,0),period=12), include.mean=F){
nrc <- order[1]+order[3]+seasonal$order[1]+seasonal$order[3]
coeff <- matrix(NA, nrow=nrc*2, ncol=nrc)
pval <- matrix(NA, nrow=nrc*2, ncol=nrc)
mylist <- rep(list(NULL), nrc)
names  <- NULL
if(order[1] > 0) names <- paste('ar',1:order[1],sep='')
if(order[3] > 0) names <- c( names , paste('ma',1:order[3],sep='') )
if(seasonal$order[1] > 0) names <- c(names, paste('sar',1:seasonal$order[1],sep=''))
if(seasonal$order[3] > 0) names <- c(names, paste('sma',1:seasonal$order[3],sep=''))
arima.out <- arima(series, order=order, seasonal=seasonal, include.mean=include.mean, method='ML')
mylist[[1]] <- arima.out
last.arma <- armaGR(arima.out, names, length(series))
mystop <- FALSE
i <- 1
coeff[i,] <- last.arma[[1]][,1]
pval [i,] <- last.arma[[1]][,4]
i <- 2
aic <- arima.out$aic
while(!mystop){
mylist[[i]] <- arima.out
arima.out <- arima(series, order=order, seasonal=seasonal, include.mean=include.mean, method='ML', fixed=last.arma$next.vector)
aic <- c(aic, arima.out$aic)
last.arma <- armaGR(arima.out, names, length(series))
mystop <- !last.arma$continue
coeff[i,] <- last.arma[[1]][,1]
pval [i,] <- last.arma[[1]][,4]
i <- i+1
}
list(coeff, pval, mylist, aic=aic)
}
arimaSelectplot <- function(arimaSelect.out,noms,choix){
noms <- names(arimaSelect.out[[3]][[1]]$coef)
coeff <- arimaSelect.out[[1]]
k <- min(which(is.na(coeff[,1])))-1
coeff <- coeff[1:k,]
pval  <- arimaSelect.out[[2]][1:k,]
aic   <- arimaSelect.out$aic[1:k]
coeff[coeff==0] <- NA
n <- ncol(coeff)
if(missing(choix)) choix <- k
layout(matrix(c(1,1,1,2,
3,3,3,2,
3,3,3,4,
5,6,7,7),nr=4),
widths=c(10,35,45,15),
heights=c(30,30,15,15))
couleurs <- rainbow(75)[1:50]#(50)
ticks <- pretty(coeff)
par(mar=c(1,1,3,1))
plot(aic,k:1-.5,type='o',pch=21,bg='blue',cex=2,axes=F,lty=2,xpd=NA)
points(aic[choix],k-choix+.5,pch=21,cex=4,bg=2,xpd=NA)
title('aic',line=2)
par(mar=c(3,0,0,0))
plot(0,axes=F,xlab='',ylab='',xlim=range(ticks),ylim=c(.1,1))
rect(xleft  = min(ticks) + (0:49)/50*(max(ticks)-min(ticks)),
xright = min(ticks) + (1:50)/50*(max(ticks)-min(ticks)),
ytop   = rep(1,50),
ybottom= rep(0,50),col=couleurs,border=NA)
axis(1,ticks)
rect(xleft=min(ticks),xright=max(ticks),ytop=1,ybottom=0)
text(mean(coeff,na.rm=T),.5,'coefficients',cex=2,font=2)
par(mar=c(1,1,3,1))
image(1:n,1:k,t(coeff[k:1,]),axes=F,col=couleurs,zlim=range(ticks))
for(i in 1:n) for(j in 1:k) if(!is.na(coeff[j,i])) {
if(pval[j,i]<.01)                            symb = 'green'
else if( (pval[j,i]<.05) & (pval[j,i]>=.01)) symb = 'orange'
else if( (pval[j,i]<.1)  & (pval[j,i]>=.05)) symb = 'red'
else                                         symb = 'black'
polygon(c(i+.5   ,i+.2   ,i+.5   ,i+.5),
c(k-j+0.5,k-j+0.5,k-j+0.8,k-j+0.5),
col=symb)
if(j==choix)  {
rect(xleft=i-.5,
xright=i+.5,
ybottom=k-j+1.5,
ytop=k-j+.5,
lwd=4)
text(i,
k-j+1,
round(coeff[j,i],2),
cex=1.2,
font=2)
}
else{
rect(xleft=i-.5,xright=i+.5,ybottom=k-j+1.5,ytop=k-j+.5)
text(i,k-j+1,round(coeff[j,i],2),cex=1.2,font=1)
}
}
axis(3,1:n,noms)
par(mar=c(0.5,0,0,0.5))
plot(0,axes=F,xlab='',ylab='',type='n',xlim=c(0,8),ylim=c(-.2,.8))
cols <- c('green','orange','red','black')
niv  <- c('0','0.01','0.05','0.1')
for(i in 0:3){
polygon(c(1+2*i   ,1+2*i   ,1+2*i-.5   ,1+2*i),
c(.4      ,.7      , .4        , .4),
col=cols[i+1])
text(2*i,0.5,niv[i+1],cex=1.5)
}
text(8,.5,1,cex=1.5)
text(4,0,'p-value',cex=2)
box()
residus <- arimaSelect.out[[3]][[choix]]$res
par(mar=c(1,2,4,1))
acf(residus,main='')
title('acf',line=.5)
par(mar=c(1,2,4,1))
pacf(residus,main='')
title('pacf',line=.5)
par(mar=c(2,2,4,1))
qqnorm(residus,main='')
title('qq-norm',line=.5)
qqline(residus)
residus
}
if (par2 == 0) x <- log(x)
if (par2 != 0) x <- x^par2
(selection <- arimaSelect(x, order=c(par6,par3,par7), seasonal=list(order=c(par8,par4,par9), period=par5)))
bitmap(file='test1.png')
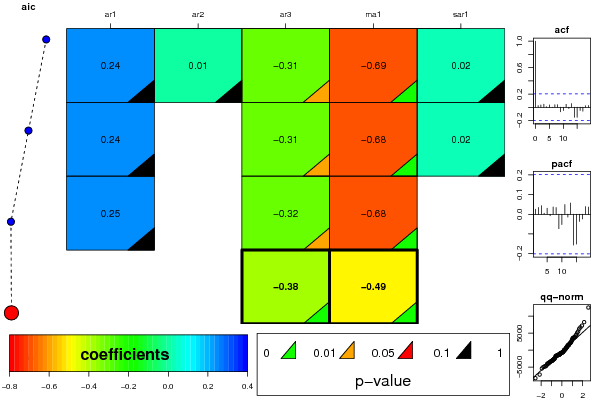
resid <- arimaSelectplot(selection)
dev.off()
resid
bitmap(file='test2.png')
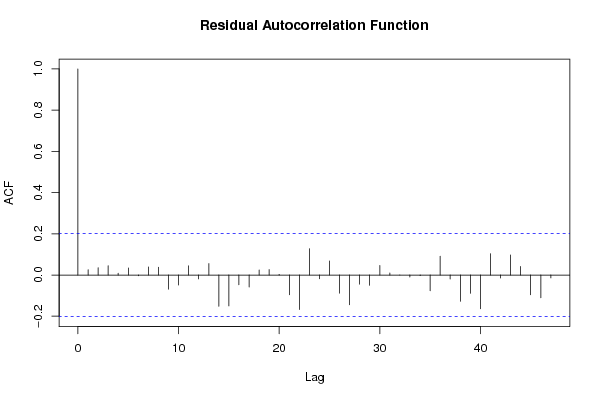
acf(resid,length(resid)/2, main='Residual Autocorrelation Function')
dev.off()
bitmap(file='test3.png')
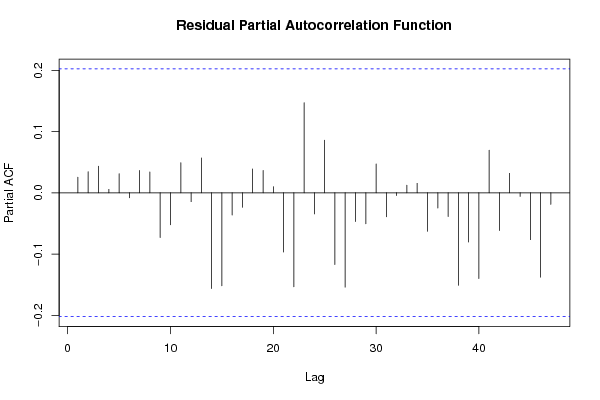
pacf(resid,length(resid)/2, main='Residual Partial Autocorrelation Function')
dev.off()
bitmap(file='test4.png')
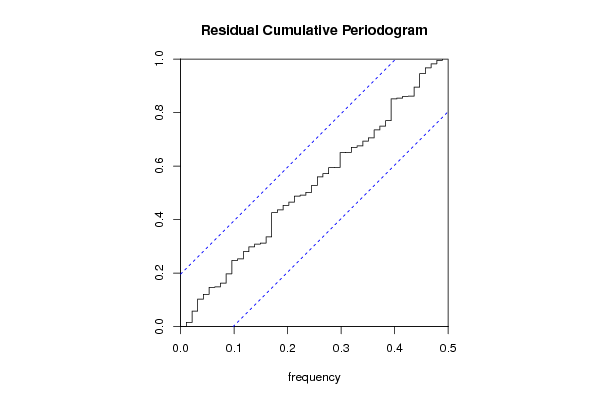
cpgram(resid, main='Residual Cumulative Periodogram')
dev.off()
bitmap(file='test5.png')
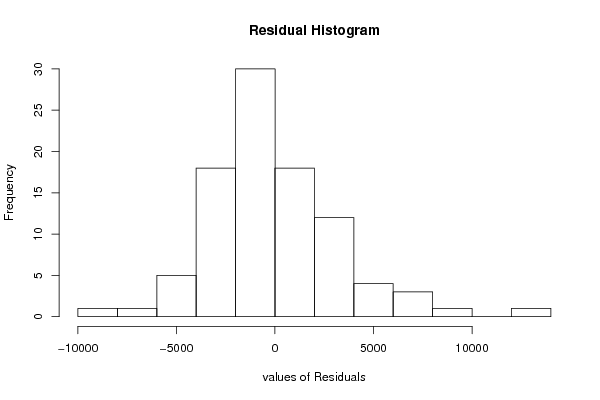
hist(resid, main='Residual Histogram', xlab='values of Residuals')
dev.off()
bitmap(file='test6.png')
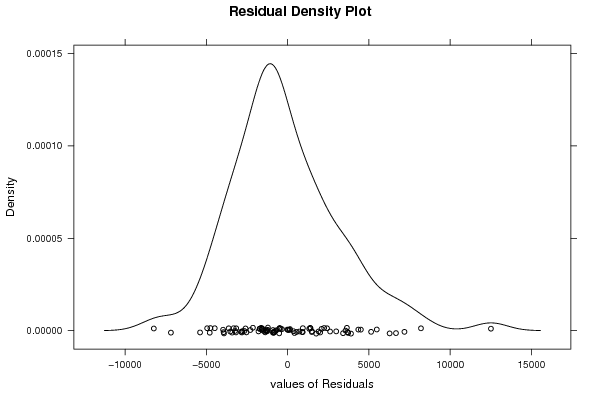
densityplot(~resid,col='black',main='Residual Density Plot', xlab='values of Residuals')
dev.off()
bitmap(file='test7.png')
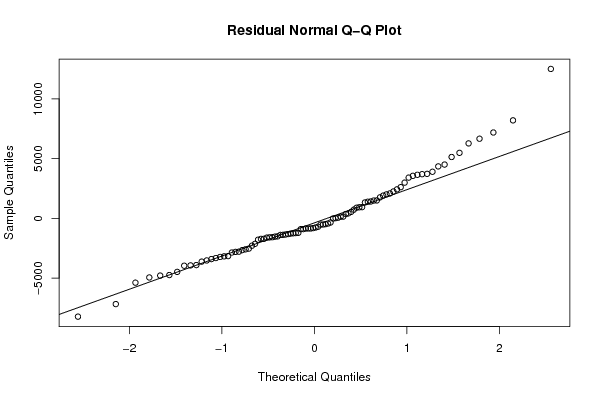
qqnorm(resid, main='Residual Normal Q-Q Plot')
qqline(resid)
dev.off()
ncols <- length(selection[[1]][1,])
nrows <- length(selection[[2]][,1])-1
load(file='createtable')
a<-table.start()
a<-table.row.start(a)
a<-table.element(a,'ARIMA Parameter Estimation and Backward Selection', ncols+1,TRUE)
a<-table.row.end(a)
a<-table.row.start(a)
a<-table.element(a,'Iteration', header=TRUE)
for (i in 1:ncols) {
a<-table.element(a,names(selection[[3]][[1]]$coef)[i],header=TRUE)
}
a<-table.row.end(a)
for (j in 1:nrows) {
a<-table.row.start(a)
mydum <- 'Estimates ('
mydum <- paste(mydum,j)
mydum <- paste(mydum,')')
a<-table.element(a,mydum, header=TRUE)
for (i in 1:ncols) {
a<-table.element(a,round(selection[[1]][j,i],4))
}
a<-table.row.end(a)
a<-table.row.start(a)
a<-table.element(a,'(p-val)', header=TRUE)
for (i in 1:ncols) {
mydum <- '('
mydum <- paste(mydum,round(selection[[2]][j,i],4),sep='')
mydum <- paste(mydum,')')
a<-table.element(a,mydum)
}
a<-table.row.end(a)
}
a<-table.end(a)
table.save(a,file='mytable.tab')
a <-table.start()
a <- table.row.start(a)
a <- table.element(a,'Menu of Residual Diagnostics',2,TRUE)
a <- table.row.end(a)
a <- table.row.start(a)
a <- table.element(a,'Description',1,TRUE)
a <- table.element(a,'Link',1,TRUE)
a <- table.row.end(a)
a <- table.row.start(a)
a <-table.element(a,'Histogram',1,header=TRUE)
a <- table.element(a,hyperlink( paste('https://supernova.wessa.net/rwasp_histogram.wasp?convertgetintopost=1&data=',paste(as.character(resid),sep='',collapse=' '),sep='') ,'Compute','Click here to examine the Residuals.'),1)
a <- table.row.end(a)
a <- table.row.start(a)
a <-table.element(a,'Central Tendency',1,header=TRUE)
a <- table.element(a,hyperlink( paste('https://supernova.wessa.net/rwasp_centraltendency.wasp?convertgetintopost=1&data=',paste(as.character(resid),sep='',collapse=' '),sep='') ,'Compute','Click here to examine the Residuals.'),1)
a <- table.row.end(a)
a <- table.row.start(a)
a <-table.element(a,'QQ Plot',1,header=TRUE)
a <- table.element(a,hyperlink( paste('https://supernova.wessa.net/rwasp_fitdistrnorm.wasp?convertgetintopost=1&data=',paste(as.character(resid),sep='',collapse=' '),sep='') ,'Compute','Click here to examine the Residuals.'),1)
a <- table.row.end(a)
a <- table.row.start(a)
a <-table.element(a,'Kernel Density Plot',1,header=TRUE)
a <- table.element(a,hyperlink( paste('https://supernova.wessa.net/rwasp_density.wasp?convertgetintopost=1&data=',paste(as.character(resid),sep='',collapse=' '),sep='') ,'Compute','Click here to examine the Residuals.'),1)
a <- table.row.end(a)
a <- table.row.start(a)
a <-table.element(a,'Skewness/Kurtosis Test',1,header=TRUE)
a <- table.element(a,hyperlink( paste('https://supernova.wessa.net/rwasp_skewness_kurtosis.wasp?convertgetintopost=1&data=',paste(as.character(resid),sep='',collapse=' '),sep='') ,'Compute','Click here to examine the Residuals.'),1)
a <- table.row.end(a)
a <- table.row.start(a)
a <-table.element(a,'Skewness-Kurtosis Plot',1,header=TRUE)
a <- table.element(a,hyperlink( paste('https://supernova.wessa.net/rwasp_skewness_kurtosis_plot.wasp?convertgetintopost=1&data=',paste(as.character(resid),sep='',collapse=' '),sep='') ,'Compute','Click here to examine the Residuals.'),1)
a <- table.row.end(a)
a <- table.row.start(a)
a <-table.element(a,'Harrell-Davis Plot',1,header=TRUE)
a <- table.element(a,hyperlink( paste('https://supernova.wessa.net/rwasp_harrell_davis.wasp?convertgetintopost=1&data=',paste(as.character(resid),sep='',collapse=' '),sep='') ,'Compute','Click here to examine the Residuals.'),1)
a <- table.row.end(a)
a <- table.row.start(a)
a <-table.element(a,'Bootstrap Plot -- Central Tendency',1,header=TRUE)
a <- table.element(a,hyperlink( paste('https://supernova.wessa.net/rwasp_bootstrapplot1.wasp?convertgetintopost=1&data=',paste(as.character(resid),sep='',collapse=' '),sep='') ,'Compute','Click here to examine the Residuals.'),1)
a <- table.row.end(a)
a <- table.row.start(a)
a <-table.element(a,'Blocked Bootstrap Plot -- Central Tendency',1,header=TRUE)
a <- table.element(a,hyperlink( paste('https://supernova.wessa.net/rwasp_bootstrapplot.wasp?convertgetintopost=1&data=',paste(as.character(resid),sep='',collapse=' '),sep='') ,'Compute','Click here to examine the Residuals.'),1)
a <- table.row.end(a)
a <- table.row.start(a)
a <-table.element(a,'(Partial) Autocorrelation Plot',1,header=TRUE)
a <- table.element(a,hyperlink( paste('https://supernova.wessa.net/rwasp_autocorrelation.wasp?convertgetintopost=1&data=',paste(as.character(resid),sep='',collapse=' '),sep='') ,'Compute','Click here to examine the Residuals.'),1)
a <- table.row.end(a)
a <- table.row.start(a)
a <-table.element(a,'Spectral Analysis',1,header=TRUE)
a <- table.element(a,hyperlink( paste('https://supernova.wessa.net/rwasp_spectrum.wasp?convertgetintopost=1&data=',paste(as.character(resid),sep='',collapse=' '),sep='') ,'Compute','Click here to examine the Residuals.'),1)
a <- table.row.end(a)
a <- table.row.start(a)
a <-table.element(a,'Tukey lambda PPCC Plot',1,header=TRUE)
a <- table.element(a,hyperlink( paste('https://supernova.wessa.net/rwasp_tukeylambda.wasp?convertgetintopost=1&data=',paste(as.character(resid),sep='',collapse=' '),sep='') ,'Compute','Click here to examine the Residuals.'),1)
a <- table.row.end(a)
a <- table.row.start(a)
a <-table.element(a,'Box-Cox Normality Plot',1,header=TRUE)
a <- table.element(a,hyperlink( paste('https://supernova.wessa.net/rwasp_boxcoxnorm.wasp?convertgetintopost=1&data=',paste(as.character(resid),sep='',collapse=' '),sep='') ,'Compute','Click here to examine the Residuals.'),1)
a <- table.row.end(a)
a <- table.row.start(a)
a <- table.element(a,'Summary Statistics',1,header=TRUE)
a <- table.element(a,hyperlink( paste('https://supernova.wessa.net/rwasp_summary1.wasp?convertgetintopost=1&data=',paste(as.character(resid),sep='',collapse=' '),sep='') ,'Compute','Click here to examine the Residuals.'),1)
a <- table.row.end(a)
a<-table.end(a)
table.save(a,file='mytable7.tab')
|
