Free Statistics

of Irreproducible Research!

Author's title

Author*The author of this computation has been verified*
R Software Modulerwasp_autocorrelation.wasp
Title produced by software(Partial) Autocorrelation Function
Date of computationThu, 14 Dec 2017 11:14:06 +0100
Cite this page as followsStatistical Computations at FreeStatistics.org, Office for Research Development and Education, URL https://freestatistics.org/blog/index.php?v=date/2017/Dec/14/t1513246481i1jqttvxeqcfr65.htm/, Retrieved Mon, 13 May 2024 21:44:27 +0000
Statistical Computations at FreeStatistics.org, Office for Research Development and Education, URL https://freestatistics.org/blog/index.php?pk=309438, Retrieved Mon, 13 May 2024 21:44:27 +0000
QR Codes:

Original text written by user:
IsPrivate?No (this computation is public)
User-defined keywords
Estimated Impact87
Family? (F = Feedback message, R = changed R code, M = changed R Module, P = changed Parameters, D = changed Data)
-       [(Partial) Autocorrelation Function] [D=1] [2017-12-14 10:14:06] [c5fee8264c7526f17d5d55b94ea27fcf] [Current]
Feedback Forum

Post a new message
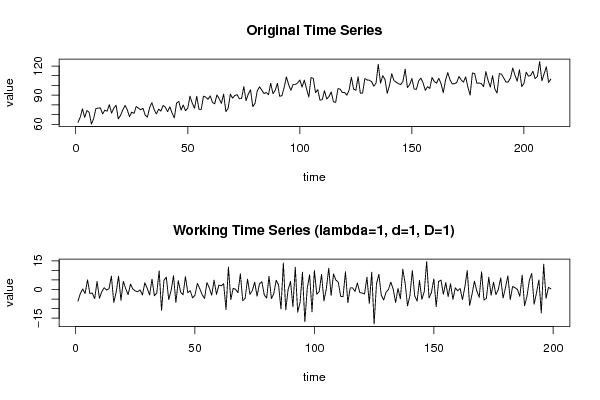
Dataseries X:
62
67.1
75.9
67
74.2
72.2
60.2
65.8
76.2
76.6
76.8
70.6
74.5
73.5
80.2
71.5
76.6
79.6
65.5
69.2
74.8
79.4
75
67.7
72.5
71.2
78.3
76.6
74.9
76.5
69.4
67.4
77.2
82.2
75.1
70.6
75.6
73.5
79.4
77.5
72.9
78
71.5
66.6
81.8
83.5
74.6
79.8
73.9
76.6
88.9
81.7
76.5
88.8
75.5
75.2
89
87.9
85.7
89.2
82.7
81
90.3
86.3
81.5
91.1
73.1
76.4
91
86.9
89.6
90.5
86.3
86.5
98.8
84.3
91.2
95.5
78.1
81.5
94.4
98.5
95.3
91.6
92.8
90.5
102.2
91.5
94.9
102.1
88.8
89.4
97.8
108.8
100.8
95
101
101
102.5
105.6
98.3
105.5
96.4
88
108.1
107.2
92.5
95.7
84.8
85.4
94.6
86
88.6
93.3
83.1
82.6
96.7
96.2
92.6
92.7
89.9
95.4
108.4
96.2
95
109
91.9
92.2
107.1
105.6
105.4
103.9
99.2
102.4
121.8
102.3
110.1
106
91.9
100.1
112
105
103.3
101.8
100.9
104.2
116.8
97.8
100.7
107.2
96.3
95.9
104.6
107.5
102.5
94.9
98.7
96.8
108.3
103.9
102.4
107.3
101.9
92.5
105.4
113.2
105.7
101.7
101.8
102.9
109.2
105.6
103.4
108.8
98.1
90
112.8
112.2
102.2
102.5
101.8
98.8
114.3
105.2
98.3
110.1
96.4
92.1
112.2
111.6
107.6
103.4
103.6
107.7
117.9
110.4
104.4
116.2
98.9
102.1
113.7
109.5
110.3
114.5
107
109.4
124.6
104.8
112
119.2
103
106.5


Summary of computational transaction
Raw Input view raw input (R code)
Raw Outputview raw output of R engine
Computing time2 seconds
R ServerBig Analytics Cloud Computing Center

\begin{tabular}{lllllllll}
\hline
Summary of computational transaction \tabularnewline
Raw Input view raw input (R code)  \tabularnewline
Raw Outputview raw output of R engine  \tabularnewline
Computing time2 seconds \tabularnewline
R ServerBig Analytics Cloud Computing Center \tabularnewline
\hline
\end{tabular}
%Source: https://freestatistics.org/blog/index.php?pk=309438&T=0

[TABLE]
[ROW]
Summary of computational transaction[/C][/ROW] [ROW]Raw Input[/C] view raw input (R code) [/C][/ROW] [ROW]Raw Output[/C]view raw output of R engine [/C][/ROW] [ROW]Computing time[/C]2 seconds[/C][/ROW] [ROW]R Server[/C]Big Analytics Cloud Computing Center[/C][/ROW] [/TABLE] Source: https://freestatistics.org/blog/index.php?pk=309438&T=0

Globally Unique Identifier (entire table): ba.freestatistics.org/blog/index.php?pk=309438&T=0

As an alternative you can also use a QR Code:  

The GUIDs for individual cells are displayed in the table below:

Summary of computational transaction
Raw Input view raw input (R code)
Raw Outputview raw output of R engine
Computing time2 seconds
R ServerBig Analytics Cloud Computing Center


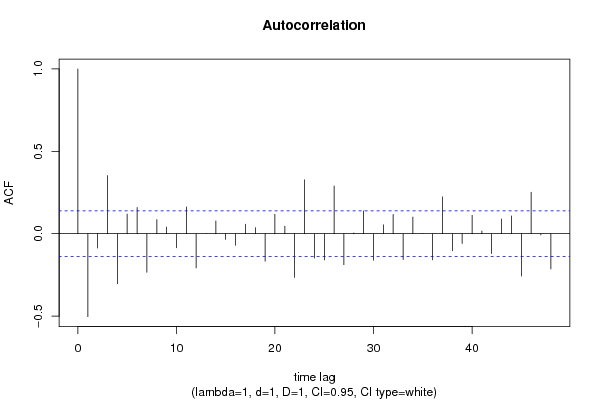
Autocorrelation Function
Time lag kACF(k)T-STATP-value
1-0.50316-7.09790
2-0.086455-1.21960.112031
30.3529074.97841e-06
4-0.303504-4.28141.4e-05
50.1191111.68030.047237
60.1594362.24910.0128
7-0.234065-3.30190.000569
80.0858471.2110.113663
90.0400910.56560.286166
10-0.084824-1.19660.116446
110.1624972.29230.011467
12-0.207184-2.92270.001936
130.0006850.00970.496148
140.0774421.09250.137978
15-0.034238-0.4830.314818
16-0.069963-0.9870.162432
170.0579570.81760.207285
180.0369040.52060.301616
19-0.166359-2.34680.009959
200.1176451.65960.049286
210.0457290.64510.259808
22-0.264792-3.73530.000122
230.327124.61464e-06
24-0.147763-2.08440.019198
25-0.158735-2.23920.013124
260.2902164.0943.1e-05
27-0.187738-2.64840.004368
280.0040590.05730.477195
290.1377371.9430.026712
30-0.160283-2.26110.012418
310.0538330.75940.224254
320.1171561.65270.049986
33-0.155892-2.19910.01451
340.1007351.4210.078434
350.0001160.00160.499347
36-0.15809-2.23010.013428
370.2238633.1580.000918
38-0.102905-1.45170.074086
39-0.058443-0.82440.205338
400.1115421.57350.058596
410.0170430.24040.405127
42-0.120019-1.69310.046002
430.0894241.26150.104307
440.1073871.51490.065696
45-0.256072-3.61230.000192
460.2519353.5540.000237
47-0.00796-0.11230.455355
48-0.213504-3.01180.001467

\begin{tabular}{lllllllll}
\hline
Autocorrelation Function \tabularnewline
Time lag k & ACF(k) & T-STAT & P-value \tabularnewline
1 & -0.50316 & -7.0979 & 0 \tabularnewline
2 & -0.086455 & -1.2196 & 0.112031 \tabularnewline
3 & 0.352907 & 4.9784 & 1e-06 \tabularnewline
4 & -0.303504 & -4.2814 & 1.4e-05 \tabularnewline
5 & 0.119111 & 1.6803 & 0.047237 \tabularnewline
6 & 0.159436 & 2.2491 & 0.0128 \tabularnewline
7 & -0.234065 & -3.3019 & 0.000569 \tabularnewline
8 & 0.085847 & 1.211 & 0.113663 \tabularnewline
9 & 0.040091 & 0.5656 & 0.286166 \tabularnewline
10 & -0.084824 & -1.1966 & 0.116446 \tabularnewline
11 & 0.162497 & 2.2923 & 0.011467 \tabularnewline
12 & -0.207184 & -2.9227 & 0.001936 \tabularnewline
13 & 0.000685 & 0.0097 & 0.496148 \tabularnewline
14 & 0.077442 & 1.0925 & 0.137978 \tabularnewline
15 & -0.034238 & -0.483 & 0.314818 \tabularnewline
16 & -0.069963 & -0.987 & 0.162432 \tabularnewline
17 & 0.057957 & 0.8176 & 0.207285 \tabularnewline
18 & 0.036904 & 0.5206 & 0.301616 \tabularnewline
19 & -0.166359 & -2.3468 & 0.009959 \tabularnewline
20 & 0.117645 & 1.6596 & 0.049286 \tabularnewline
21 & 0.045729 & 0.6451 & 0.259808 \tabularnewline
22 & -0.264792 & -3.7353 & 0.000122 \tabularnewline
23 & 0.32712 & 4.6146 & 4e-06 \tabularnewline
24 & -0.147763 & -2.0844 & 0.019198 \tabularnewline
25 & -0.158735 & -2.2392 & 0.013124 \tabularnewline
26 & 0.290216 & 4.094 & 3.1e-05 \tabularnewline
27 & -0.187738 & -2.6484 & 0.004368 \tabularnewline
28 & 0.004059 & 0.0573 & 0.477195 \tabularnewline
29 & 0.137737 & 1.943 & 0.026712 \tabularnewline
30 & -0.160283 & -2.2611 & 0.012418 \tabularnewline
31 & 0.053833 & 0.7594 & 0.224254 \tabularnewline
32 & 0.117156 & 1.6527 & 0.049986 \tabularnewline
33 & -0.155892 & -2.1991 & 0.01451 \tabularnewline
34 & 0.100735 & 1.421 & 0.078434 \tabularnewline
35 & 0.000116 & 0.0016 & 0.499347 \tabularnewline
36 & -0.15809 & -2.2301 & 0.013428 \tabularnewline
37 & 0.223863 & 3.158 & 0.000918 \tabularnewline
38 & -0.102905 & -1.4517 & 0.074086 \tabularnewline
39 & -0.058443 & -0.8244 & 0.205338 \tabularnewline
40 & 0.111542 & 1.5735 & 0.058596 \tabularnewline
41 & 0.017043 & 0.2404 & 0.405127 \tabularnewline
42 & -0.120019 & -1.6931 & 0.046002 \tabularnewline
43 & 0.089424 & 1.2615 & 0.104307 \tabularnewline
44 & 0.107387 & 1.5149 & 0.065696 \tabularnewline
45 & -0.256072 & -3.6123 & 0.000192 \tabularnewline
46 & 0.251935 & 3.554 & 0.000237 \tabularnewline
47 & -0.00796 & -0.1123 & 0.455355 \tabularnewline
48 & -0.213504 & -3.0118 & 0.001467 \tabularnewline
\hline
\end{tabular}
%Source: https://freestatistics.org/blog/index.php?pk=309438&T=1

[TABLE]
[ROW][C]Autocorrelation Function[/C][/ROW]
[ROW][C]Time lag k[/C][C]ACF(k)[/C][C]T-STAT[/C][C]P-value[/C][/ROW]
[ROW][C]1[/C][C]-0.50316[/C][C]-7.0979[/C][C]0[/C][/ROW]
[ROW][C]2[/C][C]-0.086455[/C][C]-1.2196[/C][C]0.112031[/C][/ROW]
[ROW][C]3[/C][C]0.352907[/C][C]4.9784[/C][C]1e-06[/C][/ROW]
[ROW][C]4[/C][C]-0.303504[/C][C]-4.2814[/C][C]1.4e-05[/C][/ROW]
[ROW][C]5[/C][C]0.119111[/C][C]1.6803[/C][C]0.047237[/C][/ROW]
[ROW][C]6[/C][C]0.159436[/C][C]2.2491[/C][C]0.0128[/C][/ROW]
[ROW][C]7[/C][C]-0.234065[/C][C]-3.3019[/C][C]0.000569[/C][/ROW]
[ROW][C]8[/C][C]0.085847[/C][C]1.211[/C][C]0.113663[/C][/ROW]
[ROW][C]9[/C][C]0.040091[/C][C]0.5656[/C][C]0.286166[/C][/ROW]
[ROW][C]10[/C][C]-0.084824[/C][C]-1.1966[/C][C]0.116446[/C][/ROW]
[ROW][C]11[/C][C]0.162497[/C][C]2.2923[/C][C]0.011467[/C][/ROW]
[ROW][C]12[/C][C]-0.207184[/C][C]-2.9227[/C][C]0.001936[/C][/ROW]
[ROW][C]13[/C][C]0.000685[/C][C]0.0097[/C][C]0.496148[/C][/ROW]
[ROW][C]14[/C][C]0.077442[/C][C]1.0925[/C][C]0.137978[/C][/ROW]
[ROW][C]15[/C][C]-0.034238[/C][C]-0.483[/C][C]0.314818[/C][/ROW]
[ROW][C]16[/C][C]-0.069963[/C][C]-0.987[/C][C]0.162432[/C][/ROW]
[ROW][C]17[/C][C]0.057957[/C][C]0.8176[/C][C]0.207285[/C][/ROW]
[ROW][C]18[/C][C]0.036904[/C][C]0.5206[/C][C]0.301616[/C][/ROW]
[ROW][C]19[/C][C]-0.166359[/C][C]-2.3468[/C][C]0.009959[/C][/ROW]
[ROW][C]20[/C][C]0.117645[/C][C]1.6596[/C][C]0.049286[/C][/ROW]
[ROW][C]21[/C][C]0.045729[/C][C]0.6451[/C][C]0.259808[/C][/ROW]
[ROW][C]22[/C][C]-0.264792[/C][C]-3.7353[/C][C]0.000122[/C][/ROW]
[ROW][C]23[/C][C]0.32712[/C][C]4.6146[/C][C]4e-06[/C][/ROW]
[ROW][C]24[/C][C]-0.147763[/C][C]-2.0844[/C][C]0.019198[/C][/ROW]
[ROW][C]25[/C][C]-0.158735[/C][C]-2.2392[/C][C]0.013124[/C][/ROW]
[ROW][C]26[/C][C]0.290216[/C][C]4.094[/C][C]3.1e-05[/C][/ROW]
[ROW][C]27[/C][C]-0.187738[/C][C]-2.6484[/C][C]0.004368[/C][/ROW]
[ROW][C]28[/C][C]0.004059[/C][C]0.0573[/C][C]0.477195[/C][/ROW]
[ROW][C]29[/C][C]0.137737[/C][C]1.943[/C][C]0.026712[/C][/ROW]
[ROW][C]30[/C][C]-0.160283[/C][C]-2.2611[/C][C]0.012418[/C][/ROW]
[ROW][C]31[/C][C]0.053833[/C][C]0.7594[/C][C]0.224254[/C][/ROW]
[ROW][C]32[/C][C]0.117156[/C][C]1.6527[/C][C]0.049986[/C][/ROW]
[ROW][C]33[/C][C]-0.155892[/C][C]-2.1991[/C][C]0.01451[/C][/ROW]
[ROW][C]34[/C][C]0.100735[/C][C]1.421[/C][C]0.078434[/C][/ROW]
[ROW][C]35[/C][C]0.000116[/C][C]0.0016[/C][C]0.499347[/C][/ROW]
[ROW][C]36[/C][C]-0.15809[/C][C]-2.2301[/C][C]0.013428[/C][/ROW]
[ROW][C]37[/C][C]0.223863[/C][C]3.158[/C][C]0.000918[/C][/ROW]
[ROW][C]38[/C][C]-0.102905[/C][C]-1.4517[/C][C]0.074086[/C][/ROW]
[ROW][C]39[/C][C]-0.058443[/C][C]-0.8244[/C][C]0.205338[/C][/ROW]
[ROW][C]40[/C][C]0.111542[/C][C]1.5735[/C][C]0.058596[/C][/ROW]
[ROW][C]41[/C][C]0.017043[/C][C]0.2404[/C][C]0.405127[/C][/ROW]
[ROW][C]42[/C][C]-0.120019[/C][C]-1.6931[/C][C]0.046002[/C][/ROW]
[ROW][C]43[/C][C]0.089424[/C][C]1.2615[/C][C]0.104307[/C][/ROW]
[ROW][C]44[/C][C]0.107387[/C][C]1.5149[/C][C]0.065696[/C][/ROW]
[ROW][C]45[/C][C]-0.256072[/C][C]-3.6123[/C][C]0.000192[/C][/ROW]
[ROW][C]46[/C][C]0.251935[/C][C]3.554[/C][C]0.000237[/C][/ROW]
[ROW][C]47[/C][C]-0.00796[/C][C]-0.1123[/C][C]0.455355[/C][/ROW]
[ROW][C]48[/C][C]-0.213504[/C][C]-3.0118[/C][C]0.001467[/C][/ROW]
[/TABLE]
Source: https://freestatistics.org/blog/index.php?pk=309438&T=1

Globally Unique Identifier (entire table): ba.freestatistics.org/blog/index.php?pk=309438&T=1

As an alternative you can also use a QR Code:  

The GUIDs for individual cells are displayed in the table below:

Autocorrelation Function
Time lag kACF(k)T-STATP-value
1-0.50316-7.09790
2-0.086455-1.21960.112031
30.3529074.97841e-06
4-0.303504-4.28141.4e-05
50.1191111.68030.047237
60.1594362.24910.0128
7-0.234065-3.30190.000569
80.0858471.2110.113663
90.0400910.56560.286166
10-0.084824-1.19660.116446
110.1624972.29230.011467
12-0.207184-2.92270.001936
130.0006850.00970.496148
140.0774421.09250.137978
15-0.034238-0.4830.314818
16-0.069963-0.9870.162432
170.0579570.81760.207285
180.0369040.52060.301616
19-0.166359-2.34680.009959
200.1176451.65960.049286
210.0457290.64510.259808
22-0.264792-3.73530.000122
230.327124.61464e-06
24-0.147763-2.08440.019198
25-0.158735-2.23920.013124
260.2902164.0943.1e-05
27-0.187738-2.64840.004368
280.0040590.05730.477195
290.1377371.9430.026712
30-0.160283-2.26110.012418
310.0538330.75940.224254
320.1171561.65270.049986
33-0.155892-2.19910.01451
340.1007351.4210.078434
350.0001160.00160.499347
36-0.15809-2.23010.013428
370.2238633.1580.000918
38-0.102905-1.45170.074086
39-0.058443-0.82440.205338
400.1115421.57350.058596
410.0170430.24040.405127
42-0.120019-1.69310.046002
430.0894241.26150.104307
440.1073871.51490.065696
45-0.256072-3.61230.000192
460.2519353.5540.000237
47-0.00796-0.11230.455355
48-0.213504-3.01180.001467


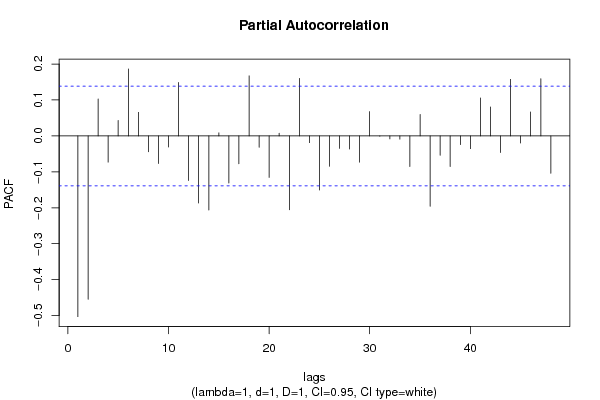
Partial Autocorrelation Function
Time lag kPACF(k)T-STATP-value
1-0.50316-7.09790
2-0.454755-6.41510
30.1026541.44810.074581
4-0.073067-1.03070.151957
50.0427740.60340.273463
60.1864222.62980.004606
70.0655960.92530.177955
8-0.044138-0.62260.267115
9-0.076666-1.08150.14039
10-0.031013-0.43750.331117
110.1485132.0950.018717
12-0.124261-1.75290.040579
13-0.186802-2.63520.004536
14-0.206226-2.90920.002018
150.0085710.12090.451942
16-0.131074-1.8490.032969
17-0.077391-1.09170.138135
180.1671382.35780.009678
19-0.03138-0.44270.329244
20-0.115518-1.62960.052386
210.0072920.10290.459086
22-0.205396-2.89750.002092
230.1601072.25860.012497
24-0.018735-0.26430.395915
25-0.150649-2.12520.017403
26-0.084328-1.18960.117813
27-0.034666-0.4890.312681
28-0.036244-0.51130.30486
29-0.072993-1.02970.152201
300.0676730.95460.170459
31-0.000635-0.0090.496431
32-0.008307-0.11720.453417
33-0.008906-0.12560.450076
34-0.085149-1.20120.115557
350.0598230.84390.199868
36-0.19591-2.76370.003126
37-0.053766-0.75850.224535
38-0.085328-1.20370.115067
39-0.024195-0.34130.366617
40-0.035509-0.50090.308494
410.1053431.4860.069425
420.0806221.13730.128388
43-0.046441-0.65510.256571
440.15742.22040.01376
45-0.019729-0.27830.390532
460.0666290.93990.174199
470.1591332.24490.012939
48-0.103966-1.46660.07203

\begin{tabular}{lllllllll}
\hline
Partial Autocorrelation Function \tabularnewline
Time lag k & PACF(k) & T-STAT & P-value \tabularnewline
1 & -0.50316 & -7.0979 & 0 \tabularnewline
2 & -0.454755 & -6.4151 & 0 \tabularnewline
3 & 0.102654 & 1.4481 & 0.074581 \tabularnewline
4 & -0.073067 & -1.0307 & 0.151957 \tabularnewline
5 & 0.042774 & 0.6034 & 0.273463 \tabularnewline
6 & 0.186422 & 2.6298 & 0.004606 \tabularnewline
7 & 0.065596 & 0.9253 & 0.177955 \tabularnewline
8 & -0.044138 & -0.6226 & 0.267115 \tabularnewline
9 & -0.076666 & -1.0815 & 0.14039 \tabularnewline
10 & -0.031013 & -0.4375 & 0.331117 \tabularnewline
11 & 0.148513 & 2.095 & 0.018717 \tabularnewline
12 & -0.124261 & -1.7529 & 0.040579 \tabularnewline
13 & -0.186802 & -2.6352 & 0.004536 \tabularnewline
14 & -0.206226 & -2.9092 & 0.002018 \tabularnewline
15 & 0.008571 & 0.1209 & 0.451942 \tabularnewline
16 & -0.131074 & -1.849 & 0.032969 \tabularnewline
17 & -0.077391 & -1.0917 & 0.138135 \tabularnewline
18 & 0.167138 & 2.3578 & 0.009678 \tabularnewline
19 & -0.03138 & -0.4427 & 0.329244 \tabularnewline
20 & -0.115518 & -1.6296 & 0.052386 \tabularnewline
21 & 0.007292 & 0.1029 & 0.459086 \tabularnewline
22 & -0.205396 & -2.8975 & 0.002092 \tabularnewline
23 & 0.160107 & 2.2586 & 0.012497 \tabularnewline
24 & -0.018735 & -0.2643 & 0.395915 \tabularnewline
25 & -0.150649 & -2.1252 & 0.017403 \tabularnewline
26 & -0.084328 & -1.1896 & 0.117813 \tabularnewline
27 & -0.034666 & -0.489 & 0.312681 \tabularnewline
28 & -0.036244 & -0.5113 & 0.30486 \tabularnewline
29 & -0.072993 & -1.0297 & 0.152201 \tabularnewline
30 & 0.067673 & 0.9546 & 0.170459 \tabularnewline
31 & -0.000635 & -0.009 & 0.496431 \tabularnewline
32 & -0.008307 & -0.1172 & 0.453417 \tabularnewline
33 & -0.008906 & -0.1256 & 0.450076 \tabularnewline
34 & -0.085149 & -1.2012 & 0.115557 \tabularnewline
35 & 0.059823 & 0.8439 & 0.199868 \tabularnewline
36 & -0.19591 & -2.7637 & 0.003126 \tabularnewline
37 & -0.053766 & -0.7585 & 0.224535 \tabularnewline
38 & -0.085328 & -1.2037 & 0.115067 \tabularnewline
39 & -0.024195 & -0.3413 & 0.366617 \tabularnewline
40 & -0.035509 & -0.5009 & 0.308494 \tabularnewline
41 & 0.105343 & 1.486 & 0.069425 \tabularnewline
42 & 0.080622 & 1.1373 & 0.128388 \tabularnewline
43 & -0.046441 & -0.6551 & 0.256571 \tabularnewline
44 & 0.1574 & 2.2204 & 0.01376 \tabularnewline
45 & -0.019729 & -0.2783 & 0.390532 \tabularnewline
46 & 0.066629 & 0.9399 & 0.174199 \tabularnewline
47 & 0.159133 & 2.2449 & 0.012939 \tabularnewline
48 & -0.103966 & -1.4666 & 0.07203 \tabularnewline
\hline
\end{tabular}
%Source: https://freestatistics.org/blog/index.php?pk=309438&T=2

[TABLE]
[ROW][C]Partial Autocorrelation Function[/C][/ROW]
[ROW][C]Time lag k[/C][C]PACF(k)[/C][C]T-STAT[/C][C]P-value[/C][/ROW]
[ROW][C]1[/C][C]-0.50316[/C][C]-7.0979[/C][C]0[/C][/ROW]
[ROW][C]2[/C][C]-0.454755[/C][C]-6.4151[/C][C]0[/C][/ROW]
[ROW][C]3[/C][C]0.102654[/C][C]1.4481[/C][C]0.074581[/C][/ROW]
[ROW][C]4[/C][C]-0.073067[/C][C]-1.0307[/C][C]0.151957[/C][/ROW]
[ROW][C]5[/C][C]0.042774[/C][C]0.6034[/C][C]0.273463[/C][/ROW]
[ROW][C]6[/C][C]0.186422[/C][C]2.6298[/C][C]0.004606[/C][/ROW]
[ROW][C]7[/C][C]0.065596[/C][C]0.9253[/C][C]0.177955[/C][/ROW]
[ROW][C]8[/C][C]-0.044138[/C][C]-0.6226[/C][C]0.267115[/C][/ROW]
[ROW][C]9[/C][C]-0.076666[/C][C]-1.0815[/C][C]0.14039[/C][/ROW]
[ROW][C]10[/C][C]-0.031013[/C][C]-0.4375[/C][C]0.331117[/C][/ROW]
[ROW][C]11[/C][C]0.148513[/C][C]2.095[/C][C]0.018717[/C][/ROW]
[ROW][C]12[/C][C]-0.124261[/C][C]-1.7529[/C][C]0.040579[/C][/ROW]
[ROW][C]13[/C][C]-0.186802[/C][C]-2.6352[/C][C]0.004536[/C][/ROW]
[ROW][C]14[/C][C]-0.206226[/C][C]-2.9092[/C][C]0.002018[/C][/ROW]
[ROW][C]15[/C][C]0.008571[/C][C]0.1209[/C][C]0.451942[/C][/ROW]
[ROW][C]16[/C][C]-0.131074[/C][C]-1.849[/C][C]0.032969[/C][/ROW]
[ROW][C]17[/C][C]-0.077391[/C][C]-1.0917[/C][C]0.138135[/C][/ROW]
[ROW][C]18[/C][C]0.167138[/C][C]2.3578[/C][C]0.009678[/C][/ROW]
[ROW][C]19[/C][C]-0.03138[/C][C]-0.4427[/C][C]0.329244[/C][/ROW]
[ROW][C]20[/C][C]-0.115518[/C][C]-1.6296[/C][C]0.052386[/C][/ROW]
[ROW][C]21[/C][C]0.007292[/C][C]0.1029[/C][C]0.459086[/C][/ROW]
[ROW][C]22[/C][C]-0.205396[/C][C]-2.8975[/C][C]0.002092[/C][/ROW]
[ROW][C]23[/C][C]0.160107[/C][C]2.2586[/C][C]0.012497[/C][/ROW]
[ROW][C]24[/C][C]-0.018735[/C][C]-0.2643[/C][C]0.395915[/C][/ROW]
[ROW][C]25[/C][C]-0.150649[/C][C]-2.1252[/C][C]0.017403[/C][/ROW]
[ROW][C]26[/C][C]-0.084328[/C][C]-1.1896[/C][C]0.117813[/C][/ROW]
[ROW][C]27[/C][C]-0.034666[/C][C]-0.489[/C][C]0.312681[/C][/ROW]
[ROW][C]28[/C][C]-0.036244[/C][C]-0.5113[/C][C]0.30486[/C][/ROW]
[ROW][C]29[/C][C]-0.072993[/C][C]-1.0297[/C][C]0.152201[/C][/ROW]
[ROW][C]30[/C][C]0.067673[/C][C]0.9546[/C][C]0.170459[/C][/ROW]
[ROW][C]31[/C][C]-0.000635[/C][C]-0.009[/C][C]0.496431[/C][/ROW]
[ROW][C]32[/C][C]-0.008307[/C][C]-0.1172[/C][C]0.453417[/C][/ROW]
[ROW][C]33[/C][C]-0.008906[/C][C]-0.1256[/C][C]0.450076[/C][/ROW]
[ROW][C]34[/C][C]-0.085149[/C][C]-1.2012[/C][C]0.115557[/C][/ROW]
[ROW][C]35[/C][C]0.059823[/C][C]0.8439[/C][C]0.199868[/C][/ROW]
[ROW][C]36[/C][C]-0.19591[/C][C]-2.7637[/C][C]0.003126[/C][/ROW]
[ROW][C]37[/C][C]-0.053766[/C][C]-0.7585[/C][C]0.224535[/C][/ROW]
[ROW][C]38[/C][C]-0.085328[/C][C]-1.2037[/C][C]0.115067[/C][/ROW]
[ROW][C]39[/C][C]-0.024195[/C][C]-0.3413[/C][C]0.366617[/C][/ROW]
[ROW][C]40[/C][C]-0.035509[/C][C]-0.5009[/C][C]0.308494[/C][/ROW]
[ROW][C]41[/C][C]0.105343[/C][C]1.486[/C][C]0.069425[/C][/ROW]
[ROW][C]42[/C][C]0.080622[/C][C]1.1373[/C][C]0.128388[/C][/ROW]
[ROW][C]43[/C][C]-0.046441[/C][C]-0.6551[/C][C]0.256571[/C][/ROW]
[ROW][C]44[/C][C]0.1574[/C][C]2.2204[/C][C]0.01376[/C][/ROW]
[ROW][C]45[/C][C]-0.019729[/C][C]-0.2783[/C][C]0.390532[/C][/ROW]
[ROW][C]46[/C][C]0.066629[/C][C]0.9399[/C][C]0.174199[/C][/ROW]
[ROW][C]47[/C][C]0.159133[/C][C]2.2449[/C][C]0.012939[/C][/ROW]
[ROW][C]48[/C][C]-0.103966[/C][C]-1.4666[/C][C]0.07203[/C][/ROW]
[/TABLE]
Source: https://freestatistics.org/blog/index.php?pk=309438&T=2

Globally Unique Identifier (entire table): ba.freestatistics.org/blog/index.php?pk=309438&T=2

As an alternative you can also use a QR Code:  

The GUIDs for individual cells are displayed in the table below:

Partial Autocorrelation Function
Time lag kPACF(k)T-STATP-value
1-0.50316-7.09790
2-0.454755-6.41510
30.1026541.44810.074581
4-0.073067-1.03070.151957
50.0427740.60340.273463
60.1864222.62980.004606
70.0655960.92530.177955
8-0.044138-0.62260.267115
9-0.076666-1.08150.14039
10-0.031013-0.43750.331117
110.1485132.0950.018717
12-0.124261-1.75290.040579
13-0.186802-2.63520.004536
14-0.206226-2.90920.002018
150.0085710.12090.451942
16-0.131074-1.8490.032969
17-0.077391-1.09170.138135
180.1671382.35780.009678
19-0.03138-0.44270.329244
20-0.115518-1.62960.052386
210.0072920.10290.459086
22-0.205396-2.89750.002092
230.1601072.25860.012497
24-0.018735-0.26430.395915
25-0.150649-2.12520.017403
26-0.084328-1.18960.117813
27-0.034666-0.4890.312681
28-0.036244-0.51130.30486
29-0.072993-1.02970.152201
300.0676730.95460.170459
31-0.000635-0.0090.496431
32-0.008307-0.11720.453417
33-0.008906-0.12560.450076
34-0.085149-1.20120.115557
350.0598230.84390.199868
36-0.19591-2.76370.003126
37-0.053766-0.75850.224535
38-0.085328-1.20370.115067
39-0.024195-0.34130.366617
40-0.035509-0.50090.308494
410.1053431.4860.069425
420.0806221.13730.128388
43-0.046441-0.65510.256571
440.15742.22040.01376
45-0.019729-0.27830.390532
460.0666290.93990.174199
470.1591332.24490.012939
48-0.103966-1.46660.07203


Parameters (Session):
par1 = 48 ; par2 = 1 ; par3 = 1 ; par4 = 1 ; par5 = 12 ; par6 = White Noise ; par7 = 0.95 ;
Parameters (R input):
par1 = 48 ; par2 = 1 ; par3 = 1 ; par4 = 1 ; par5 = 12 ; par6 = White Noise ; par7 = 0.95 ; par8 = ;
R code (references can be found in the software module):
if (par1 == 'Default') {
par1 = 10*log10(length(x))
} else {
par1 <- as.numeric(par1)
}
par2 <- as.numeric(par2)
par3 <- as.numeric(par3)
par4 <- as.numeric(par4)
par5 <- as.numeric(par5)
if (par6 == 'White Noise') par6 <- 'white' else par6 <- 'ma'
par7 <- as.numeric(par7)
if (par8 != '') par8 <- as.numeric(par8)
x <- na.omit(x)
ox <- x
if (par8 == '') {
if (par2 == 0) {
x <- log(x)
} else {
x <- (x ^ par2 - 1) / par2
}
} else {
x <- log(x,base=par8)
}
if (par3 > 0) x <- diff(x,lag=1,difference=par3)
if (par4 > 0) x <- diff(x,lag=par5,difference=par4)
bitmap(file='picts.png')
op <- par(mfrow=c(2,1))
plot(ox,type='l',main='Original Time Series',xlab='time',ylab='value')
if (par8=='') {
mytitle <- paste('Working Time Series (lambda=',par2,', d=',par3,', D=',par4,')',sep='')
mysub <- paste('(lambda=',par2,', d=',par3,', D=',par4,', CI=', par7, ', CI type=',par6,')',sep='')
} else {
mytitle <- paste('Working Time Series (base=',par8,', d=',par3,', D=',par4,')',sep='')
mysub <- paste('(base=',par8,', d=',par3,', D=',par4,', CI=', par7, ', CI type=',par6,')',sep='')
}
plot(x,type='l', main=mytitle,xlab='time',ylab='value')
par(op)
dev.off()
bitmap(file='pic1.png')
racf <- acf(x, par1, main='Autocorrelation', xlab='time lag', ylab='ACF', ci.type=par6, ci=par7, sub=mysub)
dev.off()
bitmap(file='pic2.png')
rpacf <- pacf(x,par1,main='Partial Autocorrelation',xlab='lags',ylab='PACF',sub=mysub)
dev.off()
(myacf <- c(racf$acf))
(mypacf <- c(rpacf$acf))
lengthx <- length(x)
sqrtn <- sqrt(lengthx)
load(file='createtable')
a<-table.start()
a<-table.row.start(a)
a<-table.element(a,'Autocorrelation Function',4,TRUE)
a<-table.row.end(a)
a<-table.row.start(a)
a<-table.element(a,'Time lag k',header=TRUE)
a<-table.element(a,'ACF(k)',header=TRUE)
a<-table.element(a,'T-STAT',header=TRUE)
a<-table.element(a,'P-value',header=TRUE)
a<-table.row.end(a)
for (i in 2:(par1+1)) {
a<-table.row.start(a)
a<-table.element(a,i-1,header=TRUE)
a<-table.element(a,round(myacf[i],6))
mytstat <- myacf[i]*sqrtn
a<-table.element(a,round(mytstat,4))
a<-table.element(a,round(1-pt(abs(mytstat),lengthx),6))
a<-table.row.end(a)
}
a<-table.end(a)
table.save(a,file='mytable.tab')
a<-table.start()
a<-table.row.start(a)
a<-table.element(a,'Partial Autocorrelation Function',4,TRUE)
a<-table.row.end(a)
a<-table.row.start(a)
a<-table.element(a,'Time lag k',header=TRUE)
a<-table.element(a,'PACF(k)',header=TRUE)
a<-table.element(a,'T-STAT',header=TRUE)
a<-table.element(a,'P-value',header=TRUE)
a<-table.row.end(a)
for (i in 1:par1) {
a<-table.row.start(a)
a<-table.element(a,i,header=TRUE)
a<-table.element(a,round(mypacf[i],6))
mytstat <- mypacf[i]*sqrtn
a<-table.element(a,round(mytstat,4))
a<-table.element(a,round(1-pt(abs(mytstat),lengthx),6))
a<-table.row.end(a)
}
a<-table.end(a)
table.save(a,file='mytable1.tab')