Free Statistics

of Irreproducible Research!

Author's title

Author*The author of this computation has been verified*
R Software Modulerwasp_smp.wasp
Title produced by softwareStandard Deviation-Mean Plot
Date of computationThu, 14 Dec 2017 10:56:18 +0100
Cite this page as followsStatistical Computations at FreeStatistics.org, Office for Research Development and Education, URL https://freestatistics.org/blog/index.php?v=date/2017/Dec/14/t15132453961x6yx203re6kg0c.htm/, Retrieved Tue, 14 May 2024 21:15:16 +0000
Statistical Computations at FreeStatistics.org, Office for Research Development and Education, URL https://freestatistics.org/blog/index.php?pk=309430, Retrieved Tue, 14 May 2024 21:15:16 +0000
QR Codes:

Original text written by user:
IsPrivate?No (this computation is public)
User-defined keywords
Estimated Impact98
Family? (F = Feedback message, R = changed R code, M = changed R Module, P = changed Parameters, D = changed Data)
-       [Standard Deviation-Mean Plot] [Standard deviatio...] [2017-12-14 09:56:18] [5c76e56d84d1440d36aad135bd2f9339] [Current]
Feedback Forum

Post a new message
Dataseries X:
18142
8613
8347
7054
5179
6785
7887
6926
6355
7533
6727
8215
13880
10484
9847
6952
9393
12870
9330
14726
10176.66667
7815
6419
9900
9999.833333
14523
12419
8923
11857
12676
14873
11711
15243
9751
7631
8161
10435
15188
10237
11642
16513
18632
15526
14991
10365
10369
10912
14476.83333
19891
17448
17876
11414
9452
15509
11286
13318
9298.833333
6850
4497
4333
7301
4323
6033
4513
4442
7666
6260
5339
3686
4549
3675
7356
8341
20001
9554
6334
4313
4161
7835
9109
7691
5091
7407
11632
17611
9481
7603
4485
10381
8796
10132
10163
17969
6695


Summary of computational transaction
Raw Input view raw input (R code)
Raw Outputview raw output of R engine
Computing time1 seconds
R ServerBig Analytics Cloud Computing Center

\begin{tabular}{lllllllll}
\hline
Summary of computational transaction \tabularnewline
Raw Input view raw input (R code)  \tabularnewline
Raw Outputview raw output of R engine  \tabularnewline
Computing time1 seconds \tabularnewline
R ServerBig Analytics Cloud Computing Center \tabularnewline
\hline
\end{tabular}
%Source: https://freestatistics.org/blog/index.php?pk=309430&T=0

[TABLE]
[ROW]
Summary of computational transaction[/C][/ROW] [ROW]Raw Input[/C] view raw input (R code) [/C][/ROW] [ROW]Raw Output[/C]view raw output of R engine [/C][/ROW] [ROW]Computing time[/C]1 seconds[/C][/ROW] [ROW]R Server[/C]Big Analytics Cloud Computing Center[/C][/ROW] [/TABLE] Source: https://freestatistics.org/blog/index.php?pk=309430&T=0

Globally Unique Identifier (entire table): ba.freestatistics.org/blog/index.php?pk=309430&T=0

As an alternative you can also use a QR Code:  

The GUIDs for individual cells are displayed in the table below:

Summary of computational transaction
Raw Input view raw input (R code)
Raw Outputview raw output of R engine
Computing time1 seconds
R ServerBig Analytics Cloud Computing Center


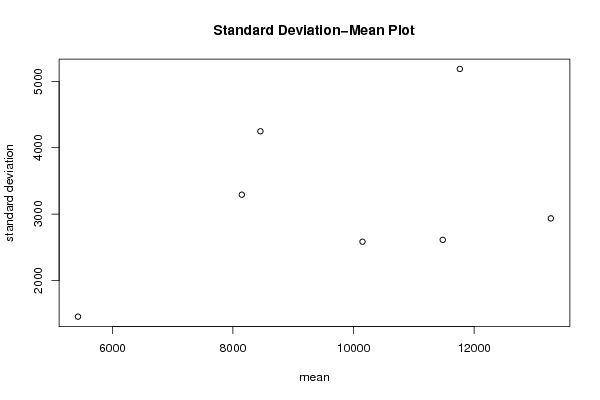
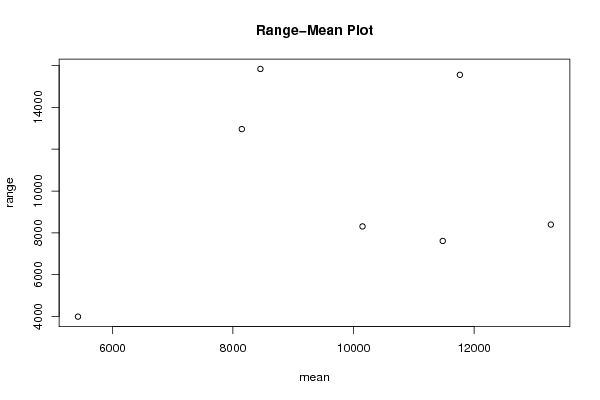
Standard Deviation-Mean Plot
SectionMeanStandard DeviationRange
18146.916666666673291.6371019002212963
210149.38888916672582.509115179058307
311480.652777752610.977424934137612
413273.90277752934.994903299478395
511764.402777755188.2935428040915558
65428.583333333331452.608403611393991
78455.754248.294719381815840

\begin{tabular}{lllllllll}
\hline
Standard Deviation-Mean Plot \tabularnewline
Section & Mean & Standard Deviation & Range \tabularnewline
1 & 8146.91666666667 & 3291.63710190022 & 12963 \tabularnewline
2 & 10149.3888891667 & 2582.50911517905 & 8307 \tabularnewline
3 & 11480.65277775 & 2610.97742493413 & 7612 \tabularnewline
4 & 13273.9027775 & 2934.99490329947 & 8395 \tabularnewline
5 & 11764.40277775 & 5188.29354280409 & 15558 \tabularnewline
6 & 5428.58333333333 & 1452.60840361139 & 3991 \tabularnewline
7 & 8455.75 & 4248.2947193818 & 15840 \tabularnewline
\hline
\end{tabular}
%Source: https://freestatistics.org/blog/index.php?pk=309430&T=1

[TABLE]
[ROW][C]Standard Deviation-Mean Plot[/C][/ROW]
[ROW][C]Section[/C][C]Mean[/C][C]Standard Deviation[/C][C]Range[/C][/ROW]
[ROW][C]1[/C][C]8146.91666666667[/C][C]3291.63710190022[/C][C]12963[/C][/ROW]
[ROW][C]2[/C][C]10149.3888891667[/C][C]2582.50911517905[/C][C]8307[/C][/ROW]
[ROW][C]3[/C][C]11480.65277775[/C][C]2610.97742493413[/C][C]7612[/C][/ROW]
[ROW][C]4[/C][C]13273.9027775[/C][C]2934.99490329947[/C][C]8395[/C][/ROW]
[ROW][C]5[/C][C]11764.40277775[/C][C]5188.29354280409[/C][C]15558[/C][/ROW]
[ROW][C]6[/C][C]5428.58333333333[/C][C]1452.60840361139[/C][C]3991[/C][/ROW]
[ROW][C]7[/C][C]8455.75[/C][C]4248.2947193818[/C][C]15840[/C][/ROW]
[/TABLE]
Source: https://freestatistics.org/blog/index.php?pk=309430&T=1

Globally Unique Identifier (entire table): ba.freestatistics.org/blog/index.php?pk=309430&T=1

As an alternative you can also use a QR Code:  

The GUIDs for individual cells are displayed in the table below:

Standard Deviation-Mean Plot
SectionMeanStandard DeviationRange
18146.916666666673291.6371019002212963
210149.38888916672582.509115179058307
311480.652777752610.977424934137612
413273.90277752934.994903299478395
511764.402777755188.2935428040915558
65428.583333333331452.608403611393991
78455.754248.294719381815840


Regression: S.E.(k) = alpha + beta * Mean(k)
alpha1373.18327389765
beta0.184819603130508
S.D.0.187304762088402
T-STAT0.986732003339448
p-value0.369085617653526

\begin{tabular}{lllllllll}
\hline
Regression: S.E.(k) = alpha + beta * Mean(k) \tabularnewline
alpha & 1373.18327389765 \tabularnewline
beta & 0.184819603130508 \tabularnewline
S.D. & 0.187304762088402 \tabularnewline
T-STAT & 0.986732003339448 \tabularnewline
p-value & 0.369085617653526 \tabularnewline
\hline
\end{tabular}
%Source: https://freestatistics.org/blog/index.php?pk=309430&T=2

[TABLE]
[ROW][C]Regression: S.E.(k) = alpha + beta * Mean(k)[/C][/ROW]
[ROW][C]alpha[/C][C]1373.18327389765[/C][/ROW]
[ROW][C]beta[/C][C]0.184819603130508[/C][/ROW]
[ROW][C]S.D.[/C][C]0.187304762088402[/C][/ROW]
[ROW][C]T-STAT[/C][C]0.986732003339448[/C][/ROW]
[ROW][C]p-value[/C][C]0.369085617653526[/C][/ROW]
[/TABLE]
Source: https://freestatistics.org/blog/index.php?pk=309430&T=2

Globally Unique Identifier (entire table): ba.freestatistics.org/blog/index.php?pk=309430&T=2

As an alternative you can also use a QR Code:  

The GUIDs for individual cells are displayed in the table below:

Regression: S.E.(k) = alpha + beta * Mean(k)
alpha1373.18327389765
beta0.184819603130508
S.D.0.187304762088402
T-STAT0.986732003339448
p-value0.369085617653526


Regression: ln S.E.(k) = alpha + beta * ln Mean(k)
alpha0.90864331129155
beta0.774514789194693
S.D.0.494033773805369
T-STAT1.56773651977045
p-value0.177728367964085
Lambda0.225485210805307

\begin{tabular}{lllllllll}
\hline
Regression: ln S.E.(k) = alpha + beta * ln Mean(k) \tabularnewline
alpha & 0.90864331129155 \tabularnewline
beta & 0.774514789194693 \tabularnewline
S.D. & 0.494033773805369 \tabularnewline
T-STAT & 1.56773651977045 \tabularnewline
p-value & 0.177728367964085 \tabularnewline
Lambda & 0.225485210805307 \tabularnewline
\hline
\end{tabular}
%Source: https://freestatistics.org/blog/index.php?pk=309430&T=3

[TABLE]
[ROW][C]Regression: ln S.E.(k) = alpha + beta * ln Mean(k)[/C][/ROW]
[ROW][C]alpha[/C][C]0.90864331129155[/C][/ROW]
[ROW][C]beta[/C][C]0.774514789194693[/C][/ROW]
[ROW][C]S.D.[/C][C]0.494033773805369[/C][/ROW]
[ROW][C]T-STAT[/C][C]1.56773651977045[/C][/ROW]
[ROW][C]p-value[/C][C]0.177728367964085[/C][/ROW]
[ROW][C]Lambda[/C][C]0.225485210805307[/C][/ROW]
[/TABLE]
Source: https://freestatistics.org/blog/index.php?pk=309430&T=3

Globally Unique Identifier (entire table): ba.freestatistics.org/blog/index.php?pk=309430&T=3

As an alternative you can also use a QR Code:  

The GUIDs for individual cells are displayed in the table below:

Regression: ln S.E.(k) = alpha + beta * ln Mean(k)
alpha0.90864331129155
beta0.774514789194693
S.D.0.494033773805369
T-STAT1.56773651977045
p-value0.177728367964085
Lambda0.225485210805307


Parameters (Session):
par1 = 12 ;
Parameters (R input):
par1 = 12 ;
R code (references can be found in the software module):
par1 <- '12'
par1 <- as.numeric(par1)
(n <- length(x))
(np <- floor(n / par1))
arr <- array(NA,dim=c(par1,np))
j <- 0
k <- 1
for (i in 1:(np*par1))
{
j = j + 1
arr[j,k] <- x[i]
if (j == par1) {
j = 0
k=k+1
}
}
arr
arr.mean <- array(NA,dim=np)
arr.sd <- array(NA,dim=np)
arr.range <- array(NA,dim=np)
for (j in 1:np)
{
arr.mean[j] <- mean(arr[,j],na.rm=TRUE)
arr.sd[j] <- sd(arr[,j],na.rm=TRUE)
arr.range[j] <- max(arr[,j],na.rm=TRUE) - min(arr[,j],na.rm=TRUE)
}
arr.mean
arr.sd
arr.range
(lm1 <- lm(arr.sd~arr.mean))
(lnlm1 <- lm(log(arr.sd)~log(arr.mean)))
(lm2 <- lm(arr.range~arr.mean))
bitmap(file='test1.png')
plot(arr.mean,arr.sd,main='Standard Deviation-Mean Plot',xlab='mean',ylab='standard deviation')
dev.off()
bitmap(file='test2.png')
plot(arr.mean,arr.range,main='Range-Mean Plot',xlab='mean',ylab='range')
dev.off()
load(file='createtable')
a<-table.start()
a<-table.row.start(a)
a<-table.element(a,'Standard Deviation-Mean Plot',4,TRUE)
a<-table.row.end(a)
a<-table.row.start(a)
a<-table.element(a,'Section',header=TRUE)
a<-table.element(a,'Mean',header=TRUE)
a<-table.element(a,'Standard Deviation',header=TRUE)
a<-table.element(a,'Range',header=TRUE)
a<-table.row.end(a)
for (j in 1:np) {
a<-table.row.start(a)
a<-table.element(a,j,header=TRUE)
a<-table.element(a,arr.mean[j])
a<-table.element(a,arr.sd[j] )
a<-table.element(a,arr.range[j] )
a<-table.row.end(a)
}
a<-table.end(a)
table.save(a,file='mytable.tab')
a<-table.start()
a<-table.row.start(a)
a<-table.element(a,'Regression: S.E.(k) = alpha + beta * Mean(k)',2,TRUE)
a<-table.row.end(a)
a<-table.row.start(a)
a<-table.element(a,'alpha',header=TRUE)
a<-table.element(a,lm1$coefficients[[1]])
a<-table.row.end(a)
a<-table.row.start(a)
a<-table.element(a,'beta',header=TRUE)
a<-table.element(a,lm1$coefficients[[2]])
a<-table.row.end(a)
a<-table.row.start(a)
a<-table.element(a,'S.D.',header=TRUE)
a<-table.element(a,summary(lm1)$coefficients[2,2])
a<-table.row.end(a)
a<-table.row.start(a)
a<-table.element(a,'T-STAT',header=TRUE)
a<-table.element(a,summary(lm1)$coefficients[2,3])
a<-table.row.end(a)
a<-table.row.start(a)
a<-table.element(a,'p-value',header=TRUE)
a<-table.element(a,summary(lm1)$coefficients[2,4])
a<-table.row.end(a)
a<-table.end(a)
table.save(a,file='mytable1.tab')
a<-table.start()
a<-table.row.start(a)
a<-table.element(a,'Regression: ln S.E.(k) = alpha + beta * ln Mean(k)',2,TRUE)
a<-table.row.end(a)
a<-table.row.start(a)
a<-table.element(a,'alpha',header=TRUE)
a<-table.element(a,lnlm1$coefficients[[1]])
a<-table.row.end(a)
a<-table.row.start(a)
a<-table.element(a,'beta',header=TRUE)
a<-table.element(a,lnlm1$coefficients[[2]])
a<-table.row.end(a)
a<-table.row.start(a)
a<-table.element(a,'S.D.',header=TRUE)
a<-table.element(a,summary(lnlm1)$coefficients[2,2])
a<-table.row.end(a)
a<-table.row.start(a)
a<-table.element(a,'T-STAT',header=TRUE)
a<-table.element(a,summary(lnlm1)$coefficients[2,3])
a<-table.row.end(a)
a<-table.row.start(a)
a<-table.element(a,'p-value',header=TRUE)
a<-table.element(a,summary(lnlm1)$coefficients[2,4])
a<-table.row.end(a)
a<-table.row.start(a)
a<-table.element(a,'Lambda',header=TRUE)
a<-table.element(a,1-lnlm1$coefficients[[2]])
a<-table.row.end(a)
a<-table.end(a)
table.save(a,file='mytable2.tab')