Free Statistics

of Irreproducible Research!

Author's title

Author*The author of this computation has been verified*
R Software Modulerwasp_autocorrelation.wasp
Title produced by software(Partial) Autocorrelation Function
Date of computationThu, 14 Dec 2017 10:33:20 +0100
Cite this page as followsStatistical Computations at FreeStatistics.org, Office for Research Development and Education, URL https://freestatistics.org/blog/index.php?v=date/2017/Dec/14/t151324406825e12jrppreec39.htm/, Retrieved Tue, 14 May 2024 12:36:48 +0000
Statistical Computations at FreeStatistics.org, Office for Research Development and Education, URL https://freestatistics.org/blog/index.php?pk=309423, Retrieved Tue, 14 May 2024 12:36:48 +0000
QR Codes:

Original text written by user:
IsPrivate?No (this computation is public)
User-defined keywords
Estimated Impact114
Family? (F = Feedback message, R = changed R code, M = changed R Module, P = changed Parameters, D = changed Data)
-       [(Partial) Autocorrelation Function] [] [2017-12-14 09:33:20] [d2d54f927b4b6a5dbf001a3c29aa1f74] [Current]
Feedback Forum

Post a new message
Dataseries X:
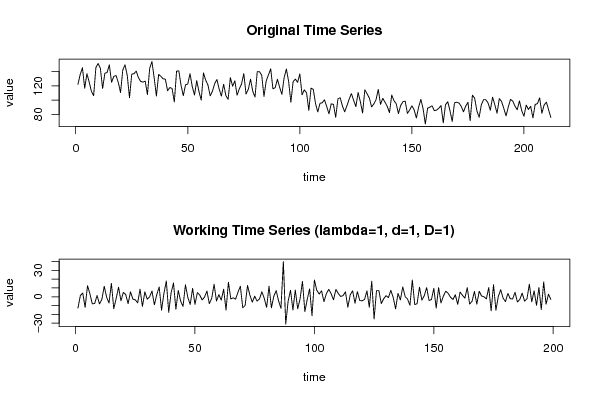
122.2
136.1
145.5
116.7
137.1
125.5
112.4
106.3
145.7
151.5
144.6
116.4
137.7
138.8
149.5
125
133.4
134.4
124.8
110.6
142.4
149.6
134.6
103.3
136.5
137.1
140.7
131.4
126.2
125.3
126.6
107.7
144.5
154.2
131.4
105.7
136.2
133.3
130
129.3
113.1
117.7
116.3
97.3
140.6
141.2
120.8
106.2
121.5
122.6
137.2
118.9
107.2
127.4
111.8
100
138.3
128
121.2
105.9
112.5
123.1
129
115.5
105.7
122.3
106.4
101.1
131.6
119.5
127
106.9
115.9
122.7
137.2
108.5
115.2
129.4
112.3
104.3
140
139.9
134.9
105.1
127
135.5
143.9
115.8
117.5
129.3
117.9
108.1
131.7
143.7
126.2
96.9
125.8
129.6
124.9
136.8
107.5
114.3
110.3
85.5
116.8
115.1
95.2
83.4
95.4
96.3
100.5
90.9
80.6
94.8
93.9
75.9
101.6
103.3
91.8
83.5
92
101.2
109.1
99.8
90.8
110.6
97.8
81.9
114.4
108.8
103.1
90.4
94.4
100.5
115.1
93.9
102.5
97.1
91.2
82.3
107.1
99.2
94.8
81.1
92.5
97.7
98.5
81.2
86.2
92
86.3
74.8
90
101.1
87.8
66.3
88.6
90
92
85.1
85.9
88.5
92.3
68
93.6
97.7
85.1
69.9
96.1
97
95.9
91.3
83.5
91.4
96.8
71
106.9
102.7
84.9
75.8
93.6
100.7
100.5
95.9
85.7
104.1
93.5
81.5
102.1
98.2
88.4
77.8
90.1
101
98.6
91.5
86.4
98.9
85.2
77.3
93
86.8
91.3
74.9
93.9
95
103.1
81.4
93.1
97.2
86.4
75.5


Summary of computational transaction
Raw Input view raw input (R code)
Raw Outputview raw output of R engine
Computing time1 seconds
R ServerBig Analytics Cloud Computing Center

\begin{tabular}{lllllllll}
\hline
Summary of computational transaction \tabularnewline
Raw Input view raw input (R code)  \tabularnewline
Raw Outputview raw output of R engine  \tabularnewline
Computing time1 seconds \tabularnewline
R ServerBig Analytics Cloud Computing Center \tabularnewline
\hline
\end{tabular}
%Source: https://freestatistics.org/blog/index.php?pk=309423&T=0

[TABLE]
[ROW]
Summary of computational transaction[/C][/ROW] [ROW]Raw Input[/C] view raw input (R code) [/C][/ROW] [ROW]Raw Output[/C]view raw output of R engine [/C][/ROW] [ROW]Computing time[/C]1 seconds[/C][/ROW] [ROW]R Server[/C]Big Analytics Cloud Computing Center[/C][/ROW] [/TABLE] Source: https://freestatistics.org/blog/index.php?pk=309423&T=0

Globally Unique Identifier (entire table): ba.freestatistics.org/blog/index.php?pk=309423&T=0

As an alternative you can also use a QR Code:  

The GUIDs for individual cells are displayed in the table below:

Summary of computational transaction
Raw Input view raw input (R code)
Raw Outputview raw output of R engine
Computing time1 seconds
R ServerBig Analytics Cloud Computing Center


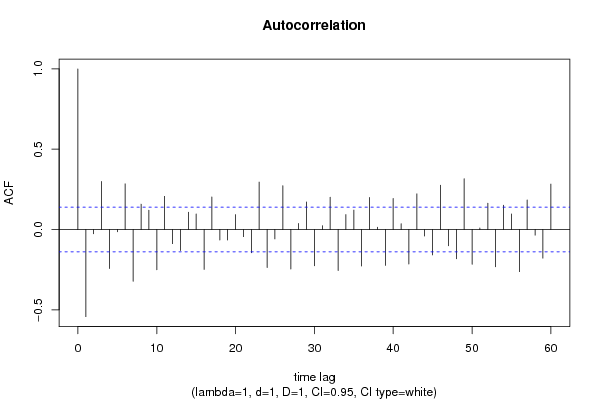
Autocorrelation Function
Time lag kACF(k)T-STATP-value
1-0.542537-7.65340
2-0.026325-0.37140.355381
30.2996024.22641.8e-05
4-0.242896-3.42650.000371
5-0.013548-0.19110.424313
60.2846174.0154.2e-05
7-0.322638-4.55145e-06
80.1580512.22960.013447
90.1204351.69890.045447
10-0.251043-3.54140.000248
110.2067262.91620.001975
12-0.087768-1.23810.108566
13-0.130532-1.84140.033527
140.1077231.51960.065097
150.0969371.36750.08651
16-0.248118-3.50010.000287
170.2021522.85170.002404
18-0.065782-0.9280.177275
19-0.065678-0.92650.177655
200.0927481.30840.096127
21-0.044265-0.62440.266528
22-0.144689-2.04110.021281
230.2952164.16452.3e-05
24-0.236173-3.33160.000515
25-0.058411-0.8240.205467
260.2728643.84928e-05
27-0.245439-3.46230.000328
280.0373280.52660.299539
290.1710682.41320.00836
30-0.225832-3.18580.000838
310.0240050.33860.367624
320.2005892.82970.002569
33-0.255428-3.60330.000199
340.0927011.30770.09624
350.1210611.70780.044619
36-0.22703-3.20260.000793
370.1992992.81150.002713
380.0139140.19630.422296
39-0.223334-3.15050.000941
400.1928782.72090.003544
410.0365150.51510.303524
42-0.214883-3.03130.001379
430.2219933.13160.001
44-0.040438-0.57050.284508
45-0.157726-2.2250.013602
460.2755453.8876.9e-05
47-0.101341-1.42960.077201
48-0.182334-2.57210.005418
490.3158314.45537e-06
50-0.216144-3.04910.001304
510.0099670.14060.444162
520.16352.30650.011058
53-0.231759-3.26940.000635
540.1508752.12840.017269
550.0971941.37110.085946
56-0.262135-3.69790.000141
570.1841592.59790.005041
58-0.035033-0.49420.310853
59-0.178036-2.51150.006408
600.2828593.99024.6e-05

\begin{tabular}{lllllllll}
\hline
Autocorrelation Function \tabularnewline
Time lag k & ACF(k) & T-STAT & P-value \tabularnewline
1 & -0.542537 & -7.6534 & 0 \tabularnewline
2 & -0.026325 & -0.3714 & 0.355381 \tabularnewline
3 & 0.299602 & 4.2264 & 1.8e-05 \tabularnewline
4 & -0.242896 & -3.4265 & 0.000371 \tabularnewline
5 & -0.013548 & -0.1911 & 0.424313 \tabularnewline
6 & 0.284617 & 4.015 & 4.2e-05 \tabularnewline
7 & -0.322638 & -4.5514 & 5e-06 \tabularnewline
8 & 0.158051 & 2.2296 & 0.013447 \tabularnewline
9 & 0.120435 & 1.6989 & 0.045447 \tabularnewline
10 & -0.251043 & -3.5414 & 0.000248 \tabularnewline
11 & 0.206726 & 2.9162 & 0.001975 \tabularnewline
12 & -0.087768 & -1.2381 & 0.108566 \tabularnewline
13 & -0.130532 & -1.8414 & 0.033527 \tabularnewline
14 & 0.107723 & 1.5196 & 0.065097 \tabularnewline
15 & 0.096937 & 1.3675 & 0.08651 \tabularnewline
16 & -0.248118 & -3.5001 & 0.000287 \tabularnewline
17 & 0.202152 & 2.8517 & 0.002404 \tabularnewline
18 & -0.065782 & -0.928 & 0.177275 \tabularnewline
19 & -0.065678 & -0.9265 & 0.177655 \tabularnewline
20 & 0.092748 & 1.3084 & 0.096127 \tabularnewline
21 & -0.044265 & -0.6244 & 0.266528 \tabularnewline
22 & -0.144689 & -2.0411 & 0.021281 \tabularnewline
23 & 0.295216 & 4.1645 & 2.3e-05 \tabularnewline
24 & -0.236173 & -3.3316 & 0.000515 \tabularnewline
25 & -0.058411 & -0.824 & 0.205467 \tabularnewline
26 & 0.272864 & 3.8492 & 8e-05 \tabularnewline
27 & -0.245439 & -3.4623 & 0.000328 \tabularnewline
28 & 0.037328 & 0.5266 & 0.299539 \tabularnewline
29 & 0.171068 & 2.4132 & 0.00836 \tabularnewline
30 & -0.225832 & -3.1858 & 0.000838 \tabularnewline
31 & 0.024005 & 0.3386 & 0.367624 \tabularnewline
32 & 0.200589 & 2.8297 & 0.002569 \tabularnewline
33 & -0.255428 & -3.6033 & 0.000199 \tabularnewline
34 & 0.092701 & 1.3077 & 0.09624 \tabularnewline
35 & 0.121061 & 1.7078 & 0.044619 \tabularnewline
36 & -0.22703 & -3.2026 & 0.000793 \tabularnewline
37 & 0.199299 & 2.8115 & 0.002713 \tabularnewline
38 & 0.013914 & 0.1963 & 0.422296 \tabularnewline
39 & -0.223334 & -3.1505 & 0.000941 \tabularnewline
40 & 0.192878 & 2.7209 & 0.003544 \tabularnewline
41 & 0.036515 & 0.5151 & 0.303524 \tabularnewline
42 & -0.214883 & -3.0313 & 0.001379 \tabularnewline
43 & 0.221993 & 3.1316 & 0.001 \tabularnewline
44 & -0.040438 & -0.5705 & 0.284508 \tabularnewline
45 & -0.157726 & -2.225 & 0.013602 \tabularnewline
46 & 0.275545 & 3.887 & 6.9e-05 \tabularnewline
47 & -0.101341 & -1.4296 & 0.077201 \tabularnewline
48 & -0.182334 & -2.5721 & 0.005418 \tabularnewline
49 & 0.315831 & 4.4553 & 7e-06 \tabularnewline
50 & -0.216144 & -3.0491 & 0.001304 \tabularnewline
51 & 0.009967 & 0.1406 & 0.444162 \tabularnewline
52 & 0.1635 & 2.3065 & 0.011058 \tabularnewline
53 & -0.231759 & -3.2694 & 0.000635 \tabularnewline
54 & 0.150875 & 2.1284 & 0.017269 \tabularnewline
55 & 0.097194 & 1.3711 & 0.085946 \tabularnewline
56 & -0.262135 & -3.6979 & 0.000141 \tabularnewline
57 & 0.184159 & 2.5979 & 0.005041 \tabularnewline
58 & -0.035033 & -0.4942 & 0.310853 \tabularnewline
59 & -0.178036 & -2.5115 & 0.006408 \tabularnewline
60 & 0.282859 & 3.9902 & 4.6e-05 \tabularnewline
\hline
\end{tabular}
%Source: https://freestatistics.org/blog/index.php?pk=309423&T=1

[TABLE]
[ROW][C]Autocorrelation Function[/C][/ROW]
[ROW][C]Time lag k[/C][C]ACF(k)[/C][C]T-STAT[/C][C]P-value[/C][/ROW]
[ROW][C]1[/C][C]-0.542537[/C][C]-7.6534[/C][C]0[/C][/ROW]
[ROW][C]2[/C][C]-0.026325[/C][C]-0.3714[/C][C]0.355381[/C][/ROW]
[ROW][C]3[/C][C]0.299602[/C][C]4.2264[/C][C]1.8e-05[/C][/ROW]
[ROW][C]4[/C][C]-0.242896[/C][C]-3.4265[/C][C]0.000371[/C][/ROW]
[ROW][C]5[/C][C]-0.013548[/C][C]-0.1911[/C][C]0.424313[/C][/ROW]
[ROW][C]6[/C][C]0.284617[/C][C]4.015[/C][C]4.2e-05[/C][/ROW]
[ROW][C]7[/C][C]-0.322638[/C][C]-4.5514[/C][C]5e-06[/C][/ROW]
[ROW][C]8[/C][C]0.158051[/C][C]2.2296[/C][C]0.013447[/C][/ROW]
[ROW][C]9[/C][C]0.120435[/C][C]1.6989[/C][C]0.045447[/C][/ROW]
[ROW][C]10[/C][C]-0.251043[/C][C]-3.5414[/C][C]0.000248[/C][/ROW]
[ROW][C]11[/C][C]0.206726[/C][C]2.9162[/C][C]0.001975[/C][/ROW]
[ROW][C]12[/C][C]-0.087768[/C][C]-1.2381[/C][C]0.108566[/C][/ROW]
[ROW][C]13[/C][C]-0.130532[/C][C]-1.8414[/C][C]0.033527[/C][/ROW]
[ROW][C]14[/C][C]0.107723[/C][C]1.5196[/C][C]0.065097[/C][/ROW]
[ROW][C]15[/C][C]0.096937[/C][C]1.3675[/C][C]0.08651[/C][/ROW]
[ROW][C]16[/C][C]-0.248118[/C][C]-3.5001[/C][C]0.000287[/C][/ROW]
[ROW][C]17[/C][C]0.202152[/C][C]2.8517[/C][C]0.002404[/C][/ROW]
[ROW][C]18[/C][C]-0.065782[/C][C]-0.928[/C][C]0.177275[/C][/ROW]
[ROW][C]19[/C][C]-0.065678[/C][C]-0.9265[/C][C]0.177655[/C][/ROW]
[ROW][C]20[/C][C]0.092748[/C][C]1.3084[/C][C]0.096127[/C][/ROW]
[ROW][C]21[/C][C]-0.044265[/C][C]-0.6244[/C][C]0.266528[/C][/ROW]
[ROW][C]22[/C][C]-0.144689[/C][C]-2.0411[/C][C]0.021281[/C][/ROW]
[ROW][C]23[/C][C]0.295216[/C][C]4.1645[/C][C]2.3e-05[/C][/ROW]
[ROW][C]24[/C][C]-0.236173[/C][C]-3.3316[/C][C]0.000515[/C][/ROW]
[ROW][C]25[/C][C]-0.058411[/C][C]-0.824[/C][C]0.205467[/C][/ROW]
[ROW][C]26[/C][C]0.272864[/C][C]3.8492[/C][C]8e-05[/C][/ROW]
[ROW][C]27[/C][C]-0.245439[/C][C]-3.4623[/C][C]0.000328[/C][/ROW]
[ROW][C]28[/C][C]0.037328[/C][C]0.5266[/C][C]0.299539[/C][/ROW]
[ROW][C]29[/C][C]0.171068[/C][C]2.4132[/C][C]0.00836[/C][/ROW]
[ROW][C]30[/C][C]-0.225832[/C][C]-3.1858[/C][C]0.000838[/C][/ROW]
[ROW][C]31[/C][C]0.024005[/C][C]0.3386[/C][C]0.367624[/C][/ROW]
[ROW][C]32[/C][C]0.200589[/C][C]2.8297[/C][C]0.002569[/C][/ROW]
[ROW][C]33[/C][C]-0.255428[/C][C]-3.6033[/C][C]0.000199[/C][/ROW]
[ROW][C]34[/C][C]0.092701[/C][C]1.3077[/C][C]0.09624[/C][/ROW]
[ROW][C]35[/C][C]0.121061[/C][C]1.7078[/C][C]0.044619[/C][/ROW]
[ROW][C]36[/C][C]-0.22703[/C][C]-3.2026[/C][C]0.000793[/C][/ROW]
[ROW][C]37[/C][C]0.199299[/C][C]2.8115[/C][C]0.002713[/C][/ROW]
[ROW][C]38[/C][C]0.013914[/C][C]0.1963[/C][C]0.422296[/C][/ROW]
[ROW][C]39[/C][C]-0.223334[/C][C]-3.1505[/C][C]0.000941[/C][/ROW]
[ROW][C]40[/C][C]0.192878[/C][C]2.7209[/C][C]0.003544[/C][/ROW]
[ROW][C]41[/C][C]0.036515[/C][C]0.5151[/C][C]0.303524[/C][/ROW]
[ROW][C]42[/C][C]-0.214883[/C][C]-3.0313[/C][C]0.001379[/C][/ROW]
[ROW][C]43[/C][C]0.221993[/C][C]3.1316[/C][C]0.001[/C][/ROW]
[ROW][C]44[/C][C]-0.040438[/C][C]-0.5705[/C][C]0.284508[/C][/ROW]
[ROW][C]45[/C][C]-0.157726[/C][C]-2.225[/C][C]0.013602[/C][/ROW]
[ROW][C]46[/C][C]0.275545[/C][C]3.887[/C][C]6.9e-05[/C][/ROW]
[ROW][C]47[/C][C]-0.101341[/C][C]-1.4296[/C][C]0.077201[/C][/ROW]
[ROW][C]48[/C][C]-0.182334[/C][C]-2.5721[/C][C]0.005418[/C][/ROW]
[ROW][C]49[/C][C]0.315831[/C][C]4.4553[/C][C]7e-06[/C][/ROW]
[ROW][C]50[/C][C]-0.216144[/C][C]-3.0491[/C][C]0.001304[/C][/ROW]
[ROW][C]51[/C][C]0.009967[/C][C]0.1406[/C][C]0.444162[/C][/ROW]
[ROW][C]52[/C][C]0.1635[/C][C]2.3065[/C][C]0.011058[/C][/ROW]
[ROW][C]53[/C][C]-0.231759[/C][C]-3.2694[/C][C]0.000635[/C][/ROW]
[ROW][C]54[/C][C]0.150875[/C][C]2.1284[/C][C]0.017269[/C][/ROW]
[ROW][C]55[/C][C]0.097194[/C][C]1.3711[/C][C]0.085946[/C][/ROW]
[ROW][C]56[/C][C]-0.262135[/C][C]-3.6979[/C][C]0.000141[/C][/ROW]
[ROW][C]57[/C][C]0.184159[/C][C]2.5979[/C][C]0.005041[/C][/ROW]
[ROW][C]58[/C][C]-0.035033[/C][C]-0.4942[/C][C]0.310853[/C][/ROW]
[ROW][C]59[/C][C]-0.178036[/C][C]-2.5115[/C][C]0.006408[/C][/ROW]
[ROW][C]60[/C][C]0.282859[/C][C]3.9902[/C][C]4.6e-05[/C][/ROW]
[/TABLE]
Source: https://freestatistics.org/blog/index.php?pk=309423&T=1

Globally Unique Identifier (entire table): ba.freestatistics.org/blog/index.php?pk=309423&T=1

As an alternative you can also use a QR Code:  

The GUIDs for individual cells are displayed in the table below:

Autocorrelation Function
Time lag kACF(k)T-STATP-value
1-0.542537-7.65340
2-0.026325-0.37140.355381
30.2996024.22641.8e-05
4-0.242896-3.42650.000371
5-0.013548-0.19110.424313
60.2846174.0154.2e-05
7-0.322638-4.55145e-06
80.1580512.22960.013447
90.1204351.69890.045447
10-0.251043-3.54140.000248
110.2067262.91620.001975
12-0.087768-1.23810.108566
13-0.130532-1.84140.033527
140.1077231.51960.065097
150.0969371.36750.08651
16-0.248118-3.50010.000287
170.2021522.85170.002404
18-0.065782-0.9280.177275
19-0.065678-0.92650.177655
200.0927481.30840.096127
21-0.044265-0.62440.266528
22-0.144689-2.04110.021281
230.2952164.16452.3e-05
24-0.236173-3.33160.000515
25-0.058411-0.8240.205467
260.2728643.84928e-05
27-0.245439-3.46230.000328
280.0373280.52660.299539
290.1710682.41320.00836
30-0.225832-3.18580.000838
310.0240050.33860.367624
320.2005892.82970.002569
33-0.255428-3.60330.000199
340.0927011.30770.09624
350.1210611.70780.044619
36-0.22703-3.20260.000793
370.1992992.81150.002713
380.0139140.19630.422296
39-0.223334-3.15050.000941
400.1928782.72090.003544
410.0365150.51510.303524
42-0.214883-3.03130.001379
430.2219933.13160.001
44-0.040438-0.57050.284508
45-0.157726-2.2250.013602
460.2755453.8876.9e-05
47-0.101341-1.42960.077201
48-0.182334-2.57210.005418
490.3158314.45537e-06
50-0.216144-3.04910.001304
510.0099670.14060.444162
520.16352.30650.011058
53-0.231759-3.26940.000635
540.1508752.12840.017269
550.0971941.37110.085946
56-0.262135-3.69790.000141
570.1841592.59790.005041
58-0.035033-0.49420.310853
59-0.178036-2.51150.006408
600.2828593.99024.6e-05


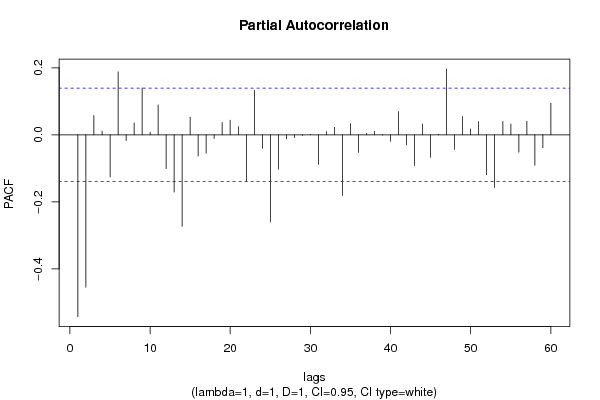
Partial Autocorrelation Function
Time lag kPACF(k)T-STATP-value
1-0.542537-7.65340
2-0.454433-6.41060
30.0576540.81330.208506
40.0110740.15620.43801
5-0.125617-1.7720.038959
60.1877462.64850.004367
7-0.017197-0.24260.404283
80.0351270.49550.31039
90.1396771.97040.025091
100.0076930.10850.456842
110.0887011.25130.106149
12-0.100818-1.42220.078266
13-0.170516-2.40540.008534
14-0.273132-3.8537.9e-05
150.0525720.74160.229596
16-0.063223-0.89190.186771
17-0.054697-0.77160.220633
18-0.01071-0.15110.44003
190.0367620.51860.302311
200.0435370.61420.269904
210.0242710.34240.366209
22-0.139368-1.9660.025343
230.1326671.87150.031372
24-0.040154-0.56640.285868
25-0.260383-3.67310.000154
26-0.10232-1.44340.075241
27-0.011555-0.1630.435341
28-0.008302-0.11710.453445
29-0.001711-0.02410.490384
300.000440.00620.497526
31-0.088284-1.24540.107224
320.0099710.14070.444141
330.0226090.31890.375052
34-0.180932-2.55240.005725
350.0332020.46840.320017
36-0.052493-0.74050.229932
370.0048940.0690.472512
380.0103730.14630.441903
39-0.000666-0.00940.496258
40-0.019047-0.26870.394222
410.0692190.97640.165014
42-0.030548-0.43090.333491
43-0.091605-1.29220.098885
440.0319940.45130.32612
45-0.066889-0.94360.173264
460.0012780.0180.492816
470.1964822.77170.003053
48-0.043479-0.61330.270174
490.0545550.76960.221226
500.0173570.24490.403411
510.0393340.55490.289801
52-0.119211-1.68170.0471
53-0.157018-2.2150.013947
540.0398650.56240.287251
550.0320190.45170.325992
56-0.052127-0.73530.231498
570.040310.56860.28512
58-0.09093-1.28270.100541
59-0.038554-0.54390.293568
600.0940951.32740.092952

\begin{tabular}{lllllllll}
\hline
Partial Autocorrelation Function \tabularnewline
Time lag k & PACF(k) & T-STAT & P-value \tabularnewline
1 & -0.542537 & -7.6534 & 0 \tabularnewline
2 & -0.454433 & -6.4106 & 0 \tabularnewline
3 & 0.057654 & 0.8133 & 0.208506 \tabularnewline
4 & 0.011074 & 0.1562 & 0.43801 \tabularnewline
5 & -0.125617 & -1.772 & 0.038959 \tabularnewline
6 & 0.187746 & 2.6485 & 0.004367 \tabularnewline
7 & -0.017197 & -0.2426 & 0.404283 \tabularnewline
8 & 0.035127 & 0.4955 & 0.31039 \tabularnewline
9 & 0.139677 & 1.9704 & 0.025091 \tabularnewline
10 & 0.007693 & 0.1085 & 0.456842 \tabularnewline
11 & 0.088701 & 1.2513 & 0.106149 \tabularnewline
12 & -0.100818 & -1.4222 & 0.078266 \tabularnewline
13 & -0.170516 & -2.4054 & 0.008534 \tabularnewline
14 & -0.273132 & -3.853 & 7.9e-05 \tabularnewline
15 & 0.052572 & 0.7416 & 0.229596 \tabularnewline
16 & -0.063223 & -0.8919 & 0.186771 \tabularnewline
17 & -0.054697 & -0.7716 & 0.220633 \tabularnewline
18 & -0.01071 & -0.1511 & 0.44003 \tabularnewline
19 & 0.036762 & 0.5186 & 0.302311 \tabularnewline
20 & 0.043537 & 0.6142 & 0.269904 \tabularnewline
21 & 0.024271 & 0.3424 & 0.366209 \tabularnewline
22 & -0.139368 & -1.966 & 0.025343 \tabularnewline
23 & 0.132667 & 1.8715 & 0.031372 \tabularnewline
24 & -0.040154 & -0.5664 & 0.285868 \tabularnewline
25 & -0.260383 & -3.6731 & 0.000154 \tabularnewline
26 & -0.10232 & -1.4434 & 0.075241 \tabularnewline
27 & -0.011555 & -0.163 & 0.435341 \tabularnewline
28 & -0.008302 & -0.1171 & 0.453445 \tabularnewline
29 & -0.001711 & -0.0241 & 0.490384 \tabularnewline
30 & 0.00044 & 0.0062 & 0.497526 \tabularnewline
31 & -0.088284 & -1.2454 & 0.107224 \tabularnewline
32 & 0.009971 & 0.1407 & 0.444141 \tabularnewline
33 & 0.022609 & 0.3189 & 0.375052 \tabularnewline
34 & -0.180932 & -2.5524 & 0.005725 \tabularnewline
35 & 0.033202 & 0.4684 & 0.320017 \tabularnewline
36 & -0.052493 & -0.7405 & 0.229932 \tabularnewline
37 & 0.004894 & 0.069 & 0.472512 \tabularnewline
38 & 0.010373 & 0.1463 & 0.441903 \tabularnewline
39 & -0.000666 & -0.0094 & 0.496258 \tabularnewline
40 & -0.019047 & -0.2687 & 0.394222 \tabularnewline
41 & 0.069219 & 0.9764 & 0.165014 \tabularnewline
42 & -0.030548 & -0.4309 & 0.333491 \tabularnewline
43 & -0.091605 & -1.2922 & 0.098885 \tabularnewline
44 & 0.031994 & 0.4513 & 0.32612 \tabularnewline
45 & -0.066889 & -0.9436 & 0.173264 \tabularnewline
46 & 0.001278 & 0.018 & 0.492816 \tabularnewline
47 & 0.196482 & 2.7717 & 0.003053 \tabularnewline
48 & -0.043479 & -0.6133 & 0.270174 \tabularnewline
49 & 0.054555 & 0.7696 & 0.221226 \tabularnewline
50 & 0.017357 & 0.2449 & 0.403411 \tabularnewline
51 & 0.039334 & 0.5549 & 0.289801 \tabularnewline
52 & -0.119211 & -1.6817 & 0.0471 \tabularnewline
53 & -0.157018 & -2.215 & 0.013947 \tabularnewline
54 & 0.039865 & 0.5624 & 0.287251 \tabularnewline
55 & 0.032019 & 0.4517 & 0.325992 \tabularnewline
56 & -0.052127 & -0.7353 & 0.231498 \tabularnewline
57 & 0.04031 & 0.5686 & 0.28512 \tabularnewline
58 & -0.09093 & -1.2827 & 0.100541 \tabularnewline
59 & -0.038554 & -0.5439 & 0.293568 \tabularnewline
60 & 0.094095 & 1.3274 & 0.092952 \tabularnewline
\hline
\end{tabular}
%Source: https://freestatistics.org/blog/index.php?pk=309423&T=2

[TABLE]
[ROW][C]Partial Autocorrelation Function[/C][/ROW]
[ROW][C]Time lag k[/C][C]PACF(k)[/C][C]T-STAT[/C][C]P-value[/C][/ROW]
[ROW][C]1[/C][C]-0.542537[/C][C]-7.6534[/C][C]0[/C][/ROW]
[ROW][C]2[/C][C]-0.454433[/C][C]-6.4106[/C][C]0[/C][/ROW]
[ROW][C]3[/C][C]0.057654[/C][C]0.8133[/C][C]0.208506[/C][/ROW]
[ROW][C]4[/C][C]0.011074[/C][C]0.1562[/C][C]0.43801[/C][/ROW]
[ROW][C]5[/C][C]-0.125617[/C][C]-1.772[/C][C]0.038959[/C][/ROW]
[ROW][C]6[/C][C]0.187746[/C][C]2.6485[/C][C]0.004367[/C][/ROW]
[ROW][C]7[/C][C]-0.017197[/C][C]-0.2426[/C][C]0.404283[/C][/ROW]
[ROW][C]8[/C][C]0.035127[/C][C]0.4955[/C][C]0.31039[/C][/ROW]
[ROW][C]9[/C][C]0.139677[/C][C]1.9704[/C][C]0.025091[/C][/ROW]
[ROW][C]10[/C][C]0.007693[/C][C]0.1085[/C][C]0.456842[/C][/ROW]
[ROW][C]11[/C][C]0.088701[/C][C]1.2513[/C][C]0.106149[/C][/ROW]
[ROW][C]12[/C][C]-0.100818[/C][C]-1.4222[/C][C]0.078266[/C][/ROW]
[ROW][C]13[/C][C]-0.170516[/C][C]-2.4054[/C][C]0.008534[/C][/ROW]
[ROW][C]14[/C][C]-0.273132[/C][C]-3.853[/C][C]7.9e-05[/C][/ROW]
[ROW][C]15[/C][C]0.052572[/C][C]0.7416[/C][C]0.229596[/C][/ROW]
[ROW][C]16[/C][C]-0.063223[/C][C]-0.8919[/C][C]0.186771[/C][/ROW]
[ROW][C]17[/C][C]-0.054697[/C][C]-0.7716[/C][C]0.220633[/C][/ROW]
[ROW][C]18[/C][C]-0.01071[/C][C]-0.1511[/C][C]0.44003[/C][/ROW]
[ROW][C]19[/C][C]0.036762[/C][C]0.5186[/C][C]0.302311[/C][/ROW]
[ROW][C]20[/C][C]0.043537[/C][C]0.6142[/C][C]0.269904[/C][/ROW]
[ROW][C]21[/C][C]0.024271[/C][C]0.3424[/C][C]0.366209[/C][/ROW]
[ROW][C]22[/C][C]-0.139368[/C][C]-1.966[/C][C]0.025343[/C][/ROW]
[ROW][C]23[/C][C]0.132667[/C][C]1.8715[/C][C]0.031372[/C][/ROW]
[ROW][C]24[/C][C]-0.040154[/C][C]-0.5664[/C][C]0.285868[/C][/ROW]
[ROW][C]25[/C][C]-0.260383[/C][C]-3.6731[/C][C]0.000154[/C][/ROW]
[ROW][C]26[/C][C]-0.10232[/C][C]-1.4434[/C][C]0.075241[/C][/ROW]
[ROW][C]27[/C][C]-0.011555[/C][C]-0.163[/C][C]0.435341[/C][/ROW]
[ROW][C]28[/C][C]-0.008302[/C][C]-0.1171[/C][C]0.453445[/C][/ROW]
[ROW][C]29[/C][C]-0.001711[/C][C]-0.0241[/C][C]0.490384[/C][/ROW]
[ROW][C]30[/C][C]0.00044[/C][C]0.0062[/C][C]0.497526[/C][/ROW]
[ROW][C]31[/C][C]-0.088284[/C][C]-1.2454[/C][C]0.107224[/C][/ROW]
[ROW][C]32[/C][C]0.009971[/C][C]0.1407[/C][C]0.444141[/C][/ROW]
[ROW][C]33[/C][C]0.022609[/C][C]0.3189[/C][C]0.375052[/C][/ROW]
[ROW][C]34[/C][C]-0.180932[/C][C]-2.5524[/C][C]0.005725[/C][/ROW]
[ROW][C]35[/C][C]0.033202[/C][C]0.4684[/C][C]0.320017[/C][/ROW]
[ROW][C]36[/C][C]-0.052493[/C][C]-0.7405[/C][C]0.229932[/C][/ROW]
[ROW][C]37[/C][C]0.004894[/C][C]0.069[/C][C]0.472512[/C][/ROW]
[ROW][C]38[/C][C]0.010373[/C][C]0.1463[/C][C]0.441903[/C][/ROW]
[ROW][C]39[/C][C]-0.000666[/C][C]-0.0094[/C][C]0.496258[/C][/ROW]
[ROW][C]40[/C][C]-0.019047[/C][C]-0.2687[/C][C]0.394222[/C][/ROW]
[ROW][C]41[/C][C]0.069219[/C][C]0.9764[/C][C]0.165014[/C][/ROW]
[ROW][C]42[/C][C]-0.030548[/C][C]-0.4309[/C][C]0.333491[/C][/ROW]
[ROW][C]43[/C][C]-0.091605[/C][C]-1.2922[/C][C]0.098885[/C][/ROW]
[ROW][C]44[/C][C]0.031994[/C][C]0.4513[/C][C]0.32612[/C][/ROW]
[ROW][C]45[/C][C]-0.066889[/C][C]-0.9436[/C][C]0.173264[/C][/ROW]
[ROW][C]46[/C][C]0.001278[/C][C]0.018[/C][C]0.492816[/C][/ROW]
[ROW][C]47[/C][C]0.196482[/C][C]2.7717[/C][C]0.003053[/C][/ROW]
[ROW][C]48[/C][C]-0.043479[/C][C]-0.6133[/C][C]0.270174[/C][/ROW]
[ROW][C]49[/C][C]0.054555[/C][C]0.7696[/C][C]0.221226[/C][/ROW]
[ROW][C]50[/C][C]0.017357[/C][C]0.2449[/C][C]0.403411[/C][/ROW]
[ROW][C]51[/C][C]0.039334[/C][C]0.5549[/C][C]0.289801[/C][/ROW]
[ROW][C]52[/C][C]-0.119211[/C][C]-1.6817[/C][C]0.0471[/C][/ROW]
[ROW][C]53[/C][C]-0.157018[/C][C]-2.215[/C][C]0.013947[/C][/ROW]
[ROW][C]54[/C][C]0.039865[/C][C]0.5624[/C][C]0.287251[/C][/ROW]
[ROW][C]55[/C][C]0.032019[/C][C]0.4517[/C][C]0.325992[/C][/ROW]
[ROW][C]56[/C][C]-0.052127[/C][C]-0.7353[/C][C]0.231498[/C][/ROW]
[ROW][C]57[/C][C]0.04031[/C][C]0.5686[/C][C]0.28512[/C][/ROW]
[ROW][C]58[/C][C]-0.09093[/C][C]-1.2827[/C][C]0.100541[/C][/ROW]
[ROW][C]59[/C][C]-0.038554[/C][C]-0.5439[/C][C]0.293568[/C][/ROW]
[ROW][C]60[/C][C]0.094095[/C][C]1.3274[/C][C]0.092952[/C][/ROW]
[/TABLE]
Source: https://freestatistics.org/blog/index.php?pk=309423&T=2

Globally Unique Identifier (entire table): ba.freestatistics.org/blog/index.php?pk=309423&T=2

As an alternative you can also use a QR Code:  

The GUIDs for individual cells are displayed in the table below:

Partial Autocorrelation Function
Time lag kPACF(k)T-STATP-value
1-0.542537-7.65340
2-0.454433-6.41060
30.0576540.81330.208506
40.0110740.15620.43801
5-0.125617-1.7720.038959
60.1877462.64850.004367
7-0.017197-0.24260.404283
80.0351270.49550.31039
90.1396771.97040.025091
100.0076930.10850.456842
110.0887011.25130.106149
12-0.100818-1.42220.078266
13-0.170516-2.40540.008534
14-0.273132-3.8537.9e-05
150.0525720.74160.229596
16-0.063223-0.89190.186771
17-0.054697-0.77160.220633
18-0.01071-0.15110.44003
190.0367620.51860.302311
200.0435370.61420.269904
210.0242710.34240.366209
22-0.139368-1.9660.025343
230.1326671.87150.031372
24-0.040154-0.56640.285868
25-0.260383-3.67310.000154
26-0.10232-1.44340.075241
27-0.011555-0.1630.435341
28-0.008302-0.11710.453445
29-0.001711-0.02410.490384
300.000440.00620.497526
31-0.088284-1.24540.107224
320.0099710.14070.444141
330.0226090.31890.375052
34-0.180932-2.55240.005725
350.0332020.46840.320017
36-0.052493-0.74050.229932
370.0048940.0690.472512
380.0103730.14630.441903
39-0.000666-0.00940.496258
40-0.019047-0.26870.394222
410.0692190.97640.165014
42-0.030548-0.43090.333491
43-0.091605-1.29220.098885
440.0319940.45130.32612
45-0.066889-0.94360.173264
460.0012780.0180.492816
470.1964822.77170.003053
48-0.043479-0.61330.270174
490.0545550.76960.221226
500.0173570.24490.403411
510.0393340.55490.289801
52-0.119211-1.68170.0471
53-0.157018-2.2150.013947
540.0398650.56240.287251
550.0320190.45170.325992
56-0.052127-0.73530.231498
570.040310.56860.28512
58-0.09093-1.28270.100541
59-0.038554-0.54390.293568
600.0940951.32740.092952


Parameters (Session):
par1 = 60 ; par2 = 1 ; par3 = 1 ; par4 = 1 ; par5 = 12 ; par6 = White Noise ; par7 = 0.95 ;
Parameters (R input):
par1 = 60 ; par2 = 1 ; par3 = 1 ; par4 = 1 ; par5 = 12 ; par6 = White Noise ; par7 = 0.95 ; par8 = ;
R code (references can be found in the software module):
if (par1 == 'Default') {
par1 = 10*log10(length(x))
} else {
par1 <- as.numeric(par1)
}
par2 <- as.numeric(par2)
par3 <- as.numeric(par3)
par4 <- as.numeric(par4)
par5 <- as.numeric(par5)
if (par6 == 'White Noise') par6 <- 'white' else par6 <- 'ma'
par7 <- as.numeric(par7)
if (par8 != '') par8 <- as.numeric(par8)
x <- na.omit(x)
ox <- x
if (par8 == '') {
if (par2 == 0) {
x <- log(x)
} else {
x <- (x ^ par2 - 1) / par2
}
} else {
x <- log(x,base=par8)
}
if (par3 > 0) x <- diff(x,lag=1,difference=par3)
if (par4 > 0) x <- diff(x,lag=par5,difference=par4)
bitmap(file='picts.png')
op <- par(mfrow=c(2,1))
plot(ox,type='l',main='Original Time Series',xlab='time',ylab='value')
if (par8=='') {
mytitle <- paste('Working Time Series (lambda=',par2,', d=',par3,', D=',par4,')',sep='')
mysub <- paste('(lambda=',par2,', d=',par3,', D=',par4,', CI=', par7, ', CI type=',par6,')',sep='')
} else {
mytitle <- paste('Working Time Series (base=',par8,', d=',par3,', D=',par4,')',sep='')
mysub <- paste('(base=',par8,', d=',par3,', D=',par4,', CI=', par7, ', CI type=',par6,')',sep='')
}
plot(x,type='l', main=mytitle,xlab='time',ylab='value')
par(op)
dev.off()
bitmap(file='pic1.png')
racf <- acf(x, par1, main='Autocorrelation', xlab='time lag', ylab='ACF', ci.type=par6, ci=par7, sub=mysub)
dev.off()
bitmap(file='pic2.png')
rpacf <- pacf(x,par1,main='Partial Autocorrelation',xlab='lags',ylab='PACF',sub=mysub)
dev.off()
(myacf <- c(racf$acf))
(mypacf <- c(rpacf$acf))
lengthx <- length(x)
sqrtn <- sqrt(lengthx)
load(file='createtable')
a<-table.start()
a<-table.row.start(a)
a<-table.element(a,'Autocorrelation Function',4,TRUE)
a<-table.row.end(a)
a<-table.row.start(a)
a<-table.element(a,'Time lag k',header=TRUE)
a<-table.element(a,'ACF(k)',header=TRUE)
a<-table.element(a,'T-STAT',header=TRUE)
a<-table.element(a,'P-value',header=TRUE)
a<-table.row.end(a)
for (i in 2:(par1+1)) {
a<-table.row.start(a)
a<-table.element(a,i-1,header=TRUE)
a<-table.element(a,round(myacf[i],6))
mytstat <- myacf[i]*sqrtn
a<-table.element(a,round(mytstat,4))
a<-table.element(a,round(1-pt(abs(mytstat),lengthx),6))
a<-table.row.end(a)
}
a<-table.end(a)
table.save(a,file='mytable.tab')
a<-table.start()
a<-table.row.start(a)
a<-table.element(a,'Partial Autocorrelation Function',4,TRUE)
a<-table.row.end(a)
a<-table.row.start(a)
a<-table.element(a,'Time lag k',header=TRUE)
a<-table.element(a,'PACF(k)',header=TRUE)
a<-table.element(a,'T-STAT',header=TRUE)
a<-table.element(a,'P-value',header=TRUE)
a<-table.row.end(a)
for (i in 1:par1) {
a<-table.row.start(a)
a<-table.element(a,i,header=TRUE)
a<-table.element(a,round(mypacf[i],6))
mytstat <- mypacf[i]*sqrtn
a<-table.element(a,round(mytstat,4))
a<-table.element(a,round(1-pt(abs(mytstat),lengthx),6))
a<-table.row.end(a)
}
a<-table.end(a)
table.save(a,file='mytable1.tab')