Free Statistics

of Irreproducible Research!

Author's title

Author*The author of this computation has been verified*
R Software Modulerwasp_autocorrelation.wasp
Title produced by software(Partial) Autocorrelation Function
Date of computationThu, 14 Dec 2017 10:29:57 +0100
Cite this page as followsStatistical Computations at FreeStatistics.org, Office for Research Development and Education, URL https://freestatistics.org/blog/index.php?v=date/2017/Dec/14/t1513243818wxdkzung5qpto48.htm/, Retrieved Tue, 14 May 2024 11:58:53 +0000
Statistical Computations at FreeStatistics.org, Office for Research Development and Education, URL https://freestatistics.org/blog/index.php?pk=309421, Retrieved Tue, 14 May 2024 11:58:53 +0000
QR Codes:

Original text written by user:
IsPrivate?No (this computation is public)
User-defined keywords
Estimated Impact101
Family? (F = Feedback message, R = changed R code, M = changed R Module, P = changed Parameters, D = changed Data)
-       [(Partial) Autocorrelation Function] [] [2017-12-14 09:29:57] [d2d54f927b4b6a5dbf001a3c29aa1f74] [Current]
Feedback Forum

Post a new message
Dataseries X:
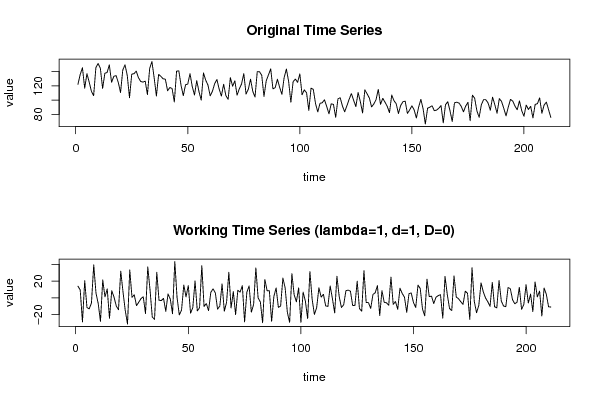
122.2
136.1
145.5
116.7
137.1
125.5
112.4
106.3
145.7
151.5
144.6
116.4
137.7
138.8
149.5
125
133.4
134.4
124.8
110.6
142.4
149.6
134.6
103.3
136.5
137.1
140.7
131.4
126.2
125.3
126.6
107.7
144.5
154.2
131.4
105.7
136.2
133.3
130
129.3
113.1
117.7
116.3
97.3
140.6
141.2
120.8
106.2
121.5
122.6
137.2
118.9
107.2
127.4
111.8
100
138.3
128
121.2
105.9
112.5
123.1
129
115.5
105.7
122.3
106.4
101.1
131.6
119.5
127
106.9
115.9
122.7
137.2
108.5
115.2
129.4
112.3
104.3
140
139.9
134.9
105.1
127
135.5
143.9
115.8
117.5
129.3
117.9
108.1
131.7
143.7
126.2
96.9
125.8
129.6
124.9
136.8
107.5
114.3
110.3
85.5
116.8
115.1
95.2
83.4
95.4
96.3
100.5
90.9
80.6
94.8
93.9
75.9
101.6
103.3
91.8
83.5
92
101.2
109.1
99.8
90.8
110.6
97.8
81.9
114.4
108.8
103.1
90.4
94.4
100.5
115.1
93.9
102.5
97.1
91.2
82.3
107.1
99.2
94.8
81.1
92.5
97.7
98.5
81.2
86.2
92
86.3
74.8
90
101.1
87.8
66.3
88.6
90
92
85.1
85.9
88.5
92.3
68
93.6
97.7
85.1
69.9
96.1
97
95.9
91.3
83.5
91.4
96.8
71
106.9
102.7
84.9
75.8
93.6
100.7
100.5
95.9
85.7
104.1
93.5
81.5
102.1
98.2
88.4
77.8
90.1
101
98.6
91.5
86.4
98.9
85.2
77.3
93
86.8
91.3
74.9
93.9
95
103.1
81.4
93.1
97.2
86.4
75.5


Summary of computational transaction
Raw Input view raw input (R code)
Raw Outputview raw output of R engine
Computing time2 seconds
R ServerBig Analytics Cloud Computing Center

\begin{tabular}{lllllllll}
\hline
Summary of computational transaction \tabularnewline
Raw Input view raw input (R code)  \tabularnewline
Raw Outputview raw output of R engine  \tabularnewline
Computing time2 seconds \tabularnewline
R ServerBig Analytics Cloud Computing Center \tabularnewline
\hline
\end{tabular}
%Source: https://freestatistics.org/blog/index.php?pk=309421&T=0

[TABLE]
[ROW]
Summary of computational transaction[/C][/ROW] [ROW]Raw Input[/C] view raw input (R code) [/C][/ROW] [ROW]Raw Output[/C]view raw output of R engine [/C][/ROW] [ROW]Computing time[/C]2 seconds[/C][/ROW] [ROW]R Server[/C]Big Analytics Cloud Computing Center[/C][/ROW] [/TABLE] Source: https://freestatistics.org/blog/index.php?pk=309421&T=0

Globally Unique Identifier (entire table): ba.freestatistics.org/blog/index.php?pk=309421&T=0

As an alternative you can also use a QR Code:  

The GUIDs for individual cells are displayed in the table below:

Summary of computational transaction
Raw Input view raw input (R code)
Raw Outputview raw output of R engine
Computing time2 seconds
R ServerBig Analytics Cloud Computing Center


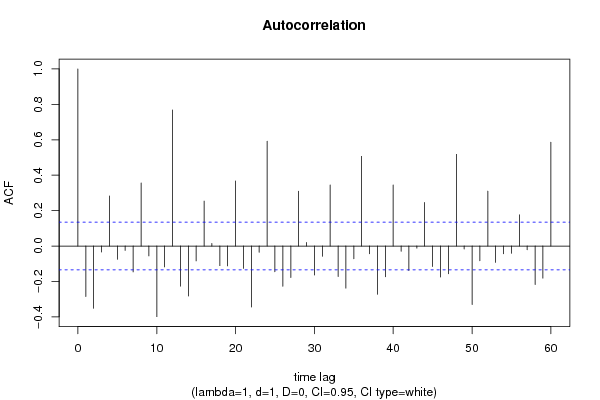
Autocorrelation Function
Time lag kACF(k)T-STATP-value
1-0.284775-4.13662.5e-05
2-0.351665-5.10820
3-0.033978-0.49360.311064
40.2828734.1092.8e-05
5-0.075249-1.0930.137809
6-0.024769-0.35980.359682
7-0.14604-2.12140.017529
80.3560055.17130
9-0.055795-0.81050.209291
10-0.398938-5.79490
11-0.117791-1.7110.044274
120.76791511.15460
13-0.226701-3.2930.000581
14-0.282561-4.10442.9e-05
15-0.08398-1.21990.111935
160.2536473.68440.000146
170.0140740.20440.419103
18-0.110682-1.60770.054693
19-0.11226-1.63070.052226
200.3674425.33740
21-0.12643-1.83650.033845
22-0.344082-4.99811e-06
23-0.035182-0.51110.304924
240.5915058.59210
25-0.14518-2.10890.018068
26-0.227116-3.2990.000569
27-0.177584-2.57960.005286
280.3092424.4926e-06
290.019880.28880.386517
30-0.163782-2.37910.009124
31-0.058107-0.84410.199797
320.3445845.00541e-06
33-0.171908-2.49710.006643
34-0.237787-3.45410.000334
35-0.072249-1.04950.147579
360.5062197.35330
37-0.0441-0.64060.261242
38-0.272002-3.95115.3e-05
39-0.17399-2.52740.006113
400.3447945.00841e-06
41-0.029832-0.43330.332605
42-0.138331-2.00940.022886
43-0.011851-0.17210.431743
440.2454463.56530.000225
45-0.116163-1.68740.046505
46-0.174954-2.54130.00588
47-0.156403-2.27190.012051
480.5175657.51810
49-0.016771-0.24360.403884
50-0.330546-4.80151e-06
51-0.083227-1.20890.114019
520.3098364.50066e-06
53-0.092307-1.34080.090707
54-0.043679-0.63450.263229
55-0.040677-0.59090.27762
560.1759062.55520.005659
57-0.021047-0.30570.380056
58-0.217847-3.16440.000892
59-0.181287-2.63330.00454
600.5855978.50630

\begin{tabular}{lllllllll}
\hline
Autocorrelation Function \tabularnewline
Time lag k & ACF(k) & T-STAT & P-value \tabularnewline
1 & -0.284775 & -4.1366 & 2.5e-05 \tabularnewline
2 & -0.351665 & -5.1082 & 0 \tabularnewline
3 & -0.033978 & -0.4936 & 0.311064 \tabularnewline
4 & 0.282873 & 4.109 & 2.8e-05 \tabularnewline
5 & -0.075249 & -1.093 & 0.137809 \tabularnewline
6 & -0.024769 & -0.3598 & 0.359682 \tabularnewline
7 & -0.14604 & -2.1214 & 0.017529 \tabularnewline
8 & 0.356005 & 5.1713 & 0 \tabularnewline
9 & -0.055795 & -0.8105 & 0.209291 \tabularnewline
10 & -0.398938 & -5.7949 & 0 \tabularnewline
11 & -0.117791 & -1.711 & 0.044274 \tabularnewline
12 & 0.767915 & 11.1546 & 0 \tabularnewline
13 & -0.226701 & -3.293 & 0.000581 \tabularnewline
14 & -0.282561 & -4.1044 & 2.9e-05 \tabularnewline
15 & -0.08398 & -1.2199 & 0.111935 \tabularnewline
16 & 0.253647 & 3.6844 & 0.000146 \tabularnewline
17 & 0.014074 & 0.2044 & 0.419103 \tabularnewline
18 & -0.110682 & -1.6077 & 0.054693 \tabularnewline
19 & -0.11226 & -1.6307 & 0.052226 \tabularnewline
20 & 0.367442 & 5.3374 & 0 \tabularnewline
21 & -0.12643 & -1.8365 & 0.033845 \tabularnewline
22 & -0.344082 & -4.9981 & 1e-06 \tabularnewline
23 & -0.035182 & -0.5111 & 0.304924 \tabularnewline
24 & 0.591505 & 8.5921 & 0 \tabularnewline
25 & -0.14518 & -2.1089 & 0.018068 \tabularnewline
26 & -0.227116 & -3.299 & 0.000569 \tabularnewline
27 & -0.177584 & -2.5796 & 0.005286 \tabularnewline
28 & 0.309242 & 4.492 & 6e-06 \tabularnewline
29 & 0.01988 & 0.2888 & 0.386517 \tabularnewline
30 & -0.163782 & -2.3791 & 0.009124 \tabularnewline
31 & -0.058107 & -0.8441 & 0.199797 \tabularnewline
32 & 0.344584 & 5.0054 & 1e-06 \tabularnewline
33 & -0.171908 & -2.4971 & 0.006643 \tabularnewline
34 & -0.237787 & -3.4541 & 0.000334 \tabularnewline
35 & -0.072249 & -1.0495 & 0.147579 \tabularnewline
36 & 0.506219 & 7.3533 & 0 \tabularnewline
37 & -0.0441 & -0.6406 & 0.261242 \tabularnewline
38 & -0.272002 & -3.9511 & 5.3e-05 \tabularnewline
39 & -0.17399 & -2.5274 & 0.006113 \tabularnewline
40 & 0.344794 & 5.0084 & 1e-06 \tabularnewline
41 & -0.029832 & -0.4333 & 0.332605 \tabularnewline
42 & -0.138331 & -2.0094 & 0.022886 \tabularnewline
43 & -0.011851 & -0.1721 & 0.431743 \tabularnewline
44 & 0.245446 & 3.5653 & 0.000225 \tabularnewline
45 & -0.116163 & -1.6874 & 0.046505 \tabularnewline
46 & -0.174954 & -2.5413 & 0.00588 \tabularnewline
47 & -0.156403 & -2.2719 & 0.012051 \tabularnewline
48 & 0.517565 & 7.5181 & 0 \tabularnewline
49 & -0.016771 & -0.2436 & 0.403884 \tabularnewline
50 & -0.330546 & -4.8015 & 1e-06 \tabularnewline
51 & -0.083227 & -1.2089 & 0.114019 \tabularnewline
52 & 0.309836 & 4.5006 & 6e-06 \tabularnewline
53 & -0.092307 & -1.3408 & 0.090707 \tabularnewline
54 & -0.043679 & -0.6345 & 0.263229 \tabularnewline
55 & -0.040677 & -0.5909 & 0.27762 \tabularnewline
56 & 0.175906 & 2.5552 & 0.005659 \tabularnewline
57 & -0.021047 & -0.3057 & 0.380056 \tabularnewline
58 & -0.217847 & -3.1644 & 0.000892 \tabularnewline
59 & -0.181287 & -2.6333 & 0.00454 \tabularnewline
60 & 0.585597 & 8.5063 & 0 \tabularnewline
\hline
\end{tabular}
%Source: https://freestatistics.org/blog/index.php?pk=309421&T=1

[TABLE]
[ROW][C]Autocorrelation Function[/C][/ROW]
[ROW][C]Time lag k[/C][C]ACF(k)[/C][C]T-STAT[/C][C]P-value[/C][/ROW]
[ROW][C]1[/C][C]-0.284775[/C][C]-4.1366[/C][C]2.5e-05[/C][/ROW]
[ROW][C]2[/C][C]-0.351665[/C][C]-5.1082[/C][C]0[/C][/ROW]
[ROW][C]3[/C][C]-0.033978[/C][C]-0.4936[/C][C]0.311064[/C][/ROW]
[ROW][C]4[/C][C]0.282873[/C][C]4.109[/C][C]2.8e-05[/C][/ROW]
[ROW][C]5[/C][C]-0.075249[/C][C]-1.093[/C][C]0.137809[/C][/ROW]
[ROW][C]6[/C][C]-0.024769[/C][C]-0.3598[/C][C]0.359682[/C][/ROW]
[ROW][C]7[/C][C]-0.14604[/C][C]-2.1214[/C][C]0.017529[/C][/ROW]
[ROW][C]8[/C][C]0.356005[/C][C]5.1713[/C][C]0[/C][/ROW]
[ROW][C]9[/C][C]-0.055795[/C][C]-0.8105[/C][C]0.209291[/C][/ROW]
[ROW][C]10[/C][C]-0.398938[/C][C]-5.7949[/C][C]0[/C][/ROW]
[ROW][C]11[/C][C]-0.117791[/C][C]-1.711[/C][C]0.044274[/C][/ROW]
[ROW][C]12[/C][C]0.767915[/C][C]11.1546[/C][C]0[/C][/ROW]
[ROW][C]13[/C][C]-0.226701[/C][C]-3.293[/C][C]0.000581[/C][/ROW]
[ROW][C]14[/C][C]-0.282561[/C][C]-4.1044[/C][C]2.9e-05[/C][/ROW]
[ROW][C]15[/C][C]-0.08398[/C][C]-1.2199[/C][C]0.111935[/C][/ROW]
[ROW][C]16[/C][C]0.253647[/C][C]3.6844[/C][C]0.000146[/C][/ROW]
[ROW][C]17[/C][C]0.014074[/C][C]0.2044[/C][C]0.419103[/C][/ROW]
[ROW][C]18[/C][C]-0.110682[/C][C]-1.6077[/C][C]0.054693[/C][/ROW]
[ROW][C]19[/C][C]-0.11226[/C][C]-1.6307[/C][C]0.052226[/C][/ROW]
[ROW][C]20[/C][C]0.367442[/C][C]5.3374[/C][C]0[/C][/ROW]
[ROW][C]21[/C][C]-0.12643[/C][C]-1.8365[/C][C]0.033845[/C][/ROW]
[ROW][C]22[/C][C]-0.344082[/C][C]-4.9981[/C][C]1e-06[/C][/ROW]
[ROW][C]23[/C][C]-0.035182[/C][C]-0.5111[/C][C]0.304924[/C][/ROW]
[ROW][C]24[/C][C]0.591505[/C][C]8.5921[/C][C]0[/C][/ROW]
[ROW][C]25[/C][C]-0.14518[/C][C]-2.1089[/C][C]0.018068[/C][/ROW]
[ROW][C]26[/C][C]-0.227116[/C][C]-3.299[/C][C]0.000569[/C][/ROW]
[ROW][C]27[/C][C]-0.177584[/C][C]-2.5796[/C][C]0.005286[/C][/ROW]
[ROW][C]28[/C][C]0.309242[/C][C]4.492[/C][C]6e-06[/C][/ROW]
[ROW][C]29[/C][C]0.01988[/C][C]0.2888[/C][C]0.386517[/C][/ROW]
[ROW][C]30[/C][C]-0.163782[/C][C]-2.3791[/C][C]0.009124[/C][/ROW]
[ROW][C]31[/C][C]-0.058107[/C][C]-0.8441[/C][C]0.199797[/C][/ROW]
[ROW][C]32[/C][C]0.344584[/C][C]5.0054[/C][C]1e-06[/C][/ROW]
[ROW][C]33[/C][C]-0.171908[/C][C]-2.4971[/C][C]0.006643[/C][/ROW]
[ROW][C]34[/C][C]-0.237787[/C][C]-3.4541[/C][C]0.000334[/C][/ROW]
[ROW][C]35[/C][C]-0.072249[/C][C]-1.0495[/C][C]0.147579[/C][/ROW]
[ROW][C]36[/C][C]0.506219[/C][C]7.3533[/C][C]0[/C][/ROW]
[ROW][C]37[/C][C]-0.0441[/C][C]-0.6406[/C][C]0.261242[/C][/ROW]
[ROW][C]38[/C][C]-0.272002[/C][C]-3.9511[/C][C]5.3e-05[/C][/ROW]
[ROW][C]39[/C][C]-0.17399[/C][C]-2.5274[/C][C]0.006113[/C][/ROW]
[ROW][C]40[/C][C]0.344794[/C][C]5.0084[/C][C]1e-06[/C][/ROW]
[ROW][C]41[/C][C]-0.029832[/C][C]-0.4333[/C][C]0.332605[/C][/ROW]
[ROW][C]42[/C][C]-0.138331[/C][C]-2.0094[/C][C]0.022886[/C][/ROW]
[ROW][C]43[/C][C]-0.011851[/C][C]-0.1721[/C][C]0.431743[/C][/ROW]
[ROW][C]44[/C][C]0.245446[/C][C]3.5653[/C][C]0.000225[/C][/ROW]
[ROW][C]45[/C][C]-0.116163[/C][C]-1.6874[/C][C]0.046505[/C][/ROW]
[ROW][C]46[/C][C]-0.174954[/C][C]-2.5413[/C][C]0.00588[/C][/ROW]
[ROW][C]47[/C][C]-0.156403[/C][C]-2.2719[/C][C]0.012051[/C][/ROW]
[ROW][C]48[/C][C]0.517565[/C][C]7.5181[/C][C]0[/C][/ROW]
[ROW][C]49[/C][C]-0.016771[/C][C]-0.2436[/C][C]0.403884[/C][/ROW]
[ROW][C]50[/C][C]-0.330546[/C][C]-4.8015[/C][C]1e-06[/C][/ROW]
[ROW][C]51[/C][C]-0.083227[/C][C]-1.2089[/C][C]0.114019[/C][/ROW]
[ROW][C]52[/C][C]0.309836[/C][C]4.5006[/C][C]6e-06[/C][/ROW]
[ROW][C]53[/C][C]-0.092307[/C][C]-1.3408[/C][C]0.090707[/C][/ROW]
[ROW][C]54[/C][C]-0.043679[/C][C]-0.6345[/C][C]0.263229[/C][/ROW]
[ROW][C]55[/C][C]-0.040677[/C][C]-0.5909[/C][C]0.27762[/C][/ROW]
[ROW][C]56[/C][C]0.175906[/C][C]2.5552[/C][C]0.005659[/C][/ROW]
[ROW][C]57[/C][C]-0.021047[/C][C]-0.3057[/C][C]0.380056[/C][/ROW]
[ROW][C]58[/C][C]-0.217847[/C][C]-3.1644[/C][C]0.000892[/C][/ROW]
[ROW][C]59[/C][C]-0.181287[/C][C]-2.6333[/C][C]0.00454[/C][/ROW]
[ROW][C]60[/C][C]0.585597[/C][C]8.5063[/C][C]0[/C][/ROW]
[/TABLE]
Source: https://freestatistics.org/blog/index.php?pk=309421&T=1

Globally Unique Identifier (entire table): ba.freestatistics.org/blog/index.php?pk=309421&T=1

As an alternative you can also use a QR Code:  

The GUIDs for individual cells are displayed in the table below:

Autocorrelation Function
Time lag kACF(k)T-STATP-value
1-0.284775-4.13662.5e-05
2-0.351665-5.10820
3-0.033978-0.49360.311064
40.2828734.1092.8e-05
5-0.075249-1.0930.137809
6-0.024769-0.35980.359682
7-0.14604-2.12140.017529
80.3560055.17130
9-0.055795-0.81050.209291
10-0.398938-5.79490
11-0.117791-1.7110.044274
120.76791511.15460
13-0.226701-3.2930.000581
14-0.282561-4.10442.9e-05
15-0.08398-1.21990.111935
160.2536473.68440.000146
170.0140740.20440.419103
18-0.110682-1.60770.054693
19-0.11226-1.63070.052226
200.3674425.33740
21-0.12643-1.83650.033845
22-0.344082-4.99811e-06
23-0.035182-0.51110.304924
240.5915058.59210
25-0.14518-2.10890.018068
26-0.227116-3.2990.000569
27-0.177584-2.57960.005286
280.3092424.4926e-06
290.019880.28880.386517
30-0.163782-2.37910.009124
31-0.058107-0.84410.199797
320.3445845.00541e-06
33-0.171908-2.49710.006643
34-0.237787-3.45410.000334
35-0.072249-1.04950.147579
360.5062197.35330
37-0.0441-0.64060.261242
38-0.272002-3.95115.3e-05
39-0.17399-2.52740.006113
400.3447945.00841e-06
41-0.029832-0.43330.332605
42-0.138331-2.00940.022886
43-0.011851-0.17210.431743
440.2454463.56530.000225
45-0.116163-1.68740.046505
46-0.174954-2.54130.00588
47-0.156403-2.27190.012051
480.5175657.51810
49-0.016771-0.24360.403884
50-0.330546-4.80151e-06
51-0.083227-1.20890.114019
520.3098364.50066e-06
53-0.092307-1.34080.090707
54-0.043679-0.63450.263229
55-0.040677-0.59090.27762
560.1759062.55520.005659
57-0.021047-0.30570.380056
58-0.217847-3.16440.000892
59-0.181287-2.63330.00454
600.5855978.50630


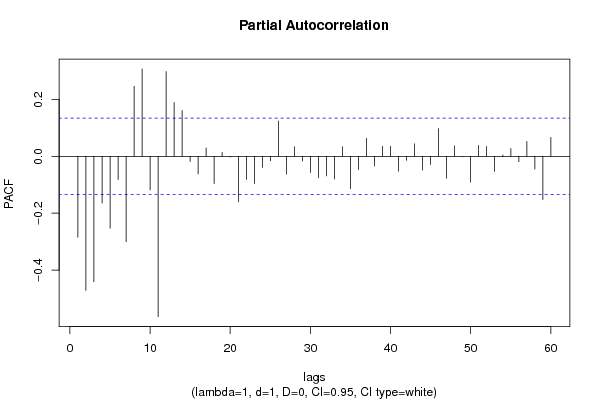
Partial Autocorrelation Function
Time lag kPACF(k)T-STATP-value
1-0.284775-4.13662.5e-05
2-0.470955-6.8410
3-0.441068-6.40690
4-0.164269-2.38620.008955
5-0.252531-3.66820.000155
6-0.08096-1.1760.120457
7-0.300164-4.36011e-05
80.2467243.58390.00021
90.3074644.46626e-06
10-0.117756-1.71050.044322
11-0.563672-8.18780
120.2980234.3291.2e-05
130.1895182.75290.003211
140.1611222.34040.010098
15-0.017808-0.25870.398068
16-0.06166-0.89570.185726
170.0295880.42980.333895
18-0.095193-1.38280.0841
190.0139420.20250.419856
20-0.002382-0.03460.486213
21-0.159332-2.31440.010803
22-0.080188-1.16480.122709
23-0.09555-1.38790.083308
24-0.038843-0.56420.286597
25-0.015429-0.22410.411443
260.123991.80110.036561
27-0.062577-0.9090.182197
280.0340780.4950.310555
29-0.016296-0.23670.406553
30-0.056495-0.82060.206389
31-0.07465-1.08440.139722
32-0.068671-0.99750.15983
33-0.079183-1.15020.125683
340.0335980.4880.313015
35-0.114173-1.65850.049356
36-0.0459-0.66670.252836
370.0639990.92960.176809
38-0.033933-0.49290.311297
390.0359020.52150.301281
400.035810.52020.301743
41-0.051909-0.7540.225839
42-0.0136-0.19760.421792
430.0438970.63760.2622
44-0.048159-0.69960.242489
45-0.028753-0.41770.33831
460.0974981.41620.079089
47-0.076437-1.11030.134066
480.0368850.53580.296333
49-0.001085-0.01580.493718
50-0.090737-1.3180.09446
510.0380130.55220.290708
520.0349310.50740.3062
53-0.05224-0.75880.2244
540.004480.06510.474089
550.0273470.39720.345794
56-0.018446-0.26790.3945
570.0521010.75680.225005
58-0.044596-0.64780.25891
59-0.151737-2.20410.014299
600.0663940.96440.167967

\begin{tabular}{lllllllll}
\hline
Partial Autocorrelation Function \tabularnewline
Time lag k & PACF(k) & T-STAT & P-value \tabularnewline
1 & -0.284775 & -4.1366 & 2.5e-05 \tabularnewline
2 & -0.470955 & -6.841 & 0 \tabularnewline
3 & -0.441068 & -6.4069 & 0 \tabularnewline
4 & -0.164269 & -2.3862 & 0.008955 \tabularnewline
5 & -0.252531 & -3.6682 & 0.000155 \tabularnewline
6 & -0.08096 & -1.176 & 0.120457 \tabularnewline
7 & -0.300164 & -4.3601 & 1e-05 \tabularnewline
8 & 0.246724 & 3.5839 & 0.00021 \tabularnewline
9 & 0.307464 & 4.4662 & 6e-06 \tabularnewline
10 & -0.117756 & -1.7105 & 0.044322 \tabularnewline
11 & -0.563672 & -8.1878 & 0 \tabularnewline
12 & 0.298023 & 4.329 & 1.2e-05 \tabularnewline
13 & 0.189518 & 2.7529 & 0.003211 \tabularnewline
14 & 0.161122 & 2.3404 & 0.010098 \tabularnewline
15 & -0.017808 & -0.2587 & 0.398068 \tabularnewline
16 & -0.06166 & -0.8957 & 0.185726 \tabularnewline
17 & 0.029588 & 0.4298 & 0.333895 \tabularnewline
18 & -0.095193 & -1.3828 & 0.0841 \tabularnewline
19 & 0.013942 & 0.2025 & 0.419856 \tabularnewline
20 & -0.002382 & -0.0346 & 0.486213 \tabularnewline
21 & -0.159332 & -2.3144 & 0.010803 \tabularnewline
22 & -0.080188 & -1.1648 & 0.122709 \tabularnewline
23 & -0.09555 & -1.3879 & 0.083308 \tabularnewline
24 & -0.038843 & -0.5642 & 0.286597 \tabularnewline
25 & -0.015429 & -0.2241 & 0.411443 \tabularnewline
26 & 0.12399 & 1.8011 & 0.036561 \tabularnewline
27 & -0.062577 & -0.909 & 0.182197 \tabularnewline
28 & 0.034078 & 0.495 & 0.310555 \tabularnewline
29 & -0.016296 & -0.2367 & 0.406553 \tabularnewline
30 & -0.056495 & -0.8206 & 0.206389 \tabularnewline
31 & -0.07465 & -1.0844 & 0.139722 \tabularnewline
32 & -0.068671 & -0.9975 & 0.15983 \tabularnewline
33 & -0.079183 & -1.1502 & 0.125683 \tabularnewline
34 & 0.033598 & 0.488 & 0.313015 \tabularnewline
35 & -0.114173 & -1.6585 & 0.049356 \tabularnewline
36 & -0.0459 & -0.6667 & 0.252836 \tabularnewline
37 & 0.063999 & 0.9296 & 0.176809 \tabularnewline
38 & -0.033933 & -0.4929 & 0.311297 \tabularnewline
39 & 0.035902 & 0.5215 & 0.301281 \tabularnewline
40 & 0.03581 & 0.5202 & 0.301743 \tabularnewline
41 & -0.051909 & -0.754 & 0.225839 \tabularnewline
42 & -0.0136 & -0.1976 & 0.421792 \tabularnewline
43 & 0.043897 & 0.6376 & 0.2622 \tabularnewline
44 & -0.048159 & -0.6996 & 0.242489 \tabularnewline
45 & -0.028753 & -0.4177 & 0.33831 \tabularnewline
46 & 0.097498 & 1.4162 & 0.079089 \tabularnewline
47 & -0.076437 & -1.1103 & 0.134066 \tabularnewline
48 & 0.036885 & 0.5358 & 0.296333 \tabularnewline
49 & -0.001085 & -0.0158 & 0.493718 \tabularnewline
50 & -0.090737 & -1.318 & 0.09446 \tabularnewline
51 & 0.038013 & 0.5522 & 0.290708 \tabularnewline
52 & 0.034931 & 0.5074 & 0.3062 \tabularnewline
53 & -0.05224 & -0.7588 & 0.2244 \tabularnewline
54 & 0.00448 & 0.0651 & 0.474089 \tabularnewline
55 & 0.027347 & 0.3972 & 0.345794 \tabularnewline
56 & -0.018446 & -0.2679 & 0.3945 \tabularnewline
57 & 0.052101 & 0.7568 & 0.225005 \tabularnewline
58 & -0.044596 & -0.6478 & 0.25891 \tabularnewline
59 & -0.151737 & -2.2041 & 0.014299 \tabularnewline
60 & 0.066394 & 0.9644 & 0.167967 \tabularnewline
\hline
\end{tabular}
%Source: https://freestatistics.org/blog/index.php?pk=309421&T=2

[TABLE]
[ROW][C]Partial Autocorrelation Function[/C][/ROW]
[ROW][C]Time lag k[/C][C]PACF(k)[/C][C]T-STAT[/C][C]P-value[/C][/ROW]
[ROW][C]1[/C][C]-0.284775[/C][C]-4.1366[/C][C]2.5e-05[/C][/ROW]
[ROW][C]2[/C][C]-0.470955[/C][C]-6.841[/C][C]0[/C][/ROW]
[ROW][C]3[/C][C]-0.441068[/C][C]-6.4069[/C][C]0[/C][/ROW]
[ROW][C]4[/C][C]-0.164269[/C][C]-2.3862[/C][C]0.008955[/C][/ROW]
[ROW][C]5[/C][C]-0.252531[/C][C]-3.6682[/C][C]0.000155[/C][/ROW]
[ROW][C]6[/C][C]-0.08096[/C][C]-1.176[/C][C]0.120457[/C][/ROW]
[ROW][C]7[/C][C]-0.300164[/C][C]-4.3601[/C][C]1e-05[/C][/ROW]
[ROW][C]8[/C][C]0.246724[/C][C]3.5839[/C][C]0.00021[/C][/ROW]
[ROW][C]9[/C][C]0.307464[/C][C]4.4662[/C][C]6e-06[/C][/ROW]
[ROW][C]10[/C][C]-0.117756[/C][C]-1.7105[/C][C]0.044322[/C][/ROW]
[ROW][C]11[/C][C]-0.563672[/C][C]-8.1878[/C][C]0[/C][/ROW]
[ROW][C]12[/C][C]0.298023[/C][C]4.329[/C][C]1.2e-05[/C][/ROW]
[ROW][C]13[/C][C]0.189518[/C][C]2.7529[/C][C]0.003211[/C][/ROW]
[ROW][C]14[/C][C]0.161122[/C][C]2.3404[/C][C]0.010098[/C][/ROW]
[ROW][C]15[/C][C]-0.017808[/C][C]-0.2587[/C][C]0.398068[/C][/ROW]
[ROW][C]16[/C][C]-0.06166[/C][C]-0.8957[/C][C]0.185726[/C][/ROW]
[ROW][C]17[/C][C]0.029588[/C][C]0.4298[/C][C]0.333895[/C][/ROW]
[ROW][C]18[/C][C]-0.095193[/C][C]-1.3828[/C][C]0.0841[/C][/ROW]
[ROW][C]19[/C][C]0.013942[/C][C]0.2025[/C][C]0.419856[/C][/ROW]
[ROW][C]20[/C][C]-0.002382[/C][C]-0.0346[/C][C]0.486213[/C][/ROW]
[ROW][C]21[/C][C]-0.159332[/C][C]-2.3144[/C][C]0.010803[/C][/ROW]
[ROW][C]22[/C][C]-0.080188[/C][C]-1.1648[/C][C]0.122709[/C][/ROW]
[ROW][C]23[/C][C]-0.09555[/C][C]-1.3879[/C][C]0.083308[/C][/ROW]
[ROW][C]24[/C][C]-0.038843[/C][C]-0.5642[/C][C]0.286597[/C][/ROW]
[ROW][C]25[/C][C]-0.015429[/C][C]-0.2241[/C][C]0.411443[/C][/ROW]
[ROW][C]26[/C][C]0.12399[/C][C]1.8011[/C][C]0.036561[/C][/ROW]
[ROW][C]27[/C][C]-0.062577[/C][C]-0.909[/C][C]0.182197[/C][/ROW]
[ROW][C]28[/C][C]0.034078[/C][C]0.495[/C][C]0.310555[/C][/ROW]
[ROW][C]29[/C][C]-0.016296[/C][C]-0.2367[/C][C]0.406553[/C][/ROW]
[ROW][C]30[/C][C]-0.056495[/C][C]-0.8206[/C][C]0.206389[/C][/ROW]
[ROW][C]31[/C][C]-0.07465[/C][C]-1.0844[/C][C]0.139722[/C][/ROW]
[ROW][C]32[/C][C]-0.068671[/C][C]-0.9975[/C][C]0.15983[/C][/ROW]
[ROW][C]33[/C][C]-0.079183[/C][C]-1.1502[/C][C]0.125683[/C][/ROW]
[ROW][C]34[/C][C]0.033598[/C][C]0.488[/C][C]0.313015[/C][/ROW]
[ROW][C]35[/C][C]-0.114173[/C][C]-1.6585[/C][C]0.049356[/C][/ROW]
[ROW][C]36[/C][C]-0.0459[/C][C]-0.6667[/C][C]0.252836[/C][/ROW]
[ROW][C]37[/C][C]0.063999[/C][C]0.9296[/C][C]0.176809[/C][/ROW]
[ROW][C]38[/C][C]-0.033933[/C][C]-0.4929[/C][C]0.311297[/C][/ROW]
[ROW][C]39[/C][C]0.035902[/C][C]0.5215[/C][C]0.301281[/C][/ROW]
[ROW][C]40[/C][C]0.03581[/C][C]0.5202[/C][C]0.301743[/C][/ROW]
[ROW][C]41[/C][C]-0.051909[/C][C]-0.754[/C][C]0.225839[/C][/ROW]
[ROW][C]42[/C][C]-0.0136[/C][C]-0.1976[/C][C]0.421792[/C][/ROW]
[ROW][C]43[/C][C]0.043897[/C][C]0.6376[/C][C]0.2622[/C][/ROW]
[ROW][C]44[/C][C]-0.048159[/C][C]-0.6996[/C][C]0.242489[/C][/ROW]
[ROW][C]45[/C][C]-0.028753[/C][C]-0.4177[/C][C]0.33831[/C][/ROW]
[ROW][C]46[/C][C]0.097498[/C][C]1.4162[/C][C]0.079089[/C][/ROW]
[ROW][C]47[/C][C]-0.076437[/C][C]-1.1103[/C][C]0.134066[/C][/ROW]
[ROW][C]48[/C][C]0.036885[/C][C]0.5358[/C][C]0.296333[/C][/ROW]
[ROW][C]49[/C][C]-0.001085[/C][C]-0.0158[/C][C]0.493718[/C][/ROW]
[ROW][C]50[/C][C]-0.090737[/C][C]-1.318[/C][C]0.09446[/C][/ROW]
[ROW][C]51[/C][C]0.038013[/C][C]0.5522[/C][C]0.290708[/C][/ROW]
[ROW][C]52[/C][C]0.034931[/C][C]0.5074[/C][C]0.3062[/C][/ROW]
[ROW][C]53[/C][C]-0.05224[/C][C]-0.7588[/C][C]0.2244[/C][/ROW]
[ROW][C]54[/C][C]0.00448[/C][C]0.0651[/C][C]0.474089[/C][/ROW]
[ROW][C]55[/C][C]0.027347[/C][C]0.3972[/C][C]0.345794[/C][/ROW]
[ROW][C]56[/C][C]-0.018446[/C][C]-0.2679[/C][C]0.3945[/C][/ROW]
[ROW][C]57[/C][C]0.052101[/C][C]0.7568[/C][C]0.225005[/C][/ROW]
[ROW][C]58[/C][C]-0.044596[/C][C]-0.6478[/C][C]0.25891[/C][/ROW]
[ROW][C]59[/C][C]-0.151737[/C][C]-2.2041[/C][C]0.014299[/C][/ROW]
[ROW][C]60[/C][C]0.066394[/C][C]0.9644[/C][C]0.167967[/C][/ROW]
[/TABLE]
Source: https://freestatistics.org/blog/index.php?pk=309421&T=2

Globally Unique Identifier (entire table): ba.freestatistics.org/blog/index.php?pk=309421&T=2

As an alternative you can also use a QR Code:  

The GUIDs for individual cells are displayed in the table below:

Partial Autocorrelation Function
Time lag kPACF(k)T-STATP-value
1-0.284775-4.13662.5e-05
2-0.470955-6.8410
3-0.441068-6.40690
4-0.164269-2.38620.008955
5-0.252531-3.66820.000155
6-0.08096-1.1760.120457
7-0.300164-4.36011e-05
80.2467243.58390.00021
90.3074644.46626e-06
10-0.117756-1.71050.044322
11-0.563672-8.18780
120.2980234.3291.2e-05
130.1895182.75290.003211
140.1611222.34040.010098
15-0.017808-0.25870.398068
16-0.06166-0.89570.185726
170.0295880.42980.333895
18-0.095193-1.38280.0841
190.0139420.20250.419856
20-0.002382-0.03460.486213
21-0.159332-2.31440.010803
22-0.080188-1.16480.122709
23-0.09555-1.38790.083308
24-0.038843-0.56420.286597
25-0.015429-0.22410.411443
260.123991.80110.036561
27-0.062577-0.9090.182197
280.0340780.4950.310555
29-0.016296-0.23670.406553
30-0.056495-0.82060.206389
31-0.07465-1.08440.139722
32-0.068671-0.99750.15983
33-0.079183-1.15020.125683
340.0335980.4880.313015
35-0.114173-1.65850.049356
36-0.0459-0.66670.252836
370.0639990.92960.176809
38-0.033933-0.49290.311297
390.0359020.52150.301281
400.035810.52020.301743
41-0.051909-0.7540.225839
42-0.0136-0.19760.421792
430.0438970.63760.2622
44-0.048159-0.69960.242489
45-0.028753-0.41770.33831
460.0974981.41620.079089
47-0.076437-1.11030.134066
480.0368850.53580.296333
49-0.001085-0.01580.493718
50-0.090737-1.3180.09446
510.0380130.55220.290708
520.0349310.50740.3062
53-0.05224-0.75880.2244
540.004480.06510.474089
550.0273470.39720.345794
56-0.018446-0.26790.3945
570.0521010.75680.225005
58-0.044596-0.64780.25891
59-0.151737-2.20410.014299
600.0663940.96440.167967


Parameters (Session):
par1 = 60 ; par2 = 1 ; par3 = 1 ; par4 = 0 ; par5 = 12 ; par6 = White Noise ; par7 = 0.95 ;
Parameters (R input):
par1 = 60 ; par2 = 1 ; par3 = 1 ; par4 = 0 ; par5 = 12 ; par6 = White Noise ; par7 = 0.95 ; par8 = ;
R code (references can be found in the software module):
if (par1 == 'Default') {
par1 = 10*log10(length(x))
} else {
par1 <- as.numeric(par1)
}
par2 <- as.numeric(par2)
par3 <- as.numeric(par3)
par4 <- as.numeric(par4)
par5 <- as.numeric(par5)
if (par6 == 'White Noise') par6 <- 'white' else par6 <- 'ma'
par7 <- as.numeric(par7)
if (par8 != '') par8 <- as.numeric(par8)
x <- na.omit(x)
ox <- x
if (par8 == '') {
if (par2 == 0) {
x <- log(x)
} else {
x <- (x ^ par2 - 1) / par2
}
} else {
x <- log(x,base=par8)
}
if (par3 > 0) x <- diff(x,lag=1,difference=par3)
if (par4 > 0) x <- diff(x,lag=par5,difference=par4)
bitmap(file='picts.png')
op <- par(mfrow=c(2,1))
plot(ox,type='l',main='Original Time Series',xlab='time',ylab='value')
if (par8=='') {
mytitle <- paste('Working Time Series (lambda=',par2,', d=',par3,', D=',par4,')',sep='')
mysub <- paste('(lambda=',par2,', d=',par3,', D=',par4,', CI=', par7, ', CI type=',par6,')',sep='')
} else {
mytitle <- paste('Working Time Series (base=',par8,', d=',par3,', D=',par4,')',sep='')
mysub <- paste('(base=',par8,', d=',par3,', D=',par4,', CI=', par7, ', CI type=',par6,')',sep='')
}
plot(x,type='l', main=mytitle,xlab='time',ylab='value')
par(op)
dev.off()
bitmap(file='pic1.png')
racf <- acf(x, par1, main='Autocorrelation', xlab='time lag', ylab='ACF', ci.type=par6, ci=par7, sub=mysub)
dev.off()
bitmap(file='pic2.png')
rpacf <- pacf(x,par1,main='Partial Autocorrelation',xlab='lags',ylab='PACF',sub=mysub)
dev.off()
(myacf <- c(racf$acf))
(mypacf <- c(rpacf$acf))
lengthx <- length(x)
sqrtn <- sqrt(lengthx)
load(file='createtable')
a<-table.start()
a<-table.row.start(a)
a<-table.element(a,'Autocorrelation Function',4,TRUE)
a<-table.row.end(a)
a<-table.row.start(a)
a<-table.element(a,'Time lag k',header=TRUE)
a<-table.element(a,'ACF(k)',header=TRUE)
a<-table.element(a,'T-STAT',header=TRUE)
a<-table.element(a,'P-value',header=TRUE)
a<-table.row.end(a)
for (i in 2:(par1+1)) {
a<-table.row.start(a)
a<-table.element(a,i-1,header=TRUE)
a<-table.element(a,round(myacf[i],6))
mytstat <- myacf[i]*sqrtn
a<-table.element(a,round(mytstat,4))
a<-table.element(a,round(1-pt(abs(mytstat),lengthx),6))
a<-table.row.end(a)
}
a<-table.end(a)
table.save(a,file='mytable.tab')
a<-table.start()
a<-table.row.start(a)
a<-table.element(a,'Partial Autocorrelation Function',4,TRUE)
a<-table.row.end(a)
a<-table.row.start(a)
a<-table.element(a,'Time lag k',header=TRUE)
a<-table.element(a,'PACF(k)',header=TRUE)
a<-table.element(a,'T-STAT',header=TRUE)
a<-table.element(a,'P-value',header=TRUE)
a<-table.row.end(a)
for (i in 1:par1) {
a<-table.row.start(a)
a<-table.element(a,i,header=TRUE)
a<-table.element(a,round(mypacf[i],6))
mytstat <- mypacf[i]*sqrtn
a<-table.element(a,round(mytstat,4))
a<-table.element(a,round(1-pt(abs(mytstat),lengthx),6))
a<-table.row.end(a)
}
a<-table.end(a)
table.save(a,file='mytable1.tab')