Free Statistics

of Irreproducible Research!

Author's title

Author*The author of this computation has been verified*
R Software Modulerwasp_autocorrelation.wasp
Title produced by software(Partial) Autocorrelation Function
Date of computationThu, 14 Dec 2017 10:24:50 +0100
Cite this page as followsStatistical Computations at FreeStatistics.org, Office for Research Development and Education, URL https://freestatistics.org/blog/index.php?v=date/2017/Dec/14/t1513243545d9h4cbol8pvnl39.htm/, Retrieved Tue, 14 May 2024 18:11:19 +0000
Statistical Computations at FreeStatistics.org, Office for Research Development and Education, URL https://freestatistics.org/blog/index.php?pk=309418, Retrieved Tue, 14 May 2024 18:11:19 +0000
QR Codes:

Original text written by user:
IsPrivate?No (this computation is public)
User-defined keywords
Estimated Impact86
Family? (F = Feedback message, R = changed R code, M = changed R Module, P = changed Parameters, D = changed Data)
-       [(Partial) Autocorrelation Function] [autocorrelatie fu...] [2017-12-14 09:24:50] [5c76e56d84d1440d36aad135bd2f9339] [Current]
Feedback Forum

Post a new message
Dataseries X:
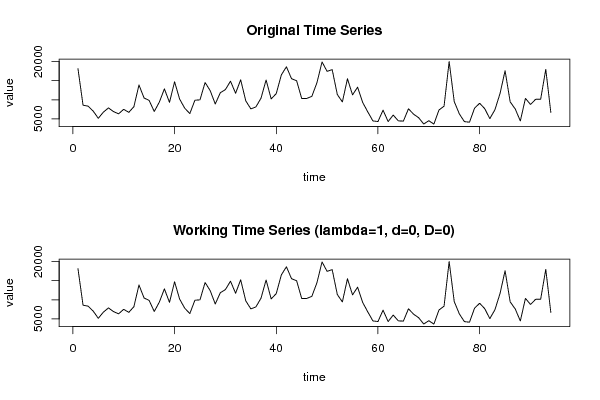
18142
8613
8347
7054
5179
6785
7887
6926
6355
7533
6727
8215
13880
10484
9847
6952
9393
12870
9330
14726
10176.66667
7815
6419
9900
9999.833333
14523
12419
8923
11857
12676
14873
11711
15243
9751
7631
8161
10435
15188
10237
11642
16513
18632
15526
14991
10365
10369
10912
14476.83333
19891
17448
17876
11414
9452
15509
11286
13318
9298.833333
6850
4497
4333
7301
4323
6033
4513
4442
7666
6260
5339
3686
4549
3675
7356
8341
20001
9554
6334
4313
4161
7835
9109
7691
5091
7407
11632
17611
9481
7603
4485
10381
8796
10132
10163
17969
6695


Summary of computational transaction
Raw Input view raw input (R code)
Raw Outputview raw output of R engine
Computing time1 seconds
R ServerBig Analytics Cloud Computing Center

\begin{tabular}{lllllllll}
\hline
Summary of computational transaction \tabularnewline
Raw Input view raw input (R code)  \tabularnewline
Raw Outputview raw output of R engine  \tabularnewline
Computing time1 seconds \tabularnewline
R ServerBig Analytics Cloud Computing Center \tabularnewline
\hline
\end{tabular}
%Source: https://freestatistics.org/blog/index.php?pk=309418&T=0

[TABLE]
[ROW]
Summary of computational transaction[/C][/ROW] [ROW]Raw Input[/C] view raw input (R code) [/C][/ROW] [ROW]Raw Output[/C]view raw output of R engine [/C][/ROW] [ROW]Computing time[/C]1 seconds[/C][/ROW] [ROW]R Server[/C]Big Analytics Cloud Computing Center[/C][/ROW] [/TABLE] Source: https://freestatistics.org/blog/index.php?pk=309418&T=0

Globally Unique Identifier (entire table): ba.freestatistics.org/blog/index.php?pk=309418&T=0

As an alternative you can also use a QR Code:  

The GUIDs for individual cells are displayed in the table below:

Summary of computational transaction
Raw Input view raw input (R code)
Raw Outputview raw output of R engine
Computing time1 seconds
R ServerBig Analytics Cloud Computing Center


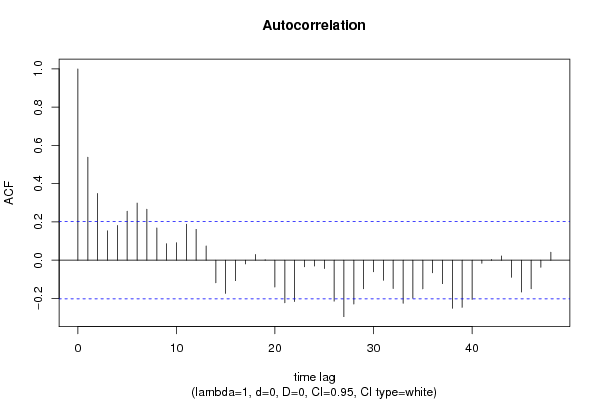
Autocorrelation Function
Time lag kACF(k)T-STATP-value
10.5381375.21741e-06
20.3490443.38410.000521
30.1532591.48590.070325
40.1813141.75790.04101
50.2563562.48550.007353
60.2983262.89240.002375
70.2663672.58250.005676
80.1685651.63430.052771
90.0861350.83510.202888
100.0908690.8810.190282
110.1878321.82110.035886
120.1611061.5620.060827
130.0740990.71840.237141
14-0.118266-1.14660.127222
15-0.173563-1.68280.047871
16-0.107039-1.03780.151016
17-0.01921-0.18620.426326
180.0294510.28550.387928
190.0028130.02730.48915
20-0.139859-1.3560.089177
21-0.222235-2.15460.016873
22-0.215663-2.09090.019616
23-0.034625-0.33570.368921
24-0.030578-0.29650.383765
25-0.043374-0.42050.337532
26-0.214119-2.0760.020314
27-0.295195-2.8620.002594
28-0.228815-2.21840.014466
29-0.149127-1.44580.075773
30-0.060234-0.5840.280313
31-0.104645-1.01460.156457
32-0.147691-1.43190.077742
33-0.224965-2.18110.015835
34-0.198454-1.92410.028685
35-0.149829-1.45260.074827
36-0.065416-0.63420.263734
37-0.122706-1.18970.118585
38-0.251403-2.43740.008336
39-0.246544-2.39030.009414
40-0.204919-1.98680.02493
41-0.01626-0.15760.437537
420.0038040.03690.48533
430.0216370.20980.417149
44-0.089078-0.86360.194991
45-0.166385-1.61320.05503
46-0.148976-1.44440.075979
47-0.036888-0.35760.360707
480.0418350.40560.342978

\begin{tabular}{lllllllll}
\hline
Autocorrelation Function \tabularnewline
Time lag k & ACF(k) & T-STAT & P-value \tabularnewline
1 & 0.538137 & 5.2174 & 1e-06 \tabularnewline
2 & 0.349044 & 3.3841 & 0.000521 \tabularnewline
3 & 0.153259 & 1.4859 & 0.070325 \tabularnewline
4 & 0.181314 & 1.7579 & 0.04101 \tabularnewline
5 & 0.256356 & 2.4855 & 0.007353 \tabularnewline
6 & 0.298326 & 2.8924 & 0.002375 \tabularnewline
7 & 0.266367 & 2.5825 & 0.005676 \tabularnewline
8 & 0.168565 & 1.6343 & 0.052771 \tabularnewline
9 & 0.086135 & 0.8351 & 0.202888 \tabularnewline
10 & 0.090869 & 0.881 & 0.190282 \tabularnewline
11 & 0.187832 & 1.8211 & 0.035886 \tabularnewline
12 & 0.161106 & 1.562 & 0.060827 \tabularnewline
13 & 0.074099 & 0.7184 & 0.237141 \tabularnewline
14 & -0.118266 & -1.1466 & 0.127222 \tabularnewline
15 & -0.173563 & -1.6828 & 0.047871 \tabularnewline
16 & -0.107039 & -1.0378 & 0.151016 \tabularnewline
17 & -0.01921 & -0.1862 & 0.426326 \tabularnewline
18 & 0.029451 & 0.2855 & 0.387928 \tabularnewline
19 & 0.002813 & 0.0273 & 0.48915 \tabularnewline
20 & -0.139859 & -1.356 & 0.089177 \tabularnewline
21 & -0.222235 & -2.1546 & 0.016873 \tabularnewline
22 & -0.215663 & -2.0909 & 0.019616 \tabularnewline
23 & -0.034625 & -0.3357 & 0.368921 \tabularnewline
24 & -0.030578 & -0.2965 & 0.383765 \tabularnewline
25 & -0.043374 & -0.4205 & 0.337532 \tabularnewline
26 & -0.214119 & -2.076 & 0.020314 \tabularnewline
27 & -0.295195 & -2.862 & 0.002594 \tabularnewline
28 & -0.228815 & -2.2184 & 0.014466 \tabularnewline
29 & -0.149127 & -1.4458 & 0.075773 \tabularnewline
30 & -0.060234 & -0.584 & 0.280313 \tabularnewline
31 & -0.104645 & -1.0146 & 0.156457 \tabularnewline
32 & -0.147691 & -1.4319 & 0.077742 \tabularnewline
33 & -0.224965 & -2.1811 & 0.015835 \tabularnewline
34 & -0.198454 & -1.9241 & 0.028685 \tabularnewline
35 & -0.149829 & -1.4526 & 0.074827 \tabularnewline
36 & -0.065416 & -0.6342 & 0.263734 \tabularnewline
37 & -0.122706 & -1.1897 & 0.118585 \tabularnewline
38 & -0.251403 & -2.4374 & 0.008336 \tabularnewline
39 & -0.246544 & -2.3903 & 0.009414 \tabularnewline
40 & -0.204919 & -1.9868 & 0.02493 \tabularnewline
41 & -0.01626 & -0.1576 & 0.437537 \tabularnewline
42 & 0.003804 & 0.0369 & 0.48533 \tabularnewline
43 & 0.021637 & 0.2098 & 0.417149 \tabularnewline
44 & -0.089078 & -0.8636 & 0.194991 \tabularnewline
45 & -0.166385 & -1.6132 & 0.05503 \tabularnewline
46 & -0.148976 & -1.4444 & 0.075979 \tabularnewline
47 & -0.036888 & -0.3576 & 0.360707 \tabularnewline
48 & 0.041835 & 0.4056 & 0.342978 \tabularnewline
\hline
\end{tabular}
%Source: https://freestatistics.org/blog/index.php?pk=309418&T=1

[TABLE]
[ROW][C]Autocorrelation Function[/C][/ROW]
[ROW][C]Time lag k[/C][C]ACF(k)[/C][C]T-STAT[/C][C]P-value[/C][/ROW]
[ROW][C]1[/C][C]0.538137[/C][C]5.2174[/C][C]1e-06[/C][/ROW]
[ROW][C]2[/C][C]0.349044[/C][C]3.3841[/C][C]0.000521[/C][/ROW]
[ROW][C]3[/C][C]0.153259[/C][C]1.4859[/C][C]0.070325[/C][/ROW]
[ROW][C]4[/C][C]0.181314[/C][C]1.7579[/C][C]0.04101[/C][/ROW]
[ROW][C]5[/C][C]0.256356[/C][C]2.4855[/C][C]0.007353[/C][/ROW]
[ROW][C]6[/C][C]0.298326[/C][C]2.8924[/C][C]0.002375[/C][/ROW]
[ROW][C]7[/C][C]0.266367[/C][C]2.5825[/C][C]0.005676[/C][/ROW]
[ROW][C]8[/C][C]0.168565[/C][C]1.6343[/C][C]0.052771[/C][/ROW]
[ROW][C]9[/C][C]0.086135[/C][C]0.8351[/C][C]0.202888[/C][/ROW]
[ROW][C]10[/C][C]0.090869[/C][C]0.881[/C][C]0.190282[/C][/ROW]
[ROW][C]11[/C][C]0.187832[/C][C]1.8211[/C][C]0.035886[/C][/ROW]
[ROW][C]12[/C][C]0.161106[/C][C]1.562[/C][C]0.060827[/C][/ROW]
[ROW][C]13[/C][C]0.074099[/C][C]0.7184[/C][C]0.237141[/C][/ROW]
[ROW][C]14[/C][C]-0.118266[/C][C]-1.1466[/C][C]0.127222[/C][/ROW]
[ROW][C]15[/C][C]-0.173563[/C][C]-1.6828[/C][C]0.047871[/C][/ROW]
[ROW][C]16[/C][C]-0.107039[/C][C]-1.0378[/C][C]0.151016[/C][/ROW]
[ROW][C]17[/C][C]-0.01921[/C][C]-0.1862[/C][C]0.426326[/C][/ROW]
[ROW][C]18[/C][C]0.029451[/C][C]0.2855[/C][C]0.387928[/C][/ROW]
[ROW][C]19[/C][C]0.002813[/C][C]0.0273[/C][C]0.48915[/C][/ROW]
[ROW][C]20[/C][C]-0.139859[/C][C]-1.356[/C][C]0.089177[/C][/ROW]
[ROW][C]21[/C][C]-0.222235[/C][C]-2.1546[/C][C]0.016873[/C][/ROW]
[ROW][C]22[/C][C]-0.215663[/C][C]-2.0909[/C][C]0.019616[/C][/ROW]
[ROW][C]23[/C][C]-0.034625[/C][C]-0.3357[/C][C]0.368921[/C][/ROW]
[ROW][C]24[/C][C]-0.030578[/C][C]-0.2965[/C][C]0.383765[/C][/ROW]
[ROW][C]25[/C][C]-0.043374[/C][C]-0.4205[/C][C]0.337532[/C][/ROW]
[ROW][C]26[/C][C]-0.214119[/C][C]-2.076[/C][C]0.020314[/C][/ROW]
[ROW][C]27[/C][C]-0.295195[/C][C]-2.862[/C][C]0.002594[/C][/ROW]
[ROW][C]28[/C][C]-0.228815[/C][C]-2.2184[/C][C]0.014466[/C][/ROW]
[ROW][C]29[/C][C]-0.149127[/C][C]-1.4458[/C][C]0.075773[/C][/ROW]
[ROW][C]30[/C][C]-0.060234[/C][C]-0.584[/C][C]0.280313[/C][/ROW]
[ROW][C]31[/C][C]-0.104645[/C][C]-1.0146[/C][C]0.156457[/C][/ROW]
[ROW][C]32[/C][C]-0.147691[/C][C]-1.4319[/C][C]0.077742[/C][/ROW]
[ROW][C]33[/C][C]-0.224965[/C][C]-2.1811[/C][C]0.015835[/C][/ROW]
[ROW][C]34[/C][C]-0.198454[/C][C]-1.9241[/C][C]0.028685[/C][/ROW]
[ROW][C]35[/C][C]-0.149829[/C][C]-1.4526[/C][C]0.074827[/C][/ROW]
[ROW][C]36[/C][C]-0.065416[/C][C]-0.6342[/C][C]0.263734[/C][/ROW]
[ROW][C]37[/C][C]-0.122706[/C][C]-1.1897[/C][C]0.118585[/C][/ROW]
[ROW][C]38[/C][C]-0.251403[/C][C]-2.4374[/C][C]0.008336[/C][/ROW]
[ROW][C]39[/C][C]-0.246544[/C][C]-2.3903[/C][C]0.009414[/C][/ROW]
[ROW][C]40[/C][C]-0.204919[/C][C]-1.9868[/C][C]0.02493[/C][/ROW]
[ROW][C]41[/C][C]-0.01626[/C][C]-0.1576[/C][C]0.437537[/C][/ROW]
[ROW][C]42[/C][C]0.003804[/C][C]0.0369[/C][C]0.48533[/C][/ROW]
[ROW][C]43[/C][C]0.021637[/C][C]0.2098[/C][C]0.417149[/C][/ROW]
[ROW][C]44[/C][C]-0.089078[/C][C]-0.8636[/C][C]0.194991[/C][/ROW]
[ROW][C]45[/C][C]-0.166385[/C][C]-1.6132[/C][C]0.05503[/C][/ROW]
[ROW][C]46[/C][C]-0.148976[/C][C]-1.4444[/C][C]0.075979[/C][/ROW]
[ROW][C]47[/C][C]-0.036888[/C][C]-0.3576[/C][C]0.360707[/C][/ROW]
[ROW][C]48[/C][C]0.041835[/C][C]0.4056[/C][C]0.342978[/C][/ROW]
[/TABLE]
Source: https://freestatistics.org/blog/index.php?pk=309418&T=1

Globally Unique Identifier (entire table): ba.freestatistics.org/blog/index.php?pk=309418&T=1

As an alternative you can also use a QR Code:  

The GUIDs for individual cells are displayed in the table below:

Autocorrelation Function
Time lag kACF(k)T-STATP-value
10.5381375.21741e-06
20.3490443.38410.000521
30.1532591.48590.070325
40.1813141.75790.04101
50.2563562.48550.007353
60.2983262.89240.002375
70.2663672.58250.005676
80.1685651.63430.052771
90.0861350.83510.202888
100.0908690.8810.190282
110.1878321.82110.035886
120.1611061.5620.060827
130.0740990.71840.237141
14-0.118266-1.14660.127222
15-0.173563-1.68280.047871
16-0.107039-1.03780.151016
17-0.01921-0.18620.426326
180.0294510.28550.387928
190.0028130.02730.48915
20-0.139859-1.3560.089177
21-0.222235-2.15460.016873
22-0.215663-2.09090.019616
23-0.034625-0.33570.368921
24-0.030578-0.29650.383765
25-0.043374-0.42050.337532
26-0.214119-2.0760.020314
27-0.295195-2.8620.002594
28-0.228815-2.21840.014466
29-0.149127-1.44580.075773
30-0.060234-0.5840.280313
31-0.104645-1.01460.156457
32-0.147691-1.43190.077742
33-0.224965-2.18110.015835
34-0.198454-1.92410.028685
35-0.149829-1.45260.074827
36-0.065416-0.63420.263734
37-0.122706-1.18970.118585
38-0.251403-2.43740.008336
39-0.246544-2.39030.009414
40-0.204919-1.98680.02493
41-0.01626-0.15760.437537
420.0038040.03690.48533
430.0216370.20980.417149
44-0.089078-0.86360.194991
45-0.166385-1.61320.05503
46-0.148976-1.44440.075979
47-0.036888-0.35760.360707
480.0418350.40560.342978


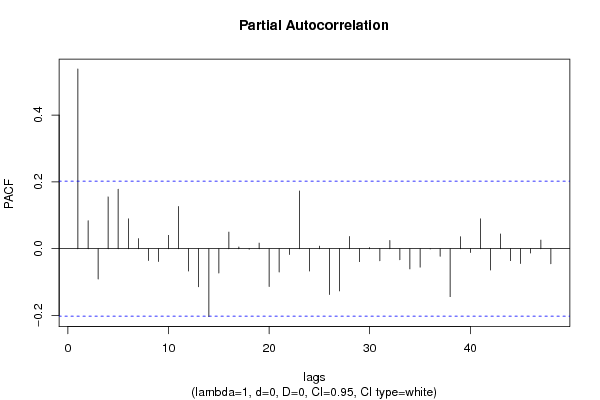
Partial Autocorrelation Function
Time lag kPACF(k)T-STATP-value
10.5381375.21741e-06
20.0836880.81140.209597
3-0.090569-0.87810.191065
40.1551061.50380.067992
50.1781741.72750.043685
60.0893840.86660.194182
70.0302290.29310.385051
8-0.0353-0.34220.366464
9-0.038188-0.37020.356015
100.0399230.38710.349789
110.126551.2270.111452
12-0.066963-0.64920.258887
13-0.11396-1.10490.136014
14-0.203373-1.97180.025787
15-0.072806-0.70590.241004
160.0498050.48290.315154
170.0052640.0510.479704
18-0.001535-0.01490.494081
190.0167660.16260.43561
20-0.113173-1.09730.137667
21-0.069862-0.67730.249929
22-0.017268-0.16740.433702
230.1726511.67390.048736
24-0.066871-0.64830.259174
250.0076640.07430.470464
26-0.136853-1.32680.093889
27-0.126227-1.22380.112041
280.0363720.35260.362574
29-0.038606-0.37430.354513
300.0032560.03160.487441
31-0.036035-0.34940.363795
320.0248280.24070.40515
33-0.032948-0.31940.375049
34-0.060397-0.58560.279785
35-0.055257-0.53570.296703
36-0.001109-0.01070.495723
37-0.022601-0.21910.413516
38-0.143495-1.39120.08372
390.035780.34690.36472
40-0.011575-0.11220.455443
410.0892940.86570.194418
42-0.063564-0.61630.269601
430.043910.42570.335642
44-0.035609-0.34520.365343
45-0.044208-0.42860.334591
46-0.012793-0.1240.450777
470.025850.25060.401327
48-0.044847-0.43480.332348

\begin{tabular}{lllllllll}
\hline
Partial Autocorrelation Function \tabularnewline
Time lag k & PACF(k) & T-STAT & P-value \tabularnewline
1 & 0.538137 & 5.2174 & 1e-06 \tabularnewline
2 & 0.083688 & 0.8114 & 0.209597 \tabularnewline
3 & -0.090569 & -0.8781 & 0.191065 \tabularnewline
4 & 0.155106 & 1.5038 & 0.067992 \tabularnewline
5 & 0.178174 & 1.7275 & 0.043685 \tabularnewline
6 & 0.089384 & 0.8666 & 0.194182 \tabularnewline
7 & 0.030229 & 0.2931 & 0.385051 \tabularnewline
8 & -0.0353 & -0.3422 & 0.366464 \tabularnewline
9 & -0.038188 & -0.3702 & 0.356015 \tabularnewline
10 & 0.039923 & 0.3871 & 0.349789 \tabularnewline
11 & 0.12655 & 1.227 & 0.111452 \tabularnewline
12 & -0.066963 & -0.6492 & 0.258887 \tabularnewline
13 & -0.11396 & -1.1049 & 0.136014 \tabularnewline
14 & -0.203373 & -1.9718 & 0.025787 \tabularnewline
15 & -0.072806 & -0.7059 & 0.241004 \tabularnewline
16 & 0.049805 & 0.4829 & 0.315154 \tabularnewline
17 & 0.005264 & 0.051 & 0.479704 \tabularnewline
18 & -0.001535 & -0.0149 & 0.494081 \tabularnewline
19 & 0.016766 & 0.1626 & 0.43561 \tabularnewline
20 & -0.113173 & -1.0973 & 0.137667 \tabularnewline
21 & -0.069862 & -0.6773 & 0.249929 \tabularnewline
22 & -0.017268 & -0.1674 & 0.433702 \tabularnewline
23 & 0.172651 & 1.6739 & 0.048736 \tabularnewline
24 & -0.066871 & -0.6483 & 0.259174 \tabularnewline
25 & 0.007664 & 0.0743 & 0.470464 \tabularnewline
26 & -0.136853 & -1.3268 & 0.093889 \tabularnewline
27 & -0.126227 & -1.2238 & 0.112041 \tabularnewline
28 & 0.036372 & 0.3526 & 0.362574 \tabularnewline
29 & -0.038606 & -0.3743 & 0.354513 \tabularnewline
30 & 0.003256 & 0.0316 & 0.487441 \tabularnewline
31 & -0.036035 & -0.3494 & 0.363795 \tabularnewline
32 & 0.024828 & 0.2407 & 0.40515 \tabularnewline
33 & -0.032948 & -0.3194 & 0.375049 \tabularnewline
34 & -0.060397 & -0.5856 & 0.279785 \tabularnewline
35 & -0.055257 & -0.5357 & 0.296703 \tabularnewline
36 & -0.001109 & -0.0107 & 0.495723 \tabularnewline
37 & -0.022601 & -0.2191 & 0.413516 \tabularnewline
38 & -0.143495 & -1.3912 & 0.08372 \tabularnewline
39 & 0.03578 & 0.3469 & 0.36472 \tabularnewline
40 & -0.011575 & -0.1122 & 0.455443 \tabularnewline
41 & 0.089294 & 0.8657 & 0.194418 \tabularnewline
42 & -0.063564 & -0.6163 & 0.269601 \tabularnewline
43 & 0.04391 & 0.4257 & 0.335642 \tabularnewline
44 & -0.035609 & -0.3452 & 0.365343 \tabularnewline
45 & -0.044208 & -0.4286 & 0.334591 \tabularnewline
46 & -0.012793 & -0.124 & 0.450777 \tabularnewline
47 & 0.02585 & 0.2506 & 0.401327 \tabularnewline
48 & -0.044847 & -0.4348 & 0.332348 \tabularnewline
\hline
\end{tabular}
%Source: https://freestatistics.org/blog/index.php?pk=309418&T=2

[TABLE]
[ROW][C]Partial Autocorrelation Function[/C][/ROW]
[ROW][C]Time lag k[/C][C]PACF(k)[/C][C]T-STAT[/C][C]P-value[/C][/ROW]
[ROW][C]1[/C][C]0.538137[/C][C]5.2174[/C][C]1e-06[/C][/ROW]
[ROW][C]2[/C][C]0.083688[/C][C]0.8114[/C][C]0.209597[/C][/ROW]
[ROW][C]3[/C][C]-0.090569[/C][C]-0.8781[/C][C]0.191065[/C][/ROW]
[ROW][C]4[/C][C]0.155106[/C][C]1.5038[/C][C]0.067992[/C][/ROW]
[ROW][C]5[/C][C]0.178174[/C][C]1.7275[/C][C]0.043685[/C][/ROW]
[ROW][C]6[/C][C]0.089384[/C][C]0.8666[/C][C]0.194182[/C][/ROW]
[ROW][C]7[/C][C]0.030229[/C][C]0.2931[/C][C]0.385051[/C][/ROW]
[ROW][C]8[/C][C]-0.0353[/C][C]-0.3422[/C][C]0.366464[/C][/ROW]
[ROW][C]9[/C][C]-0.038188[/C][C]-0.3702[/C][C]0.356015[/C][/ROW]
[ROW][C]10[/C][C]0.039923[/C][C]0.3871[/C][C]0.349789[/C][/ROW]
[ROW][C]11[/C][C]0.12655[/C][C]1.227[/C][C]0.111452[/C][/ROW]
[ROW][C]12[/C][C]-0.066963[/C][C]-0.6492[/C][C]0.258887[/C][/ROW]
[ROW][C]13[/C][C]-0.11396[/C][C]-1.1049[/C][C]0.136014[/C][/ROW]
[ROW][C]14[/C][C]-0.203373[/C][C]-1.9718[/C][C]0.025787[/C][/ROW]
[ROW][C]15[/C][C]-0.072806[/C][C]-0.7059[/C][C]0.241004[/C][/ROW]
[ROW][C]16[/C][C]0.049805[/C][C]0.4829[/C][C]0.315154[/C][/ROW]
[ROW][C]17[/C][C]0.005264[/C][C]0.051[/C][C]0.479704[/C][/ROW]
[ROW][C]18[/C][C]-0.001535[/C][C]-0.0149[/C][C]0.494081[/C][/ROW]
[ROW][C]19[/C][C]0.016766[/C][C]0.1626[/C][C]0.43561[/C][/ROW]
[ROW][C]20[/C][C]-0.113173[/C][C]-1.0973[/C][C]0.137667[/C][/ROW]
[ROW][C]21[/C][C]-0.069862[/C][C]-0.6773[/C][C]0.249929[/C][/ROW]
[ROW][C]22[/C][C]-0.017268[/C][C]-0.1674[/C][C]0.433702[/C][/ROW]
[ROW][C]23[/C][C]0.172651[/C][C]1.6739[/C][C]0.048736[/C][/ROW]
[ROW][C]24[/C][C]-0.066871[/C][C]-0.6483[/C][C]0.259174[/C][/ROW]
[ROW][C]25[/C][C]0.007664[/C][C]0.0743[/C][C]0.470464[/C][/ROW]
[ROW][C]26[/C][C]-0.136853[/C][C]-1.3268[/C][C]0.093889[/C][/ROW]
[ROW][C]27[/C][C]-0.126227[/C][C]-1.2238[/C][C]0.112041[/C][/ROW]
[ROW][C]28[/C][C]0.036372[/C][C]0.3526[/C][C]0.362574[/C][/ROW]
[ROW][C]29[/C][C]-0.038606[/C][C]-0.3743[/C][C]0.354513[/C][/ROW]
[ROW][C]30[/C][C]0.003256[/C][C]0.0316[/C][C]0.487441[/C][/ROW]
[ROW][C]31[/C][C]-0.036035[/C][C]-0.3494[/C][C]0.363795[/C][/ROW]
[ROW][C]32[/C][C]0.024828[/C][C]0.2407[/C][C]0.40515[/C][/ROW]
[ROW][C]33[/C][C]-0.032948[/C][C]-0.3194[/C][C]0.375049[/C][/ROW]
[ROW][C]34[/C][C]-0.060397[/C][C]-0.5856[/C][C]0.279785[/C][/ROW]
[ROW][C]35[/C][C]-0.055257[/C][C]-0.5357[/C][C]0.296703[/C][/ROW]
[ROW][C]36[/C][C]-0.001109[/C][C]-0.0107[/C][C]0.495723[/C][/ROW]
[ROW][C]37[/C][C]-0.022601[/C][C]-0.2191[/C][C]0.413516[/C][/ROW]
[ROW][C]38[/C][C]-0.143495[/C][C]-1.3912[/C][C]0.08372[/C][/ROW]
[ROW][C]39[/C][C]0.03578[/C][C]0.3469[/C][C]0.36472[/C][/ROW]
[ROW][C]40[/C][C]-0.011575[/C][C]-0.1122[/C][C]0.455443[/C][/ROW]
[ROW][C]41[/C][C]0.089294[/C][C]0.8657[/C][C]0.194418[/C][/ROW]
[ROW][C]42[/C][C]-0.063564[/C][C]-0.6163[/C][C]0.269601[/C][/ROW]
[ROW][C]43[/C][C]0.04391[/C][C]0.4257[/C][C]0.335642[/C][/ROW]
[ROW][C]44[/C][C]-0.035609[/C][C]-0.3452[/C][C]0.365343[/C][/ROW]
[ROW][C]45[/C][C]-0.044208[/C][C]-0.4286[/C][C]0.334591[/C][/ROW]
[ROW][C]46[/C][C]-0.012793[/C][C]-0.124[/C][C]0.450777[/C][/ROW]
[ROW][C]47[/C][C]0.02585[/C][C]0.2506[/C][C]0.401327[/C][/ROW]
[ROW][C]48[/C][C]-0.044847[/C][C]-0.4348[/C][C]0.332348[/C][/ROW]
[/TABLE]
Source: https://freestatistics.org/blog/index.php?pk=309418&T=2

Globally Unique Identifier (entire table): ba.freestatistics.org/blog/index.php?pk=309418&T=2

As an alternative you can also use a QR Code:  

The GUIDs for individual cells are displayed in the table below:

Partial Autocorrelation Function
Time lag kPACF(k)T-STATP-value
10.5381375.21741e-06
20.0836880.81140.209597
3-0.090569-0.87810.191065
40.1551061.50380.067992
50.1781741.72750.043685
60.0893840.86660.194182
70.0302290.29310.385051
8-0.0353-0.34220.366464
9-0.038188-0.37020.356015
100.0399230.38710.349789
110.126551.2270.111452
12-0.066963-0.64920.258887
13-0.11396-1.10490.136014
14-0.203373-1.97180.025787
15-0.072806-0.70590.241004
160.0498050.48290.315154
170.0052640.0510.479704
18-0.001535-0.01490.494081
190.0167660.16260.43561
20-0.113173-1.09730.137667
21-0.069862-0.67730.249929
22-0.017268-0.16740.433702
230.1726511.67390.048736
24-0.066871-0.64830.259174
250.0076640.07430.470464
26-0.136853-1.32680.093889
27-0.126227-1.22380.112041
280.0363720.35260.362574
29-0.038606-0.37430.354513
300.0032560.03160.487441
31-0.036035-0.34940.363795
320.0248280.24070.40515
33-0.032948-0.31940.375049
34-0.060397-0.58560.279785
35-0.055257-0.53570.296703
36-0.001109-0.01070.495723
37-0.022601-0.21910.413516
38-0.143495-1.39120.08372
390.035780.34690.36472
40-0.011575-0.11220.455443
410.0892940.86570.194418
42-0.063564-0.61630.269601
430.043910.42570.335642
44-0.035609-0.34520.365343
45-0.044208-0.42860.334591
46-0.012793-0.1240.450777
470.025850.25060.401327
48-0.044847-0.43480.332348


Parameters (Session):
par1 = 12 ;
Parameters (R input):
par1 = 48 ; par2 = 1 ; par3 = 0 ; par4 = 0 ; par5 = 12 ; par6 = White Noise ; par7 = 0.95 ; par8 = ;
R code (references can be found in the software module):
par8 <- ''
par7 <- '0.95'
par6 <- 'White Noise'
par5 <- '12'
par4 <- '0'
par3 <- '1'
par2 <- '1'
par1 <- 'Default'
if (par1 == 'Default') {
par1 = 10*log10(length(x))
} else {
par1 <- as.numeric(par1)
}
par2 <- as.numeric(par2)
par3 <- as.numeric(par3)
par4 <- as.numeric(par4)
par5 <- as.numeric(par5)
if (par6 == 'White Noise') par6 <- 'white' else par6 <- 'ma'
par7 <- as.numeric(par7)
if (par8 != '') par8 <- as.numeric(par8)
x <- na.omit(x)
ox <- x
if (par8 == '') {
if (par2 == 0) {
x <- log(x)
} else {
x <- (x ^ par2 - 1) / par2
}
} else {
x <- log(x,base=par8)
}
if (par3 > 0) x <- diff(x,lag=1,difference=par3)
if (par4 > 0) x <- diff(x,lag=par5,difference=par4)
bitmap(file='picts.png')
op <- par(mfrow=c(2,1))
plot(ox,type='l',main='Original Time Series',xlab='time',ylab='value')
if (par8=='') {
mytitle <- paste('Working Time Series (lambda=',par2,', d=',par3,', D=',par4,')',sep='')
mysub <- paste('(lambda=',par2,', d=',par3,', D=',par4,', CI=', par7, ', CI type=',par6,')',sep='')
} else {
mytitle <- paste('Working Time Series (base=',par8,', d=',par3,', D=',par4,')',sep='')
mysub <- paste('(base=',par8,', d=',par3,', D=',par4,', CI=', par7, ', CI type=',par6,')',sep='')
}
plot(x,type='l', main=mytitle,xlab='time',ylab='value')
par(op)
dev.off()
bitmap(file='pic1.png')
racf <- acf(x, par1, main='Autocorrelation', xlab='time lag', ylab='ACF', ci.type=par6, ci=par7, sub=mysub)
dev.off()
bitmap(file='pic2.png')
rpacf <- pacf(x,par1,main='Partial Autocorrelation',xlab='lags',ylab='PACF',sub=mysub)
dev.off()
(myacf <- c(racf$acf))
(mypacf <- c(rpacf$acf))
lengthx <- length(x)
sqrtn <- sqrt(lengthx)
load(file='createtable')
a<-table.start()
a<-table.row.start(a)
a<-table.element(a,'Autocorrelation Function',4,TRUE)
a<-table.row.end(a)
a<-table.row.start(a)
a<-table.element(a,'Time lag k',header=TRUE)
a<-table.element(a,'ACF(k)',header=TRUE)
a<-table.element(a,'T-STAT',header=TRUE)
a<-table.element(a,'P-value',header=TRUE)
a<-table.row.end(a)
for (i in 2:(par1+1)) {
a<-table.row.start(a)
a<-table.element(a,i-1,header=TRUE)
a<-table.element(a,round(myacf[i],6))
mytstat <- myacf[i]*sqrtn
a<-table.element(a,round(mytstat,4))
a<-table.element(a,round(1-pt(abs(mytstat),lengthx),6))
a<-table.row.end(a)
}
a<-table.end(a)
table.save(a,file='mytable.tab')
a<-table.start()
a<-table.row.start(a)
a<-table.element(a,'Partial Autocorrelation Function',4,TRUE)
a<-table.row.end(a)
a<-table.row.start(a)
a<-table.element(a,'Time lag k',header=TRUE)
a<-table.element(a,'PACF(k)',header=TRUE)
a<-table.element(a,'T-STAT',header=TRUE)
a<-table.element(a,'P-value',header=TRUE)
a<-table.row.end(a)
for (i in 1:par1) {
a<-table.row.start(a)
a<-table.element(a,i,header=TRUE)
a<-table.element(a,round(mypacf[i],6))
mytstat <- mypacf[i]*sqrtn
a<-table.element(a,round(mytstat,4))
a<-table.element(a,round(1-pt(abs(mytstat),lengthx),6))
a<-table.row.end(a)
}
a<-table.end(a)
table.save(a,file='mytable1.tab')