Free Statistics

of Irreproducible Research!

Author's title

Author*The author of this computation has been verified*
R Software Modulerwasp_bootstrapplot.wasp
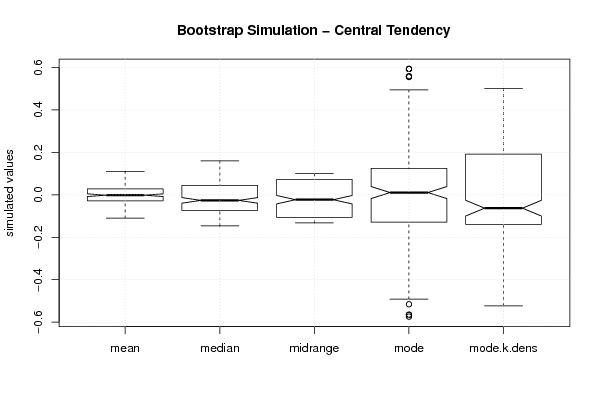
Title produced by softwareBlocked Bootstrap Plot - Central Tendency
Date of computationWed, 13 Dec 2017 18:09:02 +0100
Cite this page as followsStatistical Computations at FreeStatistics.org, Office for Research Development and Education, URL https://freestatistics.org/blog/index.php?v=date/2017/Dec/13/t15131851000vgehaqm1wczr5l.htm/, Retrieved Wed, 15 May 2024 09:04:08 +0000
Statistical Computations at FreeStatistics.org, Office for Research Development and Education, URL https://freestatistics.org/blog/index.php?pk=309378, Retrieved Wed, 15 May 2024 09:04:08 +0000
QR Codes:

Original text written by user:
IsPrivate?No (this computation is public)
User-defined keywords
Estimated Impact80
Family? (F = Feedback message, R = changed R code, M = changed R Module, P = changed Parameters, D = changed Data)
-       [Blocked Bootstrap Plot - Central Tendency] [] [2017-12-13 17:09:02] [37d4e299f63d60aeb1b8f01e350555e9] [Current]
Feedback Forum

Post a new message
Dataseries X:
0.494979213066671
-0.105265028933334
0.248265323066667
0.203921130066666
0.0722154460666665
0.493213422066667
-0.309406703933333
-0.564406510933333
-0.444955645933334
0.558442720066666
-0.548502918933333
-0.0884390269333335
0.160179669066666
0.466836164066667
0.487277524066666
0.0442840060666665
-0.0637110839333337
-0.235575723933334
-0.208076413933334
0.409534581066667
0.593333235066667
-0.439935474933333
-0.591447492933333
-0.118913953933334
0.487039184066666
-0.820071569111111
-0.387120525111111
-0.4911817846
-0.146554391999999
-0.266331930933334
0.146554392000001
-0.0736346983333333
0.358349311142857
0.555380330888889
-0.175465967857143
0.162571507888889
-0.2222540746
0.2267988004
-0.166424776933333
-0.0428341019333334
-0.574125755933334
-0.425900615857143
-0.1215490606
0.453850193142857
0.774123674888889
0.447408828888889
-0.00330523385714292
0.420131324142857
0.0740592326666668
-0.0261244673333333
-0.499856901111111
0.273803869666667
0.306165871666667
0.6081861194
0.0488309270666667
-0.554269808333333
-0.503536877111111
-0.627659010857143
0.271101529888889


Summary of computational transaction
Raw Input view raw input (R code)
Raw Outputview raw output of R engine
Computing time11 seconds
R ServerBig Analytics Cloud Computing Center

\begin{tabular}{lllllllll}
\hline
Summary of computational transaction \tabularnewline
Raw Input view raw input (R code)  \tabularnewline
Raw Outputview raw output of R engine  \tabularnewline
Computing time11 seconds \tabularnewline
R ServerBig Analytics Cloud Computing Center \tabularnewline
\hline
\end{tabular}
%Source: https://freestatistics.org/blog/index.php?pk=309378&T=0

[TABLE]
[ROW]
Summary of computational transaction[/C][/ROW] [ROW]Raw Input[/C] view raw input (R code) [/C][/ROW] [ROW]Raw Output[/C]view raw output of R engine [/C][/ROW] [ROW]Computing time[/C]11 seconds[/C][/ROW] [ROW]R Server[/C]Big Analytics Cloud Computing Center[/C][/ROW] [/TABLE] Source: https://freestatistics.org/blog/index.php?pk=309378&T=0

Globally Unique Identifier (entire table): ba.freestatistics.org/blog/index.php?pk=309378&T=0

As an alternative you can also use a QR Code:  

The GUIDs for individual cells are displayed in the table below:

Summary of computational transaction
Raw Input view raw input (R code)
Raw Outputview raw output of R engine
Computing time11 seconds
R ServerBig Analytics Cloud Computing Center


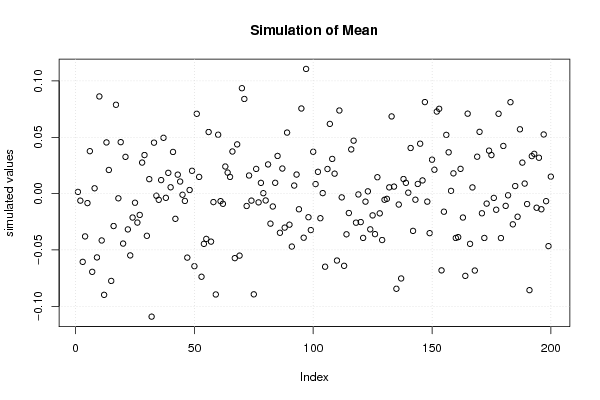
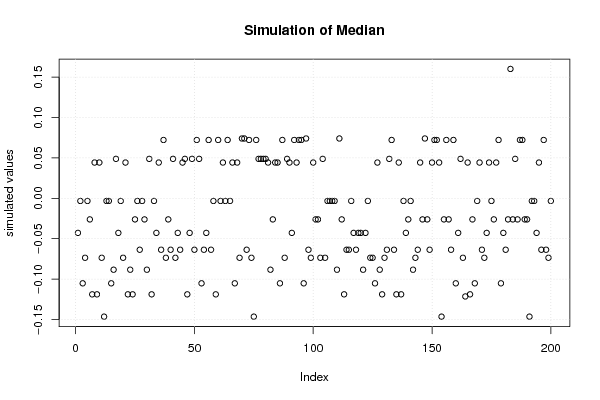
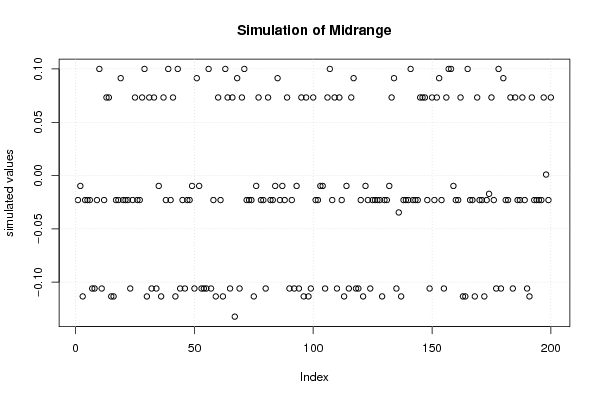
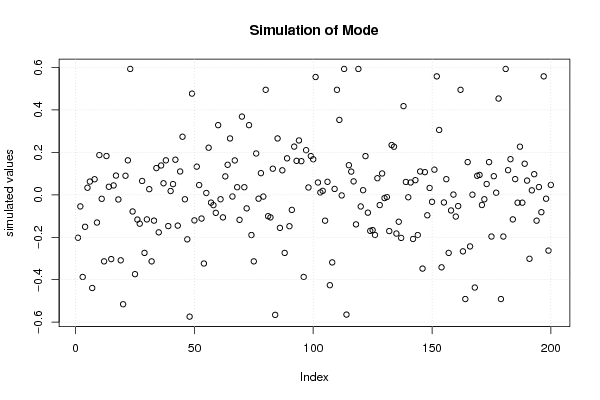
Estimation Results of Blocked Bootstrap
statisticP0.5P2.5Q1EstimateQ3P97.5P99.5S.D.IQR
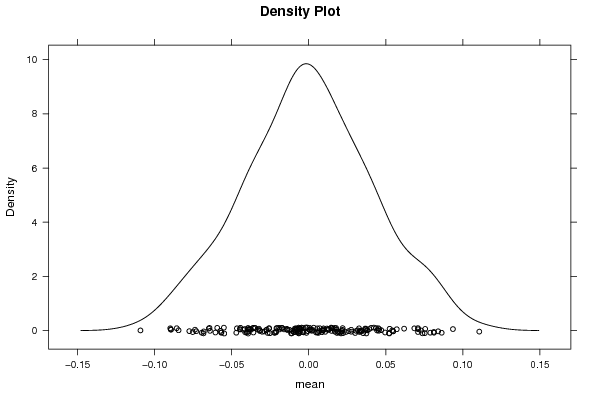
mean-0.089924-0.084471-0.027864.0108e-170.027550.0811790.0936720.0416050.05541
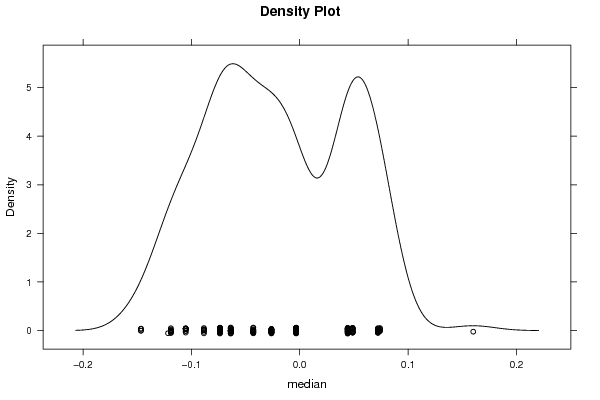
median-0.14655-0.11898-0.073635-0.0261240.0442840.0740590.074490.0644620.11792
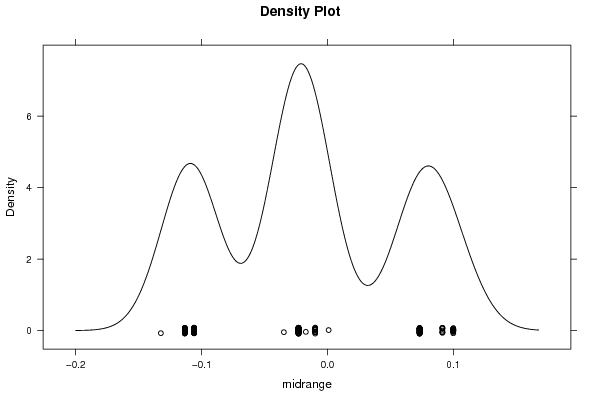
midrange-0.11346-0.11337-0.10594-0.0229740.0732320.0999990.0999990.0724260.17918
mode-0.56564-0.49118-0.127784.0255e-170.12390.558440.593330.23270.25168
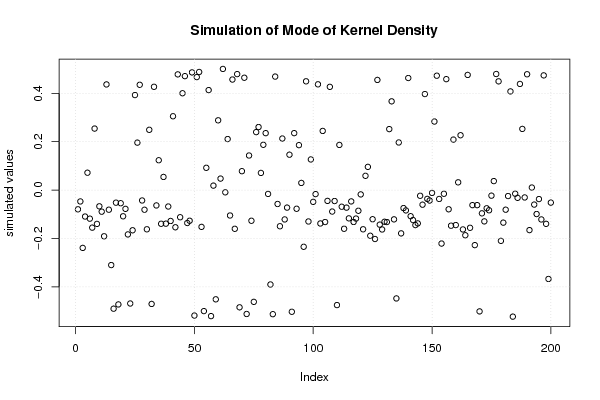
mode k.dens-0.52095-0.50328-0.13928-0.0614780.189470.478950.488340.263540.32875

\begin{tabular}{lllllllll}
\hline
Estimation Results of Blocked Bootstrap \tabularnewline
statistic & P0.5 & P2.5 & Q1 & Estimate & Q3 & P97.5 & P99.5 & S.D. & IQR \tabularnewline
mean & -0.089924 & -0.084471 & -0.02786 & 4.0108e-17 & 0.02755 & 0.081179 & 0.093672 & 0.041605 & 0.05541 \tabularnewline
median & -0.14655 & -0.11898 & -0.073635 & -0.026124 & 0.044284 & 0.074059 & 0.07449 & 0.064462 & 0.11792 \tabularnewline
midrange & -0.11346 & -0.11337 & -0.10594 & -0.022974 & 0.073232 & 0.099999 & 0.099999 & 0.072426 & 0.17918 \tabularnewline
mode & -0.56564 & -0.49118 & -0.12778 & 4.0255e-17 & 0.1239 & 0.55844 & 0.59333 & 0.2327 & 0.25168 \tabularnewline
mode k.dens & -0.52095 & -0.50328 & -0.13928 & -0.061478 & 0.18947 & 0.47895 & 0.48834 & 0.26354 & 0.32875 \tabularnewline
\hline
\end{tabular}
%Source: https://freestatistics.org/blog/index.php?pk=309378&T=1

[TABLE]
[ROW][C]Estimation Results of Blocked Bootstrap[/C][/ROW]
[ROW][C]statistic[/C][C]P0.5[/C][C]P2.5[/C][C]Q1[/C][C]Estimate[/C][C]Q3[/C][C]P97.5[/C][C]P99.5[/C][C]S.D.[/C][C]IQR[/C][/ROW]
[ROW][C]mean[/C][C]-0.089924[/C][C]-0.084471[/C][C]-0.02786[/C][C]4.0108e-17[/C][C]0.02755[/C][C]0.081179[/C][C]0.093672[/C][C]0.041605[/C][C]0.05541[/C][/ROW]
[ROW][C]median[/C][C]-0.14655[/C][C]-0.11898[/C][C]-0.073635[/C][C]-0.026124[/C][C]0.044284[/C][C]0.074059[/C][C]0.07449[/C][C]0.064462[/C][C]0.11792[/C][/ROW]
[ROW][C]midrange[/C][C]-0.11346[/C][C]-0.11337[/C][C]-0.10594[/C][C]-0.022974[/C][C]0.073232[/C][C]0.099999[/C][C]0.099999[/C][C]0.072426[/C][C]0.17918[/C][/ROW]
[ROW][C]mode[/C][C]-0.56564[/C][C]-0.49118[/C][C]-0.12778[/C][C]4.0255e-17[/C][C]0.1239[/C][C]0.55844[/C][C]0.59333[/C][C]0.2327[/C][C]0.25168[/C][/ROW]
[ROW][C]mode k.dens[/C][C]-0.52095[/C][C]-0.50328[/C][C]-0.13928[/C][C]-0.061478[/C][C]0.18947[/C][C]0.47895[/C][C]0.48834[/C][C]0.26354[/C][C]0.32875[/C][/ROW]
[/TABLE]
Source: https://freestatistics.org/blog/index.php?pk=309378&T=1

Globally Unique Identifier (entire table): ba.freestatistics.org/blog/index.php?pk=309378&T=1

As an alternative you can also use a QR Code:  

The GUIDs for individual cells are displayed in the table below:

Estimation Results of Blocked Bootstrap
statisticP0.5P2.5Q1EstimateQ3P97.5P99.5S.D.IQR
mean-0.089924-0.084471-0.027864.0108e-170.027550.0811790.0936720.0416050.05541
median-0.14655-0.11898-0.073635-0.0261240.0442840.0740590.074490.0644620.11792
midrange-0.11346-0.11337-0.10594-0.0229740.0732320.0999990.0999990.0724260.17918
mode-0.56564-0.49118-0.127784.0255e-170.12390.558440.593330.23270.25168
mode k.dens-0.52095-0.50328-0.13928-0.0614780.189470.478950.488340.263540.32875


Parameters (Session):
par1 = 1 ; par2 = Do not include Seasonal Dummies ; par3 = No Linear Trend ; par4 = 0 ; par5 = 0 ; par6 = 12 ;
Parameters (R input):
par1 = 200 ; par2 = 12 ; par3 = 5 ; par4 = P0.5 P2.5 Q1 Q3 P97.5 P99.5 ;
R code (references can be found in the software module):
par1 <- as.numeric(par1)
par2 <- as.numeric(par2)
par3 <- as.numeric(par3)
if (par1 < 10) par1 = 10
if (par1 > 5000) par1 = 5000
if (par2 < 3) par2 = 3
if (par2 > length(x)) par2 = length(x)
library(modeest)
library(lattice)
library(boot)
boot.stat <- function(s)
{
s.mean <- mean(s)
s.median <- median(s)
s.midrange <- (max(s) + min(s)) / 2
s.mode <- mlv(s,method='mfv')$M
s.kernelmode <- mlv(s, method='kernel')$M
c(s.mean, s.median, s.midrange, s.mode, s.kernelmode)
}
(r <- tsboot(x, boot.stat, R=par1, l=12, sim='fixed'))
bitmap(file='plot1.png')
plot(r$t[,1],type='p',ylab='simulated values',main='Simulation of Mean')
grid()
dev.off()
bitmap(file='plot2.png')
plot(r$t[,2],type='p',ylab='simulated values',main='Simulation of Median')
grid()
dev.off()
bitmap(file='plot3.png')
plot(r$t[,3],type='p',ylab='simulated values',main='Simulation of Midrange')
grid()
dev.off()
bitmap(file='plot7a.png')
plot(r$t[,4],type='p',ylab='simulated values',main='Simulation of Mode')
grid()
dev.off()
bitmap(file='plot8a.png')
plot(r$t[,5],type='p',ylab='simulated values',main='Simulation of Mode of Kernel Density')
grid()
dev.off()
bitmap(file='plot4.png')
densityplot(~r$t[,1],col='black',main='Density Plot',xlab='mean')
dev.off()
bitmap(file='plot5.png')
densityplot(~r$t[,2],col='black',main='Density Plot',xlab='median')
dev.off()
bitmap(file='plot6.png')
densityplot(~r$t[,3],col='black',main='Density Plot',xlab='midrange')
dev.off()
z <- data.frame(cbind(r$t[,1],r$t[,2],r$t[,3],r$t[,4],r$t[,5]) )
colnames(z) <- list('mean','median','midrange','mode','mode.k.dens')
bitmap(file='plot7.png')
boxplot(z,notch=TRUE,ylab='simulated values',main='Bootstrap Simulation - Central Tendency')
grid()
dev.off()
if (par4 == 'P1 P5 Q1 Q3 P95 P99') {
myq.1 <- 0.01
myq.2 <- 0.05
myq.3 <- 0.95
myq.4 <- 0.99
myl.1 <- 'P1'
myl.2 <- 'P5'
myl.3 <- 'P95'
myl.4 <- 'P99'
}
if (par4 == 'P0.5 P2.5 Q1 Q3 P97.5 P99.5') {
myq.1 <- 0.005
myq.2 <- 0.025
myq.3 <- 0.975
myq.4 <- 0.995
myl.1 <- 'P0.5'
myl.2 <- 'P2.5'
myl.3 <- 'P97.5'
myl.4 <- 'P99.5'
}
if (par4 == 'P10 P20 Q1 Q3 P80 P90') {
myq.1 <- 0.10
myq.2 <- 0.20
myq.3 <- 0.80
myq.4 <- 0.90
myl.1 <- 'P10'
myl.2 <- 'P20'
myl.3 <- 'P80'
myl.4 <- 'P90'
}
load(file='createtable')
a<-table.start()
a<-table.row.start(a)
a<-table.element(a,'Estimation Results of Blocked Bootstrap',10,TRUE)
a<-table.row.end(a)
a<-table.row.start(a)
a<-table.element(a,'statistic',header=TRUE)
a<-table.element(a,myl.1,header=TRUE)
a<-table.element(a,myl.2,header=TRUE)
a<-table.element(a,'Q1',header=TRUE)
a<-table.element(a,'Estimate',header=TRUE)
a<-table.element(a,'Q3',header=TRUE)
a<-table.element(a,myl.3,header=TRUE)
a<-table.element(a,myl.4,header=TRUE)
a<-table.element(a,'S.D.',header=TRUE)
a<-table.element(a,'IQR',header=TRUE)
a<-table.row.end(a)
a<-table.row.start(a)
a<-table.element(a,'mean',header=TRUE)
q1 <- quantile(r$t[,1],0.25)[[1]]
q3 <- quantile(r$t[,1],0.75)[[1]]
p01 <- quantile(r$t[,1],myq.1)[[1]]
p05 <- quantile(r$t[,1],myq.2)[[1]]
p95 <- quantile(r$t[,1],myq.3)[[1]]
p99 <- quantile(r$t[,1],myq.4)[[1]]
a<-table.element(a,signif(p01,par3))
a<-table.element(a,signif(p05,par3))
a<-table.element(a,signif(q1,par3))
a<-table.element(a,signif(r$t0[1],par3))
a<-table.element(a,signif(q3,par3))
a<-table.element(a,signif(p95,par3))
a<-table.element(a,signif(p99,par3))
a<-table.element( a,signif( sqrt(var(r$t[,1])),par3 ) )
a<-table.element(a,signif(q3-q1,par3))
a<-table.row.end(a)
a<-table.row.start(a)
a<-table.element(a,'median',header=TRUE)
q1 <- quantile(r$t[,2],0.25)[[1]]
q3 <- quantile(r$t[,2],0.75)[[1]]
p01 <- quantile(r$t[,2],myq.1)[[1]]
p05 <- quantile(r$t[,2],myq.2)[[1]]
p95 <- quantile(r$t[,2],myq.3)[[1]]
p99 <- quantile(r$t[,2],myq.4)[[1]]
a<-table.element(a,signif(p01,par3))
a<-table.element(a,signif(p05,par3))
a<-table.element(a,signif(q1,par3))
a<-table.element(a,signif(r$t0[2],par3))
a<-table.element(a,signif(q3,par3))
a<-table.element(a,signif(p95,par3))
a<-table.element(a,signif(p99,par3))
a<-table.element(a,signif(sqrt(var(r$t[,2])),par3))
a<-table.element(a,signif(q3-q1,par3))
a<-table.row.end(a)
a<-table.row.start(a)
a<-table.element(a,'midrange',header=TRUE)
q1 <- quantile(r$t[,3],0.25)[[1]]
q3 <- quantile(r$t[,3],0.75)[[1]]
p01 <- quantile(r$t[,3],myq.1)[[1]]
p05 <- quantile(r$t[,3],myq.2)[[1]]
p95 <- quantile(r$t[,3],myq.3)[[1]]
p99 <- quantile(r$t[,3],myq.4)[[1]]
a<-table.element(a,signif(p01,par3))
a<-table.element(a,signif(p05,par3))
a<-table.element(a,signif(q1,par3))
a<-table.element(a,signif(r$t0[3],par3))
a<-table.element(a,signif(q3,par3))
a<-table.element(a,signif(p95,par3))
a<-table.element(a,signif(p99,par3))
a<-table.element(a,signif(sqrt(var(r$t[,3])),par3))
a<-table.element(a,signif(q3-q1,par3))
a<-table.row.end(a)
a<-table.row.start(a)
a<-table.element(a,'mode',header=TRUE)
q1 <- quantile(r$t[,4],0.25)[[1]]
q3 <- quantile(r$t[,4],0.75)[[1]]
p01 <- quantile(r$t[,4],myq.1)[[1]]
p05 <- quantile(r$t[,4],myq.2)[[1]]
p95 <- quantile(r$t[,4],myq.3)[[1]]
p99 <- quantile(r$t[,4],myq.4)[[1]]
a<-table.element(a,signif(p01,par3))
a<-table.element(a,signif(p05,par3))
a<-table.element(a,signif(q1,par3))
a<-table.element(a,signif(r$t0[4],par3))
a<-table.element(a,signif(q3,par3))
a<-table.element(a,signif(p95,par3))
a<-table.element(a,signif(p99,par3))
a<-table.element(a,signif(sqrt(var(r$t[,4])),par3))
a<-table.element(a,signif(q3-q1,par3))
a<-table.row.end(a)
a<-table.row.start(a)
a<-table.element(a,'mode k.dens',header=TRUE)
q1 <- quantile(r$t[,5],0.25)[[1]]
q3 <- quantile(r$t[,5],0.75)[[1]]
p01 <- quantile(r$t[,5],myq.1)[[1]]
p05 <- quantile(r$t[,5],myq.2)[[1]]
p95 <- quantile(r$t[,5],myq.3)[[1]]
p99 <- quantile(r$t[,5],myq.4)[[1]]
a<-table.element(a,signif(p01,par3))
a<-table.element(a,signif(p05,par3))
a<-table.element(a,signif(q1,par3))
a<-table.element(a,signif(r$t0[5],par3))
a<-table.element(a,signif(q3,par3))
a<-table.element(a,signif(p95,par3))
a<-table.element(a,signif(p99,par3))
a<-table.element(a,signif(sqrt(var(r$t[,5])),par3))
a<-table.element(a,signif(q3-q1,par3))
a<-table.row.end(a)
a<-table.end(a)
table.save(a,file='mytable.tab')