Free Statistics
of Irreproducible Research!
Description of Statistical Computation | ||||||||||||||||||||||||||||||
|---|---|---|---|---|---|---|---|---|---|---|---|---|---|---|---|---|---|---|---|---|---|---|---|---|---|---|---|---|---|---|
| Author's title | ||||||||||||||||||||||||||||||
| Author | *The author of this computation has been verified* | |||||||||||||||||||||||||||||
| R Software Module | rwasp_skewness_kurtosis_plot.wasp | |||||||||||||||||||||||||||||
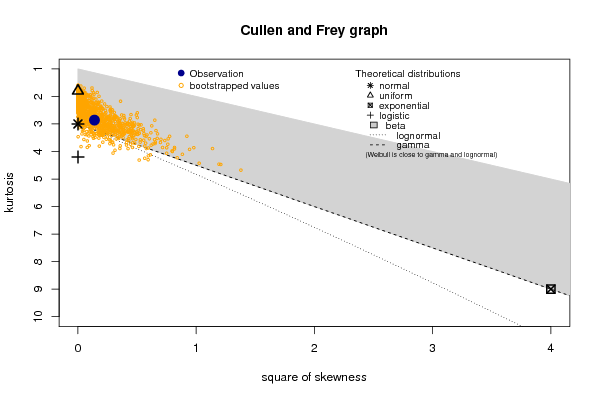
| Title produced by software | Skewness-Kurtosis Plot | |||||||||||||||||||||||||||||
| Date of computation | Wed, 13 Dec 2017 17:42:29 +0100 | |||||||||||||||||||||||||||||
| Cite this page as follows | Statistical Computations at FreeStatistics.org, Office for Research Development and Education, URL https://freestatistics.org/blog/index.php?v=date/2017/Dec/13/t1513183485s93u0hnevb98son.htm/, Retrieved Wed, 15 May 2024 10:33:26 +0000 | |||||||||||||||||||||||||||||
| Statistical Computations at FreeStatistics.org, Office for Research Development and Education, URL https://freestatistics.org/blog/index.php?pk=309372, Retrieved Wed, 15 May 2024 10:33:26 +0000 | ||||||||||||||||||||||||||||||
| QR Codes: | ||||||||||||||||||||||||||||||
|
| ||||||||||||||||||||||||||||||
| Original text written by user: | ||||||||||||||||||||||||||||||
| IsPrivate? | No (this computation is public) | |||||||||||||||||||||||||||||
| User-defined keywords | ||||||||||||||||||||||||||||||
| Estimated Impact | 39 | |||||||||||||||||||||||||||||
Tree of Dependent Computations | ||||||||||||||||||||||||||||||
| Family? (F = Feedback message, R = changed R code, M = changed R Module, P = changed Parameters, D = changed Data) | ||||||||||||||||||||||||||||||
| - [Skewness-Kurtosis Plot] [] [2017-12-13 16:42:29] [37d4e299f63d60aeb1b8f01e350555e9] [Current] | ||||||||||||||||||||||||||||||
| Feedback Forum | ||||||||||||||||||||||||||||||
Post a new message | ||||||||||||||||||||||||||||||
Dataset | ||||||||||||||||||||||||||||||
| Dataseries X: | ||||||||||||||||||||||||||||||
0.395133156454542 -0.205111085545455 0.148419266454546 0.104075073454545 -0.0276306105454541 0.393367365454546 -0.409252760545454 -0.664252567545454 -0.544801702545455 0.458596663454545 0.708167132454545 -0.648348975545454 -0.188285083545454 0.0603336124545454 0.366990107454546 1.30318062245455 0.984033943454545 0.387431467454545 -0.0555620505454544 -0.163557140545455 -0.335421780545455 -0.307922470545454 0.309688524454546 0.493487178454546 -0.539781531545454 -0.691293549545454 -0.218760010545455 0.387193127454545 -0.820071569111111 -0.387120525111111 -0.4911817846 -0.146554392 -0.366177987545455 0.146554392 -0.0736346983333332 0.358349311142857 0.555380330888889 -0.175465967857143 0.162571507888889 -0.2222540746 0.2267988004 -0.266270833545454 -0.142680158545454 -0.673971812545455 -0.425900615857143 -0.1215490606 0.453850193142857 0.774123674888889 0.447408828888889 -0.00330523385714288 0.420131324142857 0.0740592326666668 -0.0261244673333333 -0.499856901111111 0.273803869666667 0.306165871666667 0.6081861194 -0.0510151295454542 -0.554269808333333 -0.503536877111111 -0.627659010857143 0.271101529888889 | ||||||||||||||||||||||||||||||
Tables (Output of Computation) | ||||||||||||||||||||||||||||||
| ||||||||||||||||||||||||||||||
Figures (Output of Computation) | ||||||||||||||||||||||||||||||
Input Parameters & R Code | ||||||||||||||||||||||||||||||
| Parameters (Session): | ||||||||||||||||||||||||||||||
| par1 = 1 ; par2 = Do not include Seasonal Dummies ; par3 = No Linear Trend ; par4 = 0 ; par5 = 0 ; par6 = 12 ; | ||||||||||||||||||||||||||||||
| Parameters (R input): | ||||||||||||||||||||||||||||||
| R code (references can be found in the software module): | ||||||||||||||||||||||||||||||
library(fitdistrplus) | ||||||||||||||||||||||||||||||