Free Statistics

of Irreproducible Research!

Author's title

Author*The author of this computation has been verified*
R Software Modulerwasp_twosampletests_mean.wasp
Title produced by softwarePaired and Unpaired Two Samples Tests about the Mean
Date of computationWed, 13 Dec 2017 17:07:26 +0100
Cite this page as followsStatistical Computations at FreeStatistics.org, Office for Research Development and Education, URL https://freestatistics.org/blog/index.php?v=date/2017/Dec/13/t151318126750wtbl8rvcai27j.htm/, Retrieved Wed, 15 May 2024 07:13:41 +0000
Statistical Computations at FreeStatistics.org, Office for Research Development and Education, URL https://freestatistics.org/blog/index.php?pk=309368, Retrieved Wed, 15 May 2024 07:13:41 +0000
QR Codes:

Original text written by user:
IsPrivate?No (this computation is public)
User-defined keywords
Estimated Impact76
Family? (F = Feedback message, R = changed R code, M = changed R Module, P = changed Parameters, D = changed Data)
-       [Paired and Unpaired Two Samples Tests about the Mean] [t test] [2017-12-13 16:07:26] [9daa1cf3c40a2e57e8b63b2aa362ac76] [Current]
Feedback Forum

Post a new message
Dataseries X:
63,2636797	65,76086337
71,85867748	61,10315626
71,28460442	68,10693338
61,89824393	45,80664909
72,92508844	69,96441999
75,2310412	44,36839691
67,33207119	66,78275172
56,07845555	66,22085453
77,77585569	59,63088329
65,02926471	70,03302999
70,80019618	37,5384896
73,04552543	65,44903459
64,03106585	58,95633665
64,00122306	70,32293143
76,10806126	72,80032394
52,91614247	54,8462022
77,36893639	43,96020432
73,71522333	89,18812528
71,80052666	73,52043058
75,41643317	58,96273154
49,08234945	72,21598781
78,13857355	65,58552985
74,7191179	63,99043246
77,46951514	66,66352265
70,34135894	54,1957998
64,50519113	66,50615165
70,67004748	63,56561317
71,54616373	74,61861701
82,50116384	94,63156476
73,49528193	72,65126629
75,67667939	52,06655902
77,17110424	85,27587698
70,32223397	62,17849164
68,45578884	75,30855401
68,91089999	59,816406
72,97253848	71,19610319
61,55714931	79,06687034
61,97070224	61,2540187
67,46336243	76,834004
64,23993131	42,83459094
56,44240122	56,90231392
69,03108119	64,47587526
57,87997129	62,97989858
57,73222387	68,68660835
79,1531092	71,62234356
67,54922442	59,73070034
59,70391175	67,05230322
78,07053198	62,85774207
65,59672119	91,92195267
57,05641246	58,90418282
73,84694943	75,47604314
69,3218438	83,03920213
76,45375167	40,16522399
71,09922098	65,50846438
79,37287155	53,02047685
72,22228209	61,08738221
59,61177425	66,13816156
67,7288951	53,10295665
65,53734256	62,23370081
63,97448391	70,71979797
60,51561872	76,45883743
66,31473884	69,87388263
80,10465098	48,83768229
74,05586604	55,40366561
81,47883495	81,02143129
77,55718474	74,42000611
63,20556299	57,56053229
64,71419301	66,09069731
69,05364234	75,94392132
85,37759999	75,01117766
81,38091648	71,44972431
73,14817612	67,25738006
61,00814421	76,06943159
69,89383639	64,44279239
73,50639198	71,80884682
68,9178491	83,57807774
79,3213373	82,8105779
82,46392003	52,71676246
64,90603955	69,97499286
66,90273569	58,0338106
70,55874239	66,75761272
70,86180876	53,92302244
79,67032747	74,85775728
63,87361527	71,26806695
72,20154561	86,4490683
68,46071717	76,77892273
80,08031631	50,06672227
67,28757984	63,5657837
77,54384928	79,22796458
64,45166168	82,69495839
66,60926164	66,41943701
59,2039682	56,9575373
64,54620365	66,03754871
69,32904871	61,96920838
67,24904001	67,11085194
75,96785981	62,04658649
71,41980081	81,24277957
80,20340505	62,12670729
56,75396	72,54613438
62,82297836	57,38758619


Summary of computational transaction
Raw Input view raw input (R code)
Raw Outputview raw output of R engine
Computing time3 seconds
R ServerBig Analytics Cloud Computing Center

\begin{tabular}{lllllllll}
\hline
Summary of computational transaction \tabularnewline
Raw Input view raw input (R code)  \tabularnewline
Raw Outputview raw output of R engine  \tabularnewline
Computing time3 seconds \tabularnewline
R ServerBig Analytics Cloud Computing Center \tabularnewline
\hline
\end{tabular}
%Source: https://freestatistics.org/blog/index.php?pk=309368&T=0

[TABLE]
[ROW]
Summary of computational transaction[/C][/ROW] [ROW]Raw Input[/C] view raw input (R code) [/C][/ROW] [ROW]Raw Output[/C]view raw output of R engine [/C][/ROW] [ROW]Computing time[/C]3 seconds[/C][/ROW] [ROW]R Server[/C]Big Analytics Cloud Computing Center[/C][/ROW] [/TABLE] Source: https://freestatistics.org/blog/index.php?pk=309368&T=0

Globally Unique Identifier (entire table): ba.freestatistics.org/blog/index.php?pk=309368&T=0

As an alternative you can also use a QR Code:  

The GUIDs for individual cells are displayed in the table below:

Summary of computational transaction
Raw Input view raw input (R code)
Raw Outputview raw output of R engine
Computing time3 seconds
R ServerBig Analytics Cloud Computing Center


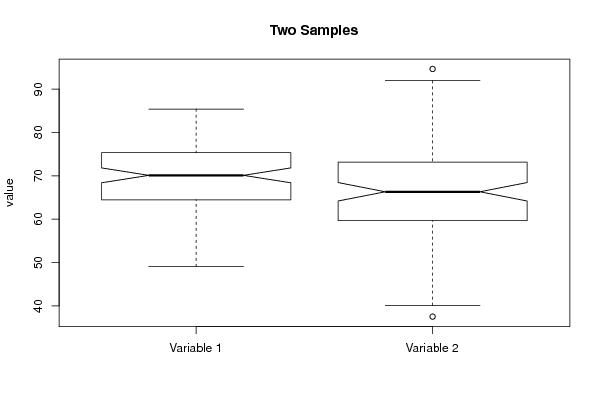
Two Sample t-test (unpaired)
Mean of Sample 169.6339740278
Mean of Sample 266.376025267
t-stat2.44218332362111
df198
p-value0.015476383760892
H0 value0
Alternativetwo.sided
CI Level0.95
CI[0.627215909563184,5.8886816120368]
F-test to compare two variances
F-stat0.435589532076942
df99
p-value4.76171120123451e-05
H0 value1
Alternativetwo.sided
CI Level0.95
CI[0.293082785203223,0.647387871394239]

\begin{tabular}{lllllllll}
\hline
Two Sample t-test (unpaired) \tabularnewline
Mean of Sample 1 & 69.6339740278 \tabularnewline
Mean of Sample 2 & 66.376025267 \tabularnewline
t-stat & 2.44218332362111 \tabularnewline
df & 198 \tabularnewline
p-value & 0.015476383760892 \tabularnewline
H0 value & 0 \tabularnewline
Alternative & two.sided \tabularnewline
CI Level & 0.95 \tabularnewline
CI & [0.627215909563184,5.8886816120368] \tabularnewline
F-test to compare two variances \tabularnewline
F-stat & 0.435589532076942 \tabularnewline
df & 99 \tabularnewline
p-value & 4.76171120123451e-05 \tabularnewline
H0 value & 1 \tabularnewline
Alternative & two.sided \tabularnewline
CI Level & 0.95 \tabularnewline
CI & [0.293082785203223,0.647387871394239] \tabularnewline
\hline
\end{tabular}
%Source: https://freestatistics.org/blog/index.php?pk=309368&T=1

[TABLE]
[ROW][C]Two Sample t-test (unpaired)[/C][/ROW]
[ROW][C]Mean of Sample 1[/C][C]69.6339740278[/C][/ROW]
[ROW][C]Mean of Sample 2[/C][C]66.376025267[/C][/ROW]
[ROW][C]t-stat[/C][C]2.44218332362111[/C][/ROW]
[ROW][C]df[/C][C]198[/C][/ROW]
[ROW][C]p-value[/C][C]0.015476383760892[/C][/ROW]
[ROW][C]H0 value[/C][C]0[/C][/ROW]
[ROW][C]Alternative[/C][C]two.sided[/C][/ROW]
[ROW][C]CI Level[/C][C]0.95[/C][/ROW]
[ROW][C]CI[/C][C][0.627215909563184,5.8886816120368][/C][/ROW]
[ROW][C]F-test to compare two variances[/C][/ROW]
[ROW][C]F-stat[/C][C]0.435589532076942[/C][/ROW]
[ROW][C]df[/C][C]99[/C][/ROW]
[ROW][C]p-value[/C][C]4.76171120123451e-05[/C][/ROW]
[ROW][C]H0 value[/C][C]1[/C][/ROW]
[ROW][C]Alternative[/C][C]two.sided[/C][/ROW]
[ROW][C]CI Level[/C][C]0.95[/C][/ROW]
[ROW][C]CI[/C][C][0.293082785203223,0.647387871394239][/C][/ROW]
[/TABLE]
Source: https://freestatistics.org/blog/index.php?pk=309368&T=1

Globally Unique Identifier (entire table): ba.freestatistics.org/blog/index.php?pk=309368&T=1

As an alternative you can also use a QR Code:  

The GUIDs for individual cells are displayed in the table below:

Two Sample t-test (unpaired)
Mean of Sample 169.6339740278
Mean of Sample 266.376025267
t-stat2.44218332362111
df198
p-value0.015476383760892
H0 value0
Alternativetwo.sided
CI Level0.95
CI[0.627215909563184,5.8886816120368]
F-test to compare two variances
F-stat0.435589532076942
df99
p-value4.76171120123451e-05
H0 value1
Alternativetwo.sided
CI Level0.95
CI[0.293082785203223,0.647387871394239]


Welch Two Sample t-test (unpaired)
Mean of Sample 169.6339740278
Mean of Sample 266.376025267
t-stat2.44218332362111
df171.492187288399
p-value0.0156136642280748
H0 value0
Alternativetwo.sided
CI Level0.95
CI[0.624713129754931,5.89118439184505]

\begin{tabular}{lllllllll}
\hline
Welch Two Sample t-test (unpaired) \tabularnewline
Mean of Sample 1 & 69.6339740278 \tabularnewline
Mean of Sample 2 & 66.376025267 \tabularnewline
t-stat & 2.44218332362111 \tabularnewline
df & 171.492187288399 \tabularnewline
p-value & 0.0156136642280748 \tabularnewline
H0 value & 0 \tabularnewline
Alternative & two.sided \tabularnewline
CI Level & 0.95 \tabularnewline
CI & [0.624713129754931,5.89118439184505] \tabularnewline
\hline
\end{tabular}
%Source: https://freestatistics.org/blog/index.php?pk=309368&T=2

[TABLE]
[ROW][C]Welch Two Sample t-test (unpaired)[/C][/ROW]
[ROW][C]Mean of Sample 1[/C][C]69.6339740278[/C][/ROW]
[ROW][C]Mean of Sample 2[/C][C]66.376025267[/C][/ROW]
[ROW][C]t-stat[/C][C]2.44218332362111[/C][/ROW]
[ROW][C]df[/C][C]171.492187288399[/C][/ROW]
[ROW][C]p-value[/C][C]0.0156136642280748[/C][/ROW]
[ROW][C]H0 value[/C][C]0[/C][/ROW]
[ROW][C]Alternative[/C][C]two.sided[/C][/ROW]
[ROW][C]CI Level[/C][C]0.95[/C][/ROW]
[ROW][C]CI[/C][C][0.624713129754931,5.89118439184505][/C][/ROW]
[/TABLE]
Source: https://freestatistics.org/blog/index.php?pk=309368&T=2

Globally Unique Identifier (entire table): ba.freestatistics.org/blog/index.php?pk=309368&T=2

As an alternative you can also use a QR Code:  

The GUIDs for individual cells are displayed in the table below:

Welch Two Sample t-test (unpaired)
Mean of Sample 169.6339740278
Mean of Sample 266.376025267
t-stat2.44218332362111
df171.492187288399
p-value0.0156136642280748
H0 value0
Alternativetwo.sided
CI Level0.95
CI[0.624713129754931,5.89118439184505]


Wilcoxon Rank-Sum Test (Mann–Whitney U test) with continuity correction (unpaired)
W6005
p-value0.0141126134773596
H0 value0
Alternativetwo.sided
Kolmogorov-Smirnov Test to compare Distributions of two Samples
KS Statistic0.22
p-value0.0158141002853099
Kolmogorov-Smirnov Test to compare Distributional Shape of two Samples
KS Statistic0.1
p-value0.699374199935276

\begin{tabular}{lllllllll}
\hline
Wilcoxon Rank-Sum Test (Mann–Whitney U test) with continuity correction (unpaired) \tabularnewline
W & 6005 \tabularnewline
p-value & 0.0141126134773596 \tabularnewline
H0 value & 0 \tabularnewline
Alternative & two.sided \tabularnewline
Kolmogorov-Smirnov Test to compare Distributions of two Samples \tabularnewline
KS Statistic & 0.22 \tabularnewline
p-value & 0.0158141002853099 \tabularnewline
Kolmogorov-Smirnov Test to compare Distributional Shape of two Samples \tabularnewline
KS Statistic & 0.1 \tabularnewline
p-value & 0.699374199935276 \tabularnewline
\hline
\end{tabular}
%Source: https://freestatistics.org/blog/index.php?pk=309368&T=3

[TABLE]
[ROW][C]Wilcoxon Rank-Sum Test (Mann–Whitney U test) with continuity correction (unpaired)[/C][/ROW]
[ROW][C]W[/C][C]6005[/C][/ROW]
[ROW][C]p-value[/C][C]0.0141126134773596[/C][/ROW]
[ROW][C]H0 value[/C][C]0[/C][/ROW]
[ROW][C]Alternative[/C][C]two.sided[/C][/ROW]
[ROW][C]Kolmogorov-Smirnov Test to compare Distributions of two Samples[/C][/ROW]
[ROW][C]KS Statistic[/C][C]0.22[/C][/ROW]
[ROW][C]p-value[/C][C]0.0158141002853099[/C][/ROW]
[ROW][C]Kolmogorov-Smirnov Test to compare Distributional Shape of two Samples[/C][/ROW]
[ROW][C]KS Statistic[/C][C]0.1[/C][/ROW]
[ROW][C]p-value[/C][C]0.699374199935276[/C][/ROW]
[/TABLE]
Source: https://freestatistics.org/blog/index.php?pk=309368&T=3

Globally Unique Identifier (entire table): ba.freestatistics.org/blog/index.php?pk=309368&T=3

As an alternative you can also use a QR Code:  

The GUIDs for individual cells are displayed in the table below:

Wilcoxon Rank-Sum Test (Mann–Whitney U test) with continuity correction (unpaired)
W6005
p-value0.0141126134773596
H0 value0
Alternativetwo.sided
Kolmogorov-Smirnov Test to compare Distributions of two Samples
KS Statistic0.22
p-value0.0158141002853099
Kolmogorov-Smirnov Test to compare Distributional Shape of two Samples
KS Statistic0.1
p-value0.699374199935276


Parameters (Session):
Parameters (R input):
par1 = 1 ; par2 = 2 ; par3 = 0.95 ; par4 = two.sided ; par5 = unpaired ; par6 = 0.0 ;
R code (references can be found in the software module):
par1 <- as.numeric(par1) #column number of first sample
par2 <- as.numeric(par2) #column number of second sample
par3 <- as.numeric(par3) #confidence (= 1 - alpha)
if (par5 == 'unpaired') paired <- FALSE else paired <- TRUE
par6 <- as.numeric(par6) #H0
z <- t(y)
if (par1 == par2) stop('Please, select two different column numbers')
if (par1 < 1) stop('Please, select a column number greater than zero for the first sample')
if (par2 < 1) stop('Please, select a column number greater than zero for the second sample')
if (par1 > length(z[1,])) stop('The column number for the first sample should be smaller')
if (par2 > length(z[1,])) stop('The column number for the second sample should be smaller')
if (par3 <= 0) stop('The confidence level should be larger than zero')
if (par3 >= 1) stop('The confidence level should be smaller than zero')
(r.t <- t.test(z[,par1],z[,par2],var.equal=TRUE,alternative=par4,paired=paired,mu=par6,conf.level=par3))
(v.t <- var.test(z[,par1],z[,par2],conf.level=par3))
(r.w <- t.test(z[,par1],z[,par2],var.equal=FALSE,alternative=par4,paired=paired,mu=par6,conf.level=par3))
(w.t <- wilcox.test(z[,par1],z[,par2],alternative=par4,paired=paired,mu=par6,conf.level=par3))
(ks.t <- ks.test(z[,par1],z[,par2],alternative=par4))
m1 <- mean(z[,par1],na.rm=T)
m2 <- mean(z[,par2],na.rm=T)
mdiff <- m1 - m2
newsam1 <- z[!is.na(z[,par1]),par1]
newsam2 <- z[,par2]+mdiff
newsam2 <- newsam2[!is.na(newsam2)]
(ks1.t <- ks.test(newsam1,newsam2,alternative=par4))
mydf <- data.frame(cbind(z[,par1],z[,par2]))
colnames(mydf) <- c('Variable 1','Variable 2')
bitmap(file='test1.png')
boxplot(mydf, notch=TRUE, ylab='value',main=main)
dev.off()
bitmap(file='test2.png')
qqnorm(z[,par1],main='Normal QQplot - Variable 1')
qqline(z[,par1])
dev.off()
bitmap(file='test3.png')
qqnorm(z[,par2],main='Normal QQplot - Variable 2')
qqline(z[,par2])
dev.off()
load(file='createtable')
a<-table.start()
a<-table.row.start(a)
a<-table.element(a,paste('Two Sample t-test (',par5,')',sep=''),2,TRUE)
a<-table.row.end(a)
if(!paired){
a<-table.row.start(a)
a<-table.element(a,'Mean of Sample 1',header=TRUE)
a<-table.element(a,r.t$estimate[[1]])
a<-table.row.end(a)
a<-table.row.start(a)
a<-table.element(a,'Mean of Sample 2',header=TRUE)
a<-table.element(a,r.t$estimate[[2]])
a<-table.row.end(a)
} else {
a<-table.row.start(a)
a<-table.element(a,'Difference: Mean1 - Mean2',header=TRUE)
a<-table.element(a,r.t$estimate)
a<-table.row.end(a)
}
a<-table.row.start(a)
a<-table.element(a,'t-stat',header=TRUE)
a<-table.element(a,r.t$statistic[[1]])
a<-table.row.end(a)
a<-table.row.start(a)
a<-table.element(a,'df',header=TRUE)
a<-table.element(a,r.t$parameter[[1]])
a<-table.row.end(a)
a<-table.row.start(a)
a<-table.element(a,'p-value',header=TRUE)
a<-table.element(a,r.t$p.value)
a<-table.row.end(a)
a<-table.row.start(a)
a<-table.element(a,'H0 value',header=TRUE)
a<-table.element(a,r.t$null.value[[1]])
a<-table.row.end(a)
a<-table.row.start(a)
a<-table.element(a,'Alternative',header=TRUE)
a<-table.element(a,r.t$alternative)
a<-table.row.end(a)
a<-table.row.start(a)
a<-table.element(a,'CI Level',header=TRUE)
a<-table.element(a,attr(r.t$conf.int,'conf.level'))
a<-table.row.end(a)
a<-table.row.start(a)
a<-table.element(a,'CI',header=TRUE)
a<-table.element(a,paste('[',r.t$conf.int[1],',',r.t$conf.int[2],']',sep=''))
a<-table.row.end(a)
a<-table.row.start(a)
a<-table.element(a,'F-test to compare two variances',2,TRUE)
a<-table.row.end(a)
a<-table.row.start(a)
a<-table.element(a,'F-stat',header=TRUE)
a<-table.element(a,v.t$statistic[[1]])
a<-table.row.end(a)
a<-table.row.start(a)
a<-table.element(a,'df',header=TRUE)
a<-table.element(a,v.t$parameter[[1]])
a<-table.row.end(a)
a<-table.row.start(a)
a<-table.element(a,'p-value',header=TRUE)
a<-table.element(a,v.t$p.value)
a<-table.row.end(a)
a<-table.row.start(a)
a<-table.element(a,'H0 value',header=TRUE)
a<-table.element(a,v.t$null.value[[1]])
a<-table.row.end(a)
a<-table.row.start(a)
a<-table.element(a,'Alternative',header=TRUE)
a<-table.element(a,v.t$alternative)
a<-table.row.end(a)
a<-table.row.start(a)
a<-table.element(a,'CI Level',header=TRUE)
a<-table.element(a,attr(v.t$conf.int,'conf.level'))
a<-table.row.end(a)
a<-table.row.start(a)
a<-table.element(a,'CI',header=TRUE)
a<-table.element(a,paste('[',v.t$conf.int[1],',',v.t$conf.int[2],']',sep=''))
a<-table.row.end(a)
a<-table.end(a)
table.save(a,file='mytable.tab')
a<-table.start()
a<-table.row.start(a)
a<-table.element(a,paste('Welch Two Sample t-test (',par5,')',sep=''),2,TRUE)
a<-table.row.end(a)
if(!paired){
a<-table.row.start(a)
a<-table.element(a,'Mean of Sample 1',header=TRUE)
a<-table.element(a,r.w$estimate[[1]])
a<-table.row.end(a)
a<-table.row.start(a)
a<-table.element(a,'Mean of Sample 2',header=TRUE)
a<-table.element(a,r.w$estimate[[2]])
a<-table.row.end(a)
} else {
a<-table.row.start(a)
a<-table.element(a,'Difference: Mean1 - Mean2',header=TRUE)
a<-table.element(a,r.w$estimate)
a<-table.row.end(a)
}
a<-table.row.start(a)
a<-table.element(a,'t-stat',header=TRUE)
a<-table.element(a,r.w$statistic[[1]])
a<-table.row.end(a)
a<-table.row.start(a)
a<-table.element(a,'df',header=TRUE)
a<-table.element(a,r.w$parameter[[1]])
a<-table.row.end(a)
a<-table.row.start(a)
a<-table.element(a,'p-value',header=TRUE)
a<-table.element(a,r.w$p.value)
a<-table.row.end(a)
a<-table.row.start(a)
a<-table.element(a,'H0 value',header=TRUE)
a<-table.element(a,r.w$null.value[[1]])
a<-table.row.end(a)
a<-table.row.start(a)
a<-table.element(a,'Alternative',header=TRUE)
a<-table.element(a,r.w$alternative)
a<-table.row.end(a)
a<-table.row.start(a)
a<-table.element(a,'CI Level',header=TRUE)
a<-table.element(a,attr(r.w$conf.int,'conf.level'))
a<-table.row.end(a)
a<-table.row.start(a)
a<-table.element(a,'CI',header=TRUE)
a<-table.element(a,paste('[',r.w$conf.int[1],',',r.w$conf.int[2],']',sep=''))
a<-table.row.end(a)
a<-table.end(a)
table.save(a,file='mytable1.tab')
a<-table.start()
a<-table.row.start(a)
myWlabel <- 'Wilcoxon Signed-Rank Test'
if (par5=='unpaired') myWlabel = 'Wilcoxon Rank-Sum Test (Mann–Whitney U test)'
a<-table.element(a,paste(myWlabel,' with continuity correction (',par5,')',sep=''),2,TRUE)
a<-table.row.end(a)
a<-table.row.start(a)
a<-table.element(a,'W',header=TRUE)
a<-table.element(a,w.t$statistic[[1]])
a<-table.row.end(a)
a<-table.row.start(a)
a<-table.element(a,'p-value',header=TRUE)
a<-table.element(a,w.t$p.value)
a<-table.row.end(a)
a<-table.row.start(a)
a<-table.element(a,'H0 value',header=TRUE)
a<-table.element(a,w.t$null.value[[1]])
a<-table.row.end(a)
a<-table.row.start(a)
a<-table.element(a,'Alternative',header=TRUE)
a<-table.element(a,w.t$alternative)
a<-table.row.end(a)
a<-table.row.start(a)
a<-table.element(a,'Kolmogorov-Smirnov Test to compare Distributions of two Samples',2,TRUE)
a<-table.row.end(a)
a<-table.row.start(a)
a<-table.element(a,'KS Statistic',header=TRUE)
a<-table.element(a,ks.t$statistic[[1]])
a<-table.row.end(a)
a<-table.row.start(a)
a<-table.element(a,'p-value',header=TRUE)
a<-table.element(a,ks.t$p.value)
a<-table.row.end(a)
a<-table.row.start(a)
a<-table.element(a,'Kolmogorov-Smirnov Test to compare Distributional Shape of two Samples',2,TRUE)
a<-table.row.end(a)
a<-table.row.start(a)
a<-table.element(a,'KS Statistic',header=TRUE)
a<-table.element(a,ks1.t$statistic[[1]])
a<-table.row.end(a)
a<-table.row.start(a)
a<-table.element(a,'p-value',header=TRUE)
a<-table.element(a,ks1.t$p.value)
a<-table.row.end(a)
a<-table.end(a)
table.save(a,file='mytable2.tab')