Free Statistics

of Irreproducible Research!

Author's title

Author*The author of this computation has been verified*
R Software Modulerwasp_multipleregression.wasp
Title produced by softwareMultiple Regression
Date of computationWed, 13 Dec 2017 16:51:24 +0100
Cite this page as followsStatistical Computations at FreeStatistics.org, Office for Research Development and Education, URL https://freestatistics.org/blog/index.php?v=date/2017/Dec/13/t1513180401z85pvdevcivciih.htm/, Retrieved Wed, 15 May 2024 21:08:12 +0000
Statistical Computations at FreeStatistics.org, Office for Research Development and Education, URL https://freestatistics.org/blog/index.php?pk=309365, Retrieved Wed, 15 May 2024 21:08:12 +0000
QR Codes:

Original text written by user:
IsPrivate?No (this computation is public)
User-defined keywords
Estimated Impact81
Family? (F = Feedback message, R = changed R code, M = changed R Module, P = changed Parameters, D = changed Data)
-       [Multiple Regression] [Multiple Regression] [2017-12-13 15:51:24] [86c18850f013301d73767c2d74663798] [Current]
Feedback Forum

Post a new message
Dataseries X:
5.9	1	0	0
5.438	1	0	0
5.71	1	0	0
5.481	1	0	0
5.927	1	1	1
4.804	1	0	0
6.512	1	1	1
5.808	0	1	0
5.737	1	1	1
6.382	0	1	0
5.743	0	1	0
6.215	0	0	0
5.257	1	0	0
6.62	1	1	1
5.714	1	1	1
5.595	1	0	0
5.808	1	1	1
5.9	1	0	0
5.298	1	0	0
5.784	1	0	0
6.225	1	1	1
5.743	1	0	0
6.869	0	1	0
6.122	1	0	0
6.24	1	0	0
5.153	1	1	1
6.569	1	1	1
6.358	1	1	1
6.136	1	0	0
5.927	1	1	1
6.215	1	0	0
5.521	1	0	0
6.016	0	0	0
6.358	1	1	1
5.521	1	0	0
6.148	1	1	1
5.858	1	1	1
6.324	1	1	1
5.753	1	1	1
6.236	1	0	0
5.991	1	1	1
5.628	1	1	1
6.091	1	1	1
6.109	1	0	0
5.442	1	1	1
5.553	1	0	0
5.617	1	1	1
6.176	1	0	0
5.704	1	1	1
5.545	1	1	1
5.384	1	0	0
5.889	1	1	1
5.165	1	1	1
5.628	1	0	0
5.338	1	0	0
5.308	1	0	0
5.746	1	0	0
5.572	1	1	1
5.624	1	1	1
5.165	1	0	0
5.635	1	1	1
5.858	1	1	1
5.236	1	0	0
5.521	1	0	0
6.551	1	1	1
6.064	1	1	1
6.729	1	1	1
6.389	1	1	1
6.358	1	1	1
6.225	1	1	1
5.298	1	0	0
5.966	1	0	0
5.897	1	1	1
5.583	1	1	1
5.521	1	0	0
5.762	1	0	0
5.371	1	1	1
5.743	1	1	1
6.358	1	0	0
5.481	1	0	0
5.743	1	1	1
6.109	1	0	0
5.298	1	0	0
5.416	1	0	0
5.846	1	0	0
5.823	1	0	0
6.685	1	1	1
5.421	1	1	1
5.371	1	0	0
5.521	1	0	0
5.991	1	0	0
6.609	1	0	0
5.73	0	0	0
5.7	0	0	0
5.505	1	1	1
5.557	0	1	0
5.371	0	1	0
6.438	0	1	0
6.31	1	1	1
5.73	0	0	0
6.153	1	1	1
5.991	1	1	1
5.075	0	0	0
5.823	1	1	1
5.198	1	0	0
5.011	1	0	0
5.165	0	0	0
5.497	0	0	0
5.602	0	1	0
6.182	1	1	1
5.817	1	1	1
5.056	1	0	0
6.059	1	1	1
5.991	1	1	1
5.165	1	0	0
6.059	1	0	0
6.438	1	1	1
6.068	1	1	1
5.561	1	0	0
6.324	1	0	0


Summary of computational transaction
Raw Input view raw input (R code)
Raw Outputview raw output of R engine
Computing time13 seconds
R ServerBig Analytics Cloud Computing Center

\begin{tabular}{lllllllll}
\hline
Summary of computational transaction \tabularnewline
Raw Input view raw input (R code)  \tabularnewline
Raw Outputview raw output of R engine  \tabularnewline
Computing time13 seconds \tabularnewline
R ServerBig Analytics Cloud Computing Center \tabularnewline
\hline
\end{tabular}
%Source: https://freestatistics.org/blog/index.php?pk=309365&T=0

[TABLE]
[ROW]
Summary of computational transaction[/C][/ROW] [ROW]Raw Input[/C] view raw input (R code) [/C][/ROW] [ROW]Raw Output[/C]view raw output of R engine [/C][/ROW] [ROW]Computing time[/C]13 seconds[/C][/ROW] [ROW]R Server[/C]Big Analytics Cloud Computing Center[/C][/ROW] [/TABLE] Source: https://freestatistics.org/blog/index.php?pk=309365&T=0

Globally Unique Identifier (entire table): ba.freestatistics.org/blog/index.php?pk=309365&T=0

As an alternative you can also use a QR Code:  

The GUIDs for individual cells are displayed in the table below:

Summary of computational transaction
Raw Input view raw input (R code)
Raw Outputview raw output of R engine
Computing time13 seconds
R ServerBig Analytics Cloud Computing Center


Multiple Linear Regression - Estimated Regression Equation
LogWage[t] = + 5.641 + 0.0219216MetropolitanDummy[t] + 0.33025MarriageDummy[t] -0.0337753Interaction[t] + e[t]

\begin{tabular}{lllllllll}
\hline
Multiple Linear Regression - Estimated Regression Equation \tabularnewline
LogWage[t] =  +  5.641 +  0.0219216MetropolitanDummy[t] +  0.33025MarriageDummy[t] -0.0337753Interaction[t]  + e[t] \tabularnewline
 \tabularnewline
\hline
\end{tabular}
%Source: https://freestatistics.org/blog/index.php?pk=309365&T=1

[TABLE]
[ROW][C]Multiple Linear Regression - Estimated Regression Equation[/C][/ROW]
[ROW][C]LogWage[t] =  +  5.641 +  0.0219216MetropolitanDummy[t] +  0.33025MarriageDummy[t] -0.0337753Interaction[t]  + e[t][/C][/ROW]
[ROW][C][/C][/ROW]
[/TABLE]
Source: https://freestatistics.org/blog/index.php?pk=309365&T=1

Globally Unique Identifier (entire table): ba.freestatistics.org/blog/index.php?pk=309365&T=1

As an alternative you can also use a QR Code:  

The GUIDs for individual cells are displayed in the table below:

Multiple Linear Regression - Estimated Regression Equation
LogWage[t] = + 5.641 + 0.0219216MetropolitanDummy[t] + 0.33025MarriageDummy[t] -0.0337753Interaction[t] + e[t]


Multiple Linear Regression - Ordinary Least Squares
VariableParameterS.D.T-STATH0: parameter = 02-tail p-value1-tail p-value
(Intercept)+5.641 0.1426+3.9550e+01 3.598e-69 1.799e-69
MetropolitanDummy+0.02192 0.1534+1.4290e-01 0.8866 0.4433
MarriageDummy+0.3302 0.2017+1.6370e+00 0.1043 0.05216
Interaction-0.03377 0.2167-1.5590e-01 0.8764 0.4382

\begin{tabular}{lllllllll}
\hline
Multiple Linear Regression - Ordinary Least Squares \tabularnewline
Variable & Parameter & S.D. & T-STATH0: parameter = 0 & 2-tail p-value & 1-tail p-value \tabularnewline
(Intercept) & +5.641 &  0.1426 & +3.9550e+01 &  3.598e-69 &  1.799e-69 \tabularnewline
MetropolitanDummy & +0.02192 &  0.1534 & +1.4290e-01 &  0.8866 &  0.4433 \tabularnewline
MarriageDummy & +0.3302 &  0.2017 & +1.6370e+00 &  0.1043 &  0.05216 \tabularnewline
Interaction & -0.03377 &  0.2167 & -1.5590e-01 &  0.8764 &  0.4382 \tabularnewline
\hline
\end{tabular}
%Source: https://freestatistics.org/blog/index.php?pk=309365&T=2

[TABLE]
[ROW][C]Multiple Linear Regression - Ordinary Least Squares[/C][/ROW]
[ROW][C]Variable[/C][C]Parameter[/C][C]S.D.[/C][C]T-STATH0: parameter = 0[/C][C]2-tail p-value[/C][C]1-tail p-value[/C][/ROW]
[ROW][C](Intercept)[/C][C]+5.641[/C][C] 0.1426[/C][C]+3.9550e+01[/C][C] 3.598e-69[/C][C] 1.799e-69[/C][/ROW]
[ROW][C]MetropolitanDummy[/C][C]+0.02192[/C][C] 0.1534[/C][C]+1.4290e-01[/C][C] 0.8866[/C][C] 0.4433[/C][/ROW]
[ROW][C]MarriageDummy[/C][C]+0.3302[/C][C] 0.2017[/C][C]+1.6370e+00[/C][C] 0.1043[/C][C] 0.05216[/C][/ROW]
[ROW][C]Interaction[/C][C]-0.03377[/C][C] 0.2167[/C][C]-1.5590e-01[/C][C] 0.8764[/C][C] 0.4382[/C][/ROW]
[/TABLE]
Source: https://freestatistics.org/blog/index.php?pk=309365&T=2

Globally Unique Identifier (entire table): ba.freestatistics.org/blog/index.php?pk=309365&T=2

As an alternative you can also use a QR Code:  

The GUIDs for individual cells are displayed in the table below:

Multiple Linear Regression - Ordinary Least Squares
VariableParameterS.D.T-STATH0: parameter = 02-tail p-value1-tail p-value
(Intercept)+5.641 0.1426+3.9550e+01 3.598e-69 1.799e-69
MetropolitanDummy+0.02192 0.1534+1.4290e-01 0.8866 0.4433
MarriageDummy+0.3302 0.2017+1.6370e+00 0.1043 0.05216
Interaction-0.03377 0.2167-1.5590e-01 0.8764 0.4382


Multiple Linear Regression - Regression Statistics
Multiple R 0.3549
R-squared 0.126
Adjusted R-squared 0.1034
F-TEST (value) 5.573
F-TEST (DF numerator)3
F-TEST (DF denominator)116
p-value 0.001315
Multiple Linear Regression - Residual Statistics
Residual Standard Deviation 0.4035
Sum Squared Residuals 18.88

\begin{tabular}{lllllllll}
\hline
Multiple Linear Regression - Regression Statistics \tabularnewline
Multiple R &  0.3549 \tabularnewline
R-squared &  0.126 \tabularnewline
Adjusted R-squared &  0.1034 \tabularnewline
F-TEST (value) &  5.573 \tabularnewline
F-TEST (DF numerator) & 3 \tabularnewline
F-TEST (DF denominator) & 116 \tabularnewline
p-value &  0.001315 \tabularnewline
Multiple Linear Regression - Residual Statistics \tabularnewline
Residual Standard Deviation &  0.4035 \tabularnewline
Sum Squared Residuals &  18.88 \tabularnewline
\hline
\end{tabular}
%Source: https://freestatistics.org/blog/index.php?pk=309365&T=3

[TABLE]
[ROW][C]Multiple Linear Regression - Regression Statistics[/C][/ROW]
[ROW][C]Multiple R[/C][C] 0.3549[/C][/ROW]
[ROW][C]R-squared[/C][C] 0.126[/C][/ROW]
[ROW][C]Adjusted R-squared[/C][C] 0.1034[/C][/ROW]
[ROW][C]F-TEST (value)[/C][C] 5.573[/C][/ROW]
[ROW][C]F-TEST (DF numerator)[/C][C]3[/C][/ROW]
[ROW][C]F-TEST (DF denominator)[/C][C]116[/C][/ROW]
[ROW][C]p-value[/C][C] 0.001315[/C][/ROW]
[ROW][C]Multiple Linear Regression - Residual Statistics[/C][/ROW]
[ROW][C]Residual Standard Deviation[/C][C] 0.4035[/C][/ROW]
[ROW][C]Sum Squared Residuals[/C][C] 18.88[/C][/ROW]
[/TABLE]
Source: https://freestatistics.org/blog/index.php?pk=309365&T=3

Globally Unique Identifier (entire table): ba.freestatistics.org/blog/index.php?pk=309365&T=3

As an alternative you can also use a QR Code:  

The GUIDs for individual cells are displayed in the table below:

Multiple Linear Regression - Regression Statistics
Multiple R 0.3549
R-squared 0.126
Adjusted R-squared 0.1034
F-TEST (value) 5.573
F-TEST (DF numerator)3
F-TEST (DF denominator)116
p-value 0.001315
Multiple Linear Regression - Residual Statistics
Residual Standard Deviation 0.4035
Sum Squared Residuals 18.88


Menu of Residual Diagnostics
DescriptionLink
HistogramCompute
Central TendencyCompute
QQ PlotCompute
Kernel Density PlotCompute
Skewness/Kurtosis TestCompute
Skewness-Kurtosis PlotCompute
Harrell-Davis PlotCompute
Bootstrap Plot -- Central TendencyCompute
Blocked Bootstrap Plot -- Central TendencyCompute
(Partial) Autocorrelation PlotCompute
Spectral AnalysisCompute
Tukey lambda PPCC PlotCompute
Box-Cox Normality PlotCompute
Summary StatisticsCompute

\begin{tabular}{lllllllll}
\hline
Menu of Residual Diagnostics \tabularnewline
Description & Link \tabularnewline
Histogram & Compute \tabularnewline
Central Tendency & Compute \tabularnewline
QQ Plot & Compute \tabularnewline
Kernel Density Plot & Compute \tabularnewline
Skewness/Kurtosis Test & Compute \tabularnewline
Skewness-Kurtosis Plot & Compute \tabularnewline
Harrell-Davis Plot & Compute \tabularnewline
Bootstrap Plot -- Central Tendency & Compute \tabularnewline
Blocked Bootstrap Plot -- Central Tendency & Compute \tabularnewline
(Partial) Autocorrelation Plot & Compute \tabularnewline
Spectral Analysis & Compute \tabularnewline
Tukey lambda PPCC Plot & Compute \tabularnewline
Box-Cox Normality Plot & Compute \tabularnewline
Summary Statistics & Compute \tabularnewline
\hline
\end{tabular}
%Source: https://freestatistics.org/blog/index.php?pk=309365&T=4

[TABLE]
[ROW][C]Menu of Residual Diagnostics[/C][/ROW]
[ROW][C]Description[/C][C]Link[/C][/ROW]
[ROW][C]Histogram[/C][C]Compute[/C][/ROW]
[ROW][C]Central Tendency[/C][C]Compute[/C][/ROW]
[ROW][C]QQ Plot[/C][C]Compute[/C][/ROW]
[ROW][C]Kernel Density Plot[/C][C]Compute[/C][/ROW]
[ROW][C]Skewness/Kurtosis Test[/C][C]Compute[/C][/ROW]
[ROW][C]Skewness-Kurtosis Plot[/C][C]Compute[/C][/ROW]
[ROW][C]Harrell-Davis Plot[/C][C]Compute[/C][/ROW]
[ROW][C]Bootstrap Plot -- Central Tendency[/C][C]Compute[/C][/ROW]
[ROW][C]Blocked Bootstrap Plot -- Central Tendency[/C][C]Compute[/C][/ROW]
[ROW][C](Partial) Autocorrelation Plot[/C][C]Compute[/C][/ROW]
[ROW][C]Spectral Analysis[/C][C]Compute[/C][/ROW]
[ROW][C]Tukey lambda PPCC Plot[/C][C]Compute[/C][/ROW]
[ROW][C]Box-Cox Normality Plot[/C][C]Compute[/C][/ROW]
[ROW][C]Summary Statistics[/C][C]Compute[/C][/ROW]
[/TABLE]
Source: https://freestatistics.org/blog/index.php?pk=309365&T=4

Globally Unique Identifier (entire table): ba.freestatistics.org/blog/index.php?pk=309365&T=4

As an alternative you can also use a QR Code:  

The GUIDs for individual cells are displayed in the table below:

Menu of Residual Diagnostics
DescriptionLink
HistogramCompute
Central TendencyCompute
QQ PlotCompute
Kernel Density PlotCompute
Skewness/Kurtosis TestCompute
Skewness-Kurtosis PlotCompute
Harrell-Davis PlotCompute
Bootstrap Plot -- Central TendencyCompute
Blocked Bootstrap Plot -- Central TendencyCompute
(Partial) Autocorrelation PlotCompute
Spectral AnalysisCompute
Tukey lambda PPCC PlotCompute
Box-Cox Normality PlotCompute
Summary StatisticsCompute


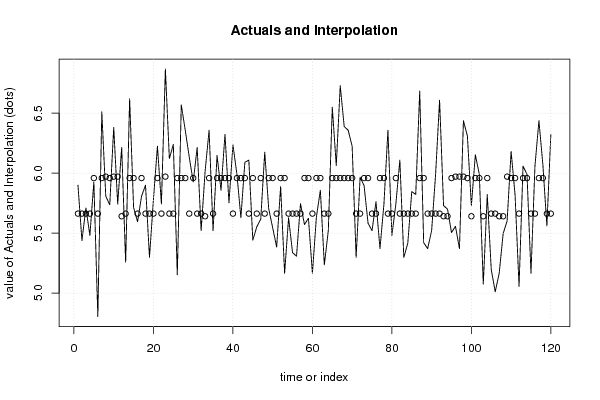
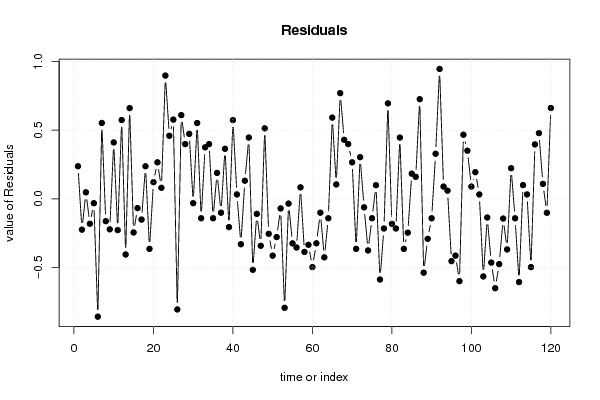
Multiple Linear Regression - Actuals, Interpolation, and Residuals
Time or IndexActualsInterpolationForecastResidualsPrediction Error
1 5.9 5.663 0.2371
2 5.438 5.663-0.2249
3 5.71 5.663 0.04708
4 5.481 5.663-0.1819
5 5.927 5.959-0.0324
6 4.804 5.663-0.8589
7 6.512 5.959 0.5526
8 5.808 5.971-0.1633
9 5.737 5.959-0.2224
10 6.382 5.971 0.4108
11 5.743 5.971-0.2283
12 6.215 5.641 0.574
13 5.257 5.663-0.4059
14 6.62 5.959 0.6606
15 5.714 5.959-0.2454
16 5.595 5.663-0.06792
17 5.808 5.959-0.1514
18 5.9 5.663 0.2371
19 5.298 5.663-0.3649
20 5.784 5.663 0.1211
21 6.225 5.959 0.2656
22 5.743 5.663 0.08008
23 6.869 5.971 0.8978
24 6.122 5.663 0.4591
25 6.24 5.663 0.5771
26 5.153 5.959-0.8064
27 6.569 5.959 0.6096
28 6.358 5.959 0.3986
29 6.136 5.663 0.4731
30 5.927 5.959-0.0324
31 6.215 5.663 0.5521
32 5.521 5.663-0.1419
33 6.016 5.641 0.375
34 6.358 5.959 0.3986
35 5.521 5.663-0.1419
36 6.148 5.959 0.1886
37 5.858 5.959-0.1014
38 6.324 5.959 0.3646
39 5.753 5.959-0.2064
40 6.236 5.663 0.5731
41 5.991 5.959 0.0316
42 5.628 5.959-0.3314
43 6.091 5.959 0.1316
44 6.109 5.663 0.4461
45 5.442 5.959-0.5174
46 5.553 5.663-0.1099
47 5.617 5.959-0.3424
48 6.176 5.663 0.5131
49 5.704 5.959-0.2554
50 5.545 5.959-0.4144
51 5.384 5.663-0.2789
52 5.889 5.959-0.0704
53 5.165 5.959-0.7944
54 5.628 5.663-0.03492
55 5.338 5.663-0.3249
56 5.308 5.663-0.3549
57 5.746 5.663 0.08308
58 5.572 5.959-0.3874
59 5.624 5.959-0.3354
60 5.165 5.663-0.4979
61 5.635 5.959-0.3244
62 5.858 5.959-0.1014
63 5.236 5.663-0.4269
64 5.521 5.663-0.1419
65 6.551 5.959 0.5916
66 6.064 5.959 0.1046
67 6.729 5.959 0.7696
68 6.389 5.959 0.4296
69 6.358 5.959 0.3986
70 6.225 5.959 0.2656
71 5.298 5.663-0.3649
72 5.966 5.663 0.3031
73 5.897 5.959-0.0624
74 5.583 5.959-0.3764
75 5.521 5.663-0.1419
76 5.762 5.663 0.09908
77 5.371 5.959-0.5884
78 5.743 5.959-0.2164
79 6.358 5.663 0.6951
80 5.481 5.663-0.1819
81 5.743 5.959-0.2164
82 6.109 5.663 0.4461
83 5.298 5.663-0.3649
84 5.416 5.663-0.2469
85 5.846 5.663 0.1831
86 5.823 5.663 0.1601
87 6.685 5.959 0.7256
88 5.421 5.959-0.5384
89 5.371 5.663-0.2919
90 5.521 5.663-0.1419
91 5.991 5.663 0.3281
92 6.609 5.663 0.9461
93 5.73 5.641 0.089
94 5.7 5.641 0.059
95 5.505 5.959-0.4544
96 5.557 5.971-0.4143
97 5.371 5.971-0.6002
98 6.438 5.971 0.4667
99 6.31 5.959 0.3506
100 5.73 5.641 0.089
101 6.153 5.959 0.1936
102 5.991 5.959 0.0316
103 5.075 5.641-0.566
104 5.823 5.959-0.1364
105 5.198 5.663-0.4649
106 5.011 5.663-0.6519
107 5.165 5.641-0.476
108 5.497 5.641-0.144
109 5.602 5.971-0.3693
110 6.182 5.959 0.2226
111 5.817 5.959-0.1424
112 5.056 5.663-0.6069
113 6.059 5.959 0.0996
114 5.991 5.959 0.0316
115 5.165 5.663-0.4979
116 6.059 5.663 0.3961
117 6.438 5.959 0.4786
118 6.068 5.959 0.1086
119 5.561 5.663-0.1019
120 6.324 5.663 0.6611

\begin{tabular}{lllllllll}
\hline
Multiple Linear Regression - Actuals, Interpolation, and Residuals \tabularnewline
Time or Index & Actuals & InterpolationForecast & ResidualsPrediction Error \tabularnewline
1 &  5.9 &  5.663 &  0.2371 \tabularnewline
2 &  5.438 &  5.663 & -0.2249 \tabularnewline
3 &  5.71 &  5.663 &  0.04708 \tabularnewline
4 &  5.481 &  5.663 & -0.1819 \tabularnewline
5 &  5.927 &  5.959 & -0.0324 \tabularnewline
6 &  4.804 &  5.663 & -0.8589 \tabularnewline
7 &  6.512 &  5.959 &  0.5526 \tabularnewline
8 &  5.808 &  5.971 & -0.1633 \tabularnewline
9 &  5.737 &  5.959 & -0.2224 \tabularnewline
10 &  6.382 &  5.971 &  0.4108 \tabularnewline
11 &  5.743 &  5.971 & -0.2283 \tabularnewline
12 &  6.215 &  5.641 &  0.574 \tabularnewline
13 &  5.257 &  5.663 & -0.4059 \tabularnewline
14 &  6.62 &  5.959 &  0.6606 \tabularnewline
15 &  5.714 &  5.959 & -0.2454 \tabularnewline
16 &  5.595 &  5.663 & -0.06792 \tabularnewline
17 &  5.808 &  5.959 & -0.1514 \tabularnewline
18 &  5.9 &  5.663 &  0.2371 \tabularnewline
19 &  5.298 &  5.663 & -0.3649 \tabularnewline
20 &  5.784 &  5.663 &  0.1211 \tabularnewline
21 &  6.225 &  5.959 &  0.2656 \tabularnewline
22 &  5.743 &  5.663 &  0.08008 \tabularnewline
23 &  6.869 &  5.971 &  0.8978 \tabularnewline
24 &  6.122 &  5.663 &  0.4591 \tabularnewline
25 &  6.24 &  5.663 &  0.5771 \tabularnewline
26 &  5.153 &  5.959 & -0.8064 \tabularnewline
27 &  6.569 &  5.959 &  0.6096 \tabularnewline
28 &  6.358 &  5.959 &  0.3986 \tabularnewline
29 &  6.136 &  5.663 &  0.4731 \tabularnewline
30 &  5.927 &  5.959 & -0.0324 \tabularnewline
31 &  6.215 &  5.663 &  0.5521 \tabularnewline
32 &  5.521 &  5.663 & -0.1419 \tabularnewline
33 &  6.016 &  5.641 &  0.375 \tabularnewline
34 &  6.358 &  5.959 &  0.3986 \tabularnewline
35 &  5.521 &  5.663 & -0.1419 \tabularnewline
36 &  6.148 &  5.959 &  0.1886 \tabularnewline
37 &  5.858 &  5.959 & -0.1014 \tabularnewline
38 &  6.324 &  5.959 &  0.3646 \tabularnewline
39 &  5.753 &  5.959 & -0.2064 \tabularnewline
40 &  6.236 &  5.663 &  0.5731 \tabularnewline
41 &  5.991 &  5.959 &  0.0316 \tabularnewline
42 &  5.628 &  5.959 & -0.3314 \tabularnewline
43 &  6.091 &  5.959 &  0.1316 \tabularnewline
44 &  6.109 &  5.663 &  0.4461 \tabularnewline
45 &  5.442 &  5.959 & -0.5174 \tabularnewline
46 &  5.553 &  5.663 & -0.1099 \tabularnewline
47 &  5.617 &  5.959 & -0.3424 \tabularnewline
48 &  6.176 &  5.663 &  0.5131 \tabularnewline
49 &  5.704 &  5.959 & -0.2554 \tabularnewline
50 &  5.545 &  5.959 & -0.4144 \tabularnewline
51 &  5.384 &  5.663 & -0.2789 \tabularnewline
52 &  5.889 &  5.959 & -0.0704 \tabularnewline
53 &  5.165 &  5.959 & -0.7944 \tabularnewline
54 &  5.628 &  5.663 & -0.03492 \tabularnewline
55 &  5.338 &  5.663 & -0.3249 \tabularnewline
56 &  5.308 &  5.663 & -0.3549 \tabularnewline
57 &  5.746 &  5.663 &  0.08308 \tabularnewline
58 &  5.572 &  5.959 & -0.3874 \tabularnewline
59 &  5.624 &  5.959 & -0.3354 \tabularnewline
60 &  5.165 &  5.663 & -0.4979 \tabularnewline
61 &  5.635 &  5.959 & -0.3244 \tabularnewline
62 &  5.858 &  5.959 & -0.1014 \tabularnewline
63 &  5.236 &  5.663 & -0.4269 \tabularnewline
64 &  5.521 &  5.663 & -0.1419 \tabularnewline
65 &  6.551 &  5.959 &  0.5916 \tabularnewline
66 &  6.064 &  5.959 &  0.1046 \tabularnewline
67 &  6.729 &  5.959 &  0.7696 \tabularnewline
68 &  6.389 &  5.959 &  0.4296 \tabularnewline
69 &  6.358 &  5.959 &  0.3986 \tabularnewline
70 &  6.225 &  5.959 &  0.2656 \tabularnewline
71 &  5.298 &  5.663 & -0.3649 \tabularnewline
72 &  5.966 &  5.663 &  0.3031 \tabularnewline
73 &  5.897 &  5.959 & -0.0624 \tabularnewline
74 &  5.583 &  5.959 & -0.3764 \tabularnewline
75 &  5.521 &  5.663 & -0.1419 \tabularnewline
76 &  5.762 &  5.663 &  0.09908 \tabularnewline
77 &  5.371 &  5.959 & -0.5884 \tabularnewline
78 &  5.743 &  5.959 & -0.2164 \tabularnewline
79 &  6.358 &  5.663 &  0.6951 \tabularnewline
80 &  5.481 &  5.663 & -0.1819 \tabularnewline
81 &  5.743 &  5.959 & -0.2164 \tabularnewline
82 &  6.109 &  5.663 &  0.4461 \tabularnewline
83 &  5.298 &  5.663 & -0.3649 \tabularnewline
84 &  5.416 &  5.663 & -0.2469 \tabularnewline
85 &  5.846 &  5.663 &  0.1831 \tabularnewline
86 &  5.823 &  5.663 &  0.1601 \tabularnewline
87 &  6.685 &  5.959 &  0.7256 \tabularnewline
88 &  5.421 &  5.959 & -0.5384 \tabularnewline
89 &  5.371 &  5.663 & -0.2919 \tabularnewline
90 &  5.521 &  5.663 & -0.1419 \tabularnewline
91 &  5.991 &  5.663 &  0.3281 \tabularnewline
92 &  6.609 &  5.663 &  0.9461 \tabularnewline
93 &  5.73 &  5.641 &  0.089 \tabularnewline
94 &  5.7 &  5.641 &  0.059 \tabularnewline
95 &  5.505 &  5.959 & -0.4544 \tabularnewline
96 &  5.557 &  5.971 & -0.4143 \tabularnewline
97 &  5.371 &  5.971 & -0.6002 \tabularnewline
98 &  6.438 &  5.971 &  0.4667 \tabularnewline
99 &  6.31 &  5.959 &  0.3506 \tabularnewline
100 &  5.73 &  5.641 &  0.089 \tabularnewline
101 &  6.153 &  5.959 &  0.1936 \tabularnewline
102 &  5.991 &  5.959 &  0.0316 \tabularnewline
103 &  5.075 &  5.641 & -0.566 \tabularnewline
104 &  5.823 &  5.959 & -0.1364 \tabularnewline
105 &  5.198 &  5.663 & -0.4649 \tabularnewline
106 &  5.011 &  5.663 & -0.6519 \tabularnewline
107 &  5.165 &  5.641 & -0.476 \tabularnewline
108 &  5.497 &  5.641 & -0.144 \tabularnewline
109 &  5.602 &  5.971 & -0.3693 \tabularnewline
110 &  6.182 &  5.959 &  0.2226 \tabularnewline
111 &  5.817 &  5.959 & -0.1424 \tabularnewline
112 &  5.056 &  5.663 & -0.6069 \tabularnewline
113 &  6.059 &  5.959 &  0.0996 \tabularnewline
114 &  5.991 &  5.959 &  0.0316 \tabularnewline
115 &  5.165 &  5.663 & -0.4979 \tabularnewline
116 &  6.059 &  5.663 &  0.3961 \tabularnewline
117 &  6.438 &  5.959 &  0.4786 \tabularnewline
118 &  6.068 &  5.959 &  0.1086 \tabularnewline
119 &  5.561 &  5.663 & -0.1019 \tabularnewline
120 &  6.324 &  5.663 &  0.6611 \tabularnewline
\hline
\end{tabular}
%Source: https://freestatistics.org/blog/index.php?pk=309365&T=5

[TABLE]
[ROW][C]Multiple Linear Regression - Actuals, Interpolation, and Residuals[/C][/ROW]
[ROW][C]Time or Index[/C][C]Actuals[/C][C]InterpolationForecast[/C][C]ResidualsPrediction Error[/C][/ROW]
[ROW][C]1[/C][C] 5.9[/C][C] 5.663[/C][C] 0.2371[/C][/ROW]
[ROW][C]2[/C][C] 5.438[/C][C] 5.663[/C][C]-0.2249[/C][/ROW]
[ROW][C]3[/C][C] 5.71[/C][C] 5.663[/C][C] 0.04708[/C][/ROW]
[ROW][C]4[/C][C] 5.481[/C][C] 5.663[/C][C]-0.1819[/C][/ROW]
[ROW][C]5[/C][C] 5.927[/C][C] 5.959[/C][C]-0.0324[/C][/ROW]
[ROW][C]6[/C][C] 4.804[/C][C] 5.663[/C][C]-0.8589[/C][/ROW]
[ROW][C]7[/C][C] 6.512[/C][C] 5.959[/C][C] 0.5526[/C][/ROW]
[ROW][C]8[/C][C] 5.808[/C][C] 5.971[/C][C]-0.1633[/C][/ROW]
[ROW][C]9[/C][C] 5.737[/C][C] 5.959[/C][C]-0.2224[/C][/ROW]
[ROW][C]10[/C][C] 6.382[/C][C] 5.971[/C][C] 0.4108[/C][/ROW]
[ROW][C]11[/C][C] 5.743[/C][C] 5.971[/C][C]-0.2283[/C][/ROW]
[ROW][C]12[/C][C] 6.215[/C][C] 5.641[/C][C] 0.574[/C][/ROW]
[ROW][C]13[/C][C] 5.257[/C][C] 5.663[/C][C]-0.4059[/C][/ROW]
[ROW][C]14[/C][C] 6.62[/C][C] 5.959[/C][C] 0.6606[/C][/ROW]
[ROW][C]15[/C][C] 5.714[/C][C] 5.959[/C][C]-0.2454[/C][/ROW]
[ROW][C]16[/C][C] 5.595[/C][C] 5.663[/C][C]-0.06792[/C][/ROW]
[ROW][C]17[/C][C] 5.808[/C][C] 5.959[/C][C]-0.1514[/C][/ROW]
[ROW][C]18[/C][C] 5.9[/C][C] 5.663[/C][C] 0.2371[/C][/ROW]
[ROW][C]19[/C][C] 5.298[/C][C] 5.663[/C][C]-0.3649[/C][/ROW]
[ROW][C]20[/C][C] 5.784[/C][C] 5.663[/C][C] 0.1211[/C][/ROW]
[ROW][C]21[/C][C] 6.225[/C][C] 5.959[/C][C] 0.2656[/C][/ROW]
[ROW][C]22[/C][C] 5.743[/C][C] 5.663[/C][C] 0.08008[/C][/ROW]
[ROW][C]23[/C][C] 6.869[/C][C] 5.971[/C][C] 0.8978[/C][/ROW]
[ROW][C]24[/C][C] 6.122[/C][C] 5.663[/C][C] 0.4591[/C][/ROW]
[ROW][C]25[/C][C] 6.24[/C][C] 5.663[/C][C] 0.5771[/C][/ROW]
[ROW][C]26[/C][C] 5.153[/C][C] 5.959[/C][C]-0.8064[/C][/ROW]
[ROW][C]27[/C][C] 6.569[/C][C] 5.959[/C][C] 0.6096[/C][/ROW]
[ROW][C]28[/C][C] 6.358[/C][C] 5.959[/C][C] 0.3986[/C][/ROW]
[ROW][C]29[/C][C] 6.136[/C][C] 5.663[/C][C] 0.4731[/C][/ROW]
[ROW][C]30[/C][C] 5.927[/C][C] 5.959[/C][C]-0.0324[/C][/ROW]
[ROW][C]31[/C][C] 6.215[/C][C] 5.663[/C][C] 0.5521[/C][/ROW]
[ROW][C]32[/C][C] 5.521[/C][C] 5.663[/C][C]-0.1419[/C][/ROW]
[ROW][C]33[/C][C] 6.016[/C][C] 5.641[/C][C] 0.375[/C][/ROW]
[ROW][C]34[/C][C] 6.358[/C][C] 5.959[/C][C] 0.3986[/C][/ROW]
[ROW][C]35[/C][C] 5.521[/C][C] 5.663[/C][C]-0.1419[/C][/ROW]
[ROW][C]36[/C][C] 6.148[/C][C] 5.959[/C][C] 0.1886[/C][/ROW]
[ROW][C]37[/C][C] 5.858[/C][C] 5.959[/C][C]-0.1014[/C][/ROW]
[ROW][C]38[/C][C] 6.324[/C][C] 5.959[/C][C] 0.3646[/C][/ROW]
[ROW][C]39[/C][C] 5.753[/C][C] 5.959[/C][C]-0.2064[/C][/ROW]
[ROW][C]40[/C][C] 6.236[/C][C] 5.663[/C][C] 0.5731[/C][/ROW]
[ROW][C]41[/C][C] 5.991[/C][C] 5.959[/C][C] 0.0316[/C][/ROW]
[ROW][C]42[/C][C] 5.628[/C][C] 5.959[/C][C]-0.3314[/C][/ROW]
[ROW][C]43[/C][C] 6.091[/C][C] 5.959[/C][C] 0.1316[/C][/ROW]
[ROW][C]44[/C][C] 6.109[/C][C] 5.663[/C][C] 0.4461[/C][/ROW]
[ROW][C]45[/C][C] 5.442[/C][C] 5.959[/C][C]-0.5174[/C][/ROW]
[ROW][C]46[/C][C] 5.553[/C][C] 5.663[/C][C]-0.1099[/C][/ROW]
[ROW][C]47[/C][C] 5.617[/C][C] 5.959[/C][C]-0.3424[/C][/ROW]
[ROW][C]48[/C][C] 6.176[/C][C] 5.663[/C][C] 0.5131[/C][/ROW]
[ROW][C]49[/C][C] 5.704[/C][C] 5.959[/C][C]-0.2554[/C][/ROW]
[ROW][C]50[/C][C] 5.545[/C][C] 5.959[/C][C]-0.4144[/C][/ROW]
[ROW][C]51[/C][C] 5.384[/C][C] 5.663[/C][C]-0.2789[/C][/ROW]
[ROW][C]52[/C][C] 5.889[/C][C] 5.959[/C][C]-0.0704[/C][/ROW]
[ROW][C]53[/C][C] 5.165[/C][C] 5.959[/C][C]-0.7944[/C][/ROW]
[ROW][C]54[/C][C] 5.628[/C][C] 5.663[/C][C]-0.03492[/C][/ROW]
[ROW][C]55[/C][C] 5.338[/C][C] 5.663[/C][C]-0.3249[/C][/ROW]
[ROW][C]56[/C][C] 5.308[/C][C] 5.663[/C][C]-0.3549[/C][/ROW]
[ROW][C]57[/C][C] 5.746[/C][C] 5.663[/C][C] 0.08308[/C][/ROW]
[ROW][C]58[/C][C] 5.572[/C][C] 5.959[/C][C]-0.3874[/C][/ROW]
[ROW][C]59[/C][C] 5.624[/C][C] 5.959[/C][C]-0.3354[/C][/ROW]
[ROW][C]60[/C][C] 5.165[/C][C] 5.663[/C][C]-0.4979[/C][/ROW]
[ROW][C]61[/C][C] 5.635[/C][C] 5.959[/C][C]-0.3244[/C][/ROW]
[ROW][C]62[/C][C] 5.858[/C][C] 5.959[/C][C]-0.1014[/C][/ROW]
[ROW][C]63[/C][C] 5.236[/C][C] 5.663[/C][C]-0.4269[/C][/ROW]
[ROW][C]64[/C][C] 5.521[/C][C] 5.663[/C][C]-0.1419[/C][/ROW]
[ROW][C]65[/C][C] 6.551[/C][C] 5.959[/C][C] 0.5916[/C][/ROW]
[ROW][C]66[/C][C] 6.064[/C][C] 5.959[/C][C] 0.1046[/C][/ROW]
[ROW][C]67[/C][C] 6.729[/C][C] 5.959[/C][C] 0.7696[/C][/ROW]
[ROW][C]68[/C][C] 6.389[/C][C] 5.959[/C][C] 0.4296[/C][/ROW]
[ROW][C]69[/C][C] 6.358[/C][C] 5.959[/C][C] 0.3986[/C][/ROW]
[ROW][C]70[/C][C] 6.225[/C][C] 5.959[/C][C] 0.2656[/C][/ROW]
[ROW][C]71[/C][C] 5.298[/C][C] 5.663[/C][C]-0.3649[/C][/ROW]
[ROW][C]72[/C][C] 5.966[/C][C] 5.663[/C][C] 0.3031[/C][/ROW]
[ROW][C]73[/C][C] 5.897[/C][C] 5.959[/C][C]-0.0624[/C][/ROW]
[ROW][C]74[/C][C] 5.583[/C][C] 5.959[/C][C]-0.3764[/C][/ROW]
[ROW][C]75[/C][C] 5.521[/C][C] 5.663[/C][C]-0.1419[/C][/ROW]
[ROW][C]76[/C][C] 5.762[/C][C] 5.663[/C][C] 0.09908[/C][/ROW]
[ROW][C]77[/C][C] 5.371[/C][C] 5.959[/C][C]-0.5884[/C][/ROW]
[ROW][C]78[/C][C] 5.743[/C][C] 5.959[/C][C]-0.2164[/C][/ROW]
[ROW][C]79[/C][C] 6.358[/C][C] 5.663[/C][C] 0.6951[/C][/ROW]
[ROW][C]80[/C][C] 5.481[/C][C] 5.663[/C][C]-0.1819[/C][/ROW]
[ROW][C]81[/C][C] 5.743[/C][C] 5.959[/C][C]-0.2164[/C][/ROW]
[ROW][C]82[/C][C] 6.109[/C][C] 5.663[/C][C] 0.4461[/C][/ROW]
[ROW][C]83[/C][C] 5.298[/C][C] 5.663[/C][C]-0.3649[/C][/ROW]
[ROW][C]84[/C][C] 5.416[/C][C] 5.663[/C][C]-0.2469[/C][/ROW]
[ROW][C]85[/C][C] 5.846[/C][C] 5.663[/C][C] 0.1831[/C][/ROW]
[ROW][C]86[/C][C] 5.823[/C][C] 5.663[/C][C] 0.1601[/C][/ROW]
[ROW][C]87[/C][C] 6.685[/C][C] 5.959[/C][C] 0.7256[/C][/ROW]
[ROW][C]88[/C][C] 5.421[/C][C] 5.959[/C][C]-0.5384[/C][/ROW]
[ROW][C]89[/C][C] 5.371[/C][C] 5.663[/C][C]-0.2919[/C][/ROW]
[ROW][C]90[/C][C] 5.521[/C][C] 5.663[/C][C]-0.1419[/C][/ROW]
[ROW][C]91[/C][C] 5.991[/C][C] 5.663[/C][C] 0.3281[/C][/ROW]
[ROW][C]92[/C][C] 6.609[/C][C] 5.663[/C][C] 0.9461[/C][/ROW]
[ROW][C]93[/C][C] 5.73[/C][C] 5.641[/C][C] 0.089[/C][/ROW]
[ROW][C]94[/C][C] 5.7[/C][C] 5.641[/C][C] 0.059[/C][/ROW]
[ROW][C]95[/C][C] 5.505[/C][C] 5.959[/C][C]-0.4544[/C][/ROW]
[ROW][C]96[/C][C] 5.557[/C][C] 5.971[/C][C]-0.4143[/C][/ROW]
[ROW][C]97[/C][C] 5.371[/C][C] 5.971[/C][C]-0.6002[/C][/ROW]
[ROW][C]98[/C][C] 6.438[/C][C] 5.971[/C][C] 0.4667[/C][/ROW]
[ROW][C]99[/C][C] 6.31[/C][C] 5.959[/C][C] 0.3506[/C][/ROW]
[ROW][C]100[/C][C] 5.73[/C][C] 5.641[/C][C] 0.089[/C][/ROW]
[ROW][C]101[/C][C] 6.153[/C][C] 5.959[/C][C] 0.1936[/C][/ROW]
[ROW][C]102[/C][C] 5.991[/C][C] 5.959[/C][C] 0.0316[/C][/ROW]
[ROW][C]103[/C][C] 5.075[/C][C] 5.641[/C][C]-0.566[/C][/ROW]
[ROW][C]104[/C][C] 5.823[/C][C] 5.959[/C][C]-0.1364[/C][/ROW]
[ROW][C]105[/C][C] 5.198[/C][C] 5.663[/C][C]-0.4649[/C][/ROW]
[ROW][C]106[/C][C] 5.011[/C][C] 5.663[/C][C]-0.6519[/C][/ROW]
[ROW][C]107[/C][C] 5.165[/C][C] 5.641[/C][C]-0.476[/C][/ROW]
[ROW][C]108[/C][C] 5.497[/C][C] 5.641[/C][C]-0.144[/C][/ROW]
[ROW][C]109[/C][C] 5.602[/C][C] 5.971[/C][C]-0.3693[/C][/ROW]
[ROW][C]110[/C][C] 6.182[/C][C] 5.959[/C][C] 0.2226[/C][/ROW]
[ROW][C]111[/C][C] 5.817[/C][C] 5.959[/C][C]-0.1424[/C][/ROW]
[ROW][C]112[/C][C] 5.056[/C][C] 5.663[/C][C]-0.6069[/C][/ROW]
[ROW][C]113[/C][C] 6.059[/C][C] 5.959[/C][C] 0.0996[/C][/ROW]
[ROW][C]114[/C][C] 5.991[/C][C] 5.959[/C][C] 0.0316[/C][/ROW]
[ROW][C]115[/C][C] 5.165[/C][C] 5.663[/C][C]-0.4979[/C][/ROW]
[ROW][C]116[/C][C] 6.059[/C][C] 5.663[/C][C] 0.3961[/C][/ROW]
[ROW][C]117[/C][C] 6.438[/C][C] 5.959[/C][C] 0.4786[/C][/ROW]
[ROW][C]118[/C][C] 6.068[/C][C] 5.959[/C][C] 0.1086[/C][/ROW]
[ROW][C]119[/C][C] 5.561[/C][C] 5.663[/C][C]-0.1019[/C][/ROW]
[ROW][C]120[/C][C] 6.324[/C][C] 5.663[/C][C] 0.6611[/C][/ROW]
[/TABLE]
Source: https://freestatistics.org/blog/index.php?pk=309365&T=5

Globally Unique Identifier (entire table): ba.freestatistics.org/blog/index.php?pk=309365&T=5

As an alternative you can also use a QR Code:  

The GUIDs for individual cells are displayed in the table below:

Multiple Linear Regression - Actuals, Interpolation, and Residuals
Time or IndexActualsInterpolationForecastResidualsPrediction Error
1 5.9 5.663 0.2371
2 5.438 5.663-0.2249
3 5.71 5.663 0.04708
4 5.481 5.663-0.1819
5 5.927 5.959-0.0324
6 4.804 5.663-0.8589
7 6.512 5.959 0.5526
8 5.808 5.971-0.1633
9 5.737 5.959-0.2224
10 6.382 5.971 0.4108
11 5.743 5.971-0.2283
12 6.215 5.641 0.574
13 5.257 5.663-0.4059
14 6.62 5.959 0.6606
15 5.714 5.959-0.2454
16 5.595 5.663-0.06792
17 5.808 5.959-0.1514
18 5.9 5.663 0.2371
19 5.298 5.663-0.3649
20 5.784 5.663 0.1211
21 6.225 5.959 0.2656
22 5.743 5.663 0.08008
23 6.869 5.971 0.8978
24 6.122 5.663 0.4591
25 6.24 5.663 0.5771
26 5.153 5.959-0.8064
27 6.569 5.959 0.6096
28 6.358 5.959 0.3986
29 6.136 5.663 0.4731
30 5.927 5.959-0.0324
31 6.215 5.663 0.5521
32 5.521 5.663-0.1419
33 6.016 5.641 0.375
34 6.358 5.959 0.3986
35 5.521 5.663-0.1419
36 6.148 5.959 0.1886
37 5.858 5.959-0.1014
38 6.324 5.959 0.3646
39 5.753 5.959-0.2064
40 6.236 5.663 0.5731
41 5.991 5.959 0.0316
42 5.628 5.959-0.3314
43 6.091 5.959 0.1316
44 6.109 5.663 0.4461
45 5.442 5.959-0.5174
46 5.553 5.663-0.1099
47 5.617 5.959-0.3424
48 6.176 5.663 0.5131
49 5.704 5.959-0.2554
50 5.545 5.959-0.4144
51 5.384 5.663-0.2789
52 5.889 5.959-0.0704
53 5.165 5.959-0.7944
54 5.628 5.663-0.03492
55 5.338 5.663-0.3249
56 5.308 5.663-0.3549
57 5.746 5.663 0.08308
58 5.572 5.959-0.3874
59 5.624 5.959-0.3354
60 5.165 5.663-0.4979
61 5.635 5.959-0.3244
62 5.858 5.959-0.1014
63 5.236 5.663-0.4269
64 5.521 5.663-0.1419
65 6.551 5.959 0.5916
66 6.064 5.959 0.1046
67 6.729 5.959 0.7696
68 6.389 5.959 0.4296
69 6.358 5.959 0.3986
70 6.225 5.959 0.2656
71 5.298 5.663-0.3649
72 5.966 5.663 0.3031
73 5.897 5.959-0.0624
74 5.583 5.959-0.3764
75 5.521 5.663-0.1419
76 5.762 5.663 0.09908
77 5.371 5.959-0.5884
78 5.743 5.959-0.2164
79 6.358 5.663 0.6951
80 5.481 5.663-0.1819
81 5.743 5.959-0.2164
82 6.109 5.663 0.4461
83 5.298 5.663-0.3649
84 5.416 5.663-0.2469
85 5.846 5.663 0.1831
86 5.823 5.663 0.1601
87 6.685 5.959 0.7256
88 5.421 5.959-0.5384
89 5.371 5.663-0.2919
90 5.521 5.663-0.1419
91 5.991 5.663 0.3281
92 6.609 5.663 0.9461
93 5.73 5.641 0.089
94 5.7 5.641 0.059
95 5.505 5.959-0.4544
96 5.557 5.971-0.4143
97 5.371 5.971-0.6002
98 6.438 5.971 0.4667
99 6.31 5.959 0.3506
100 5.73 5.641 0.089
101 6.153 5.959 0.1936
102 5.991 5.959 0.0316
103 5.075 5.641-0.566
104 5.823 5.959-0.1364
105 5.198 5.663-0.4649
106 5.011 5.663-0.6519
107 5.165 5.641-0.476
108 5.497 5.641-0.144
109 5.602 5.971-0.3693
110 6.182 5.959 0.2226
111 5.817 5.959-0.1424
112 5.056 5.663-0.6069
113 6.059 5.959 0.0996
114 5.991 5.959 0.0316
115 5.165 5.663-0.4979
116 6.059 5.663 0.3961
117 6.438 5.959 0.4786
118 6.068 5.959 0.1086
119 5.561 5.663-0.1019
120 6.324 5.663 0.6611


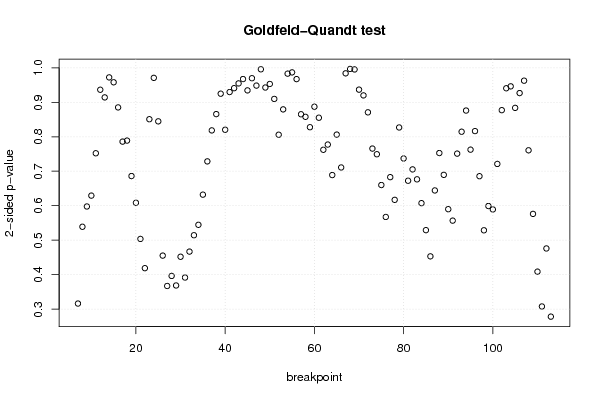
Goldfeld-Quandt test for Heteroskedasticity
p-valuesAlternative Hypothesis
breakpoint indexgreater2-sidedless
7 0.8418 0.3163 0.1582
8 0.7305 0.539 0.2695
9 0.7011 0.5978 0.2989
10 0.6853 0.6293 0.3147
11 0.6239 0.7521 0.3761
12 0.5319 0.9363 0.4681
13 0.457 0.9141 0.543
14 0.514 0.9721 0.486
15 0.5211 0.9579 0.4789
16 0.4425 0.8851 0.5575
17 0.3929 0.7859 0.6071
18 0.3944 0.7889 0.6056
19 0.343 0.6861 0.657
20 0.3042 0.6085 0.6958
21 0.2519 0.5038 0.7481
22 0.2095 0.419 0.7905
23 0.4254 0.8508 0.5746
24 0.4854 0.9708 0.5146
25 0.5776 0.8447 0.4224
26 0.7723 0.4554 0.2277
27 0.8164 0.3673 0.1836
28 0.8018 0.3964 0.1982
29 0.8156 0.3688 0.1844
30 0.774 0.452 0.226
31 0.8041 0.3918 0.1959
32 0.7665 0.467 0.2335
33 0.7428 0.5144 0.2572
34 0.7277 0.5446 0.2723
35 0.684 0.6321 0.316
36 0.6357 0.7286 0.3643
37 0.5908 0.8184 0.4092
38 0.5672 0.8657 0.4328
39 0.5376 0.9248 0.4624
40 0.5899 0.8202 0.4101
41 0.5352 0.9296 0.4648
42 0.5296 0.9408 0.4704
43 0.4773 0.9547 0.5227
44 0.4837 0.9673 0.5163
45 0.5328 0.9345 0.4672
46 0.4848 0.9697 0.5152
47 0.4742 0.9483 0.5258
48 0.5022 0.9956 0.4978
49 0.4714 0.9428 0.5286
50 0.4765 0.953 0.5235
51 0.4548 0.9096 0.5452
52 0.4029 0.8058 0.5971
53 0.5603 0.8793 0.4397
54 0.5085 0.983 0.4915
55 0.4933 0.9866 0.5067
56 0.4836 0.9671 0.5164
57 0.4326 0.8652 0.5674
58 0.4289 0.8578 0.5711
59 0.4138 0.8276 0.5862
60 0.4435 0.8871 0.5565
61 0.4275 0.8551 0.5725
62 0.3811 0.7622 0.6189
63 0.3887 0.7774 0.6113
64 0.3445 0.6889 0.6555
65 0.4031 0.8062 0.5969
66 0.3555 0.7109 0.6445
67 0.492 0.9839 0.508
68 0.4983 0.9966 0.5017
69 0.4976 0.9952 0.5024
70 0.4683 0.9366 0.5317
71 0.46 0.9199 0.54
72 0.4354 0.8708 0.5646
73 0.3829 0.7657 0.6171
74 0.3746 0.7493 0.6254
75 0.33 0.66 0.67
76 0.2837 0.5674 0.7163
77 0.3414 0.6828 0.6586
78 0.3085 0.6171 0.6915
79 0.4134 0.8269 0.5866
80 0.3685 0.737 0.6315
81 0.3362 0.6725 0.6638
82 0.3527 0.7054 0.6473
83 0.3383 0.6766 0.6617
84 0.3037 0.6075 0.6963
85 0.2646 0.5292 0.7354
86 0.2266 0.4532 0.7734
87 0.3221 0.6443 0.6779
88 0.3764 0.7527 0.6236
89 0.3448 0.6895 0.6552
90 0.295 0.5899 0.705
91 0.2784 0.5568 0.7216
92 0.6245 0.7511 0.3755
93 0.5927 0.8145 0.4073
94 0.562 0.8759 0.438
95 0.6187 0.7625 0.3813
96 0.5918 0.8164 0.4082
97 0.6572 0.6856 0.3428
98 0.7356 0.5288 0.2644
99 0.7004 0.5991 0.2996
100 0.7054 0.5892 0.2946
101 0.6394 0.7212 0.3606
102 0.5615 0.877 0.4385
103 0.5297 0.9406 0.4703
104 0.4731 0.9462 0.5269
105 0.4419 0.8837 0.5582
106 0.5367 0.9266 0.4633
107 0.4813 0.9625 0.5187
108 0.3804 0.7607 0.6196
109 0.2881 0.5762 0.7119
110 0.2044 0.4088 0.7956
111 0.1539 0.3078 0.8461
112 0.238 0.4761 0.762
113 0.1392 0.2784 0.8608

\begin{tabular}{lllllllll}
\hline
Goldfeld-Quandt test for Heteroskedasticity \tabularnewline
p-values & Alternative Hypothesis \tabularnewline
breakpoint index & greater & 2-sided & less \tabularnewline
7 &  0.8418 &  0.3163 &  0.1582 \tabularnewline
8 &  0.7305 &  0.539 &  0.2695 \tabularnewline
9 &  0.7011 &  0.5978 &  0.2989 \tabularnewline
10 &  0.6853 &  0.6293 &  0.3147 \tabularnewline
11 &  0.6239 &  0.7521 &  0.3761 \tabularnewline
12 &  0.5319 &  0.9363 &  0.4681 \tabularnewline
13 &  0.457 &  0.9141 &  0.543 \tabularnewline
14 &  0.514 &  0.9721 &  0.486 \tabularnewline
15 &  0.5211 &  0.9579 &  0.4789 \tabularnewline
16 &  0.4425 &  0.8851 &  0.5575 \tabularnewline
17 &  0.3929 &  0.7859 &  0.6071 \tabularnewline
18 &  0.3944 &  0.7889 &  0.6056 \tabularnewline
19 &  0.343 &  0.6861 &  0.657 \tabularnewline
20 &  0.3042 &  0.6085 &  0.6958 \tabularnewline
21 &  0.2519 &  0.5038 &  0.7481 \tabularnewline
22 &  0.2095 &  0.419 &  0.7905 \tabularnewline
23 &  0.4254 &  0.8508 &  0.5746 \tabularnewline
24 &  0.4854 &  0.9708 &  0.5146 \tabularnewline
25 &  0.5776 &  0.8447 &  0.4224 \tabularnewline
26 &  0.7723 &  0.4554 &  0.2277 \tabularnewline
27 &  0.8164 &  0.3673 &  0.1836 \tabularnewline
28 &  0.8018 &  0.3964 &  0.1982 \tabularnewline
29 &  0.8156 &  0.3688 &  0.1844 \tabularnewline
30 &  0.774 &  0.452 &  0.226 \tabularnewline
31 &  0.8041 &  0.3918 &  0.1959 \tabularnewline
32 &  0.7665 &  0.467 &  0.2335 \tabularnewline
33 &  0.7428 &  0.5144 &  0.2572 \tabularnewline
34 &  0.7277 &  0.5446 &  0.2723 \tabularnewline
35 &  0.684 &  0.6321 &  0.316 \tabularnewline
36 &  0.6357 &  0.7286 &  0.3643 \tabularnewline
37 &  0.5908 &  0.8184 &  0.4092 \tabularnewline
38 &  0.5672 &  0.8657 &  0.4328 \tabularnewline
39 &  0.5376 &  0.9248 &  0.4624 \tabularnewline
40 &  0.5899 &  0.8202 &  0.4101 \tabularnewline
41 &  0.5352 &  0.9296 &  0.4648 \tabularnewline
42 &  0.5296 &  0.9408 &  0.4704 \tabularnewline
43 &  0.4773 &  0.9547 &  0.5227 \tabularnewline
44 &  0.4837 &  0.9673 &  0.5163 \tabularnewline
45 &  0.5328 &  0.9345 &  0.4672 \tabularnewline
46 &  0.4848 &  0.9697 &  0.5152 \tabularnewline
47 &  0.4742 &  0.9483 &  0.5258 \tabularnewline
48 &  0.5022 &  0.9956 &  0.4978 \tabularnewline
49 &  0.4714 &  0.9428 &  0.5286 \tabularnewline
50 &  0.4765 &  0.953 &  0.5235 \tabularnewline
51 &  0.4548 &  0.9096 &  0.5452 \tabularnewline
52 &  0.4029 &  0.8058 &  0.5971 \tabularnewline
53 &  0.5603 &  0.8793 &  0.4397 \tabularnewline
54 &  0.5085 &  0.983 &  0.4915 \tabularnewline
55 &  0.4933 &  0.9866 &  0.5067 \tabularnewline
56 &  0.4836 &  0.9671 &  0.5164 \tabularnewline
57 &  0.4326 &  0.8652 &  0.5674 \tabularnewline
58 &  0.4289 &  0.8578 &  0.5711 \tabularnewline
59 &  0.4138 &  0.8276 &  0.5862 \tabularnewline
60 &  0.4435 &  0.8871 &  0.5565 \tabularnewline
61 &  0.4275 &  0.8551 &  0.5725 \tabularnewline
62 &  0.3811 &  0.7622 &  0.6189 \tabularnewline
63 &  0.3887 &  0.7774 &  0.6113 \tabularnewline
64 &  0.3445 &  0.6889 &  0.6555 \tabularnewline
65 &  0.4031 &  0.8062 &  0.5969 \tabularnewline
66 &  0.3555 &  0.7109 &  0.6445 \tabularnewline
67 &  0.492 &  0.9839 &  0.508 \tabularnewline
68 &  0.4983 &  0.9966 &  0.5017 \tabularnewline
69 &  0.4976 &  0.9952 &  0.5024 \tabularnewline
70 &  0.4683 &  0.9366 &  0.5317 \tabularnewline
71 &  0.46 &  0.9199 &  0.54 \tabularnewline
72 &  0.4354 &  0.8708 &  0.5646 \tabularnewline
73 &  0.3829 &  0.7657 &  0.6171 \tabularnewline
74 &  0.3746 &  0.7493 &  0.6254 \tabularnewline
75 &  0.33 &  0.66 &  0.67 \tabularnewline
76 &  0.2837 &  0.5674 &  0.7163 \tabularnewline
77 &  0.3414 &  0.6828 &  0.6586 \tabularnewline
78 &  0.3085 &  0.6171 &  0.6915 \tabularnewline
79 &  0.4134 &  0.8269 &  0.5866 \tabularnewline
80 &  0.3685 &  0.737 &  0.6315 \tabularnewline
81 &  0.3362 &  0.6725 &  0.6638 \tabularnewline
82 &  0.3527 &  0.7054 &  0.6473 \tabularnewline
83 &  0.3383 &  0.6766 &  0.6617 \tabularnewline
84 &  0.3037 &  0.6075 &  0.6963 \tabularnewline
85 &  0.2646 &  0.5292 &  0.7354 \tabularnewline
86 &  0.2266 &  0.4532 &  0.7734 \tabularnewline
87 &  0.3221 &  0.6443 &  0.6779 \tabularnewline
88 &  0.3764 &  0.7527 &  0.6236 \tabularnewline
89 &  0.3448 &  0.6895 &  0.6552 \tabularnewline
90 &  0.295 &  0.5899 &  0.705 \tabularnewline
91 &  0.2784 &  0.5568 &  0.7216 \tabularnewline
92 &  0.6245 &  0.7511 &  0.3755 \tabularnewline
93 &  0.5927 &  0.8145 &  0.4073 \tabularnewline
94 &  0.562 &  0.8759 &  0.438 \tabularnewline
95 &  0.6187 &  0.7625 &  0.3813 \tabularnewline
96 &  0.5918 &  0.8164 &  0.4082 \tabularnewline
97 &  0.6572 &  0.6856 &  0.3428 \tabularnewline
98 &  0.7356 &  0.5288 &  0.2644 \tabularnewline
99 &  0.7004 &  0.5991 &  0.2996 \tabularnewline
100 &  0.7054 &  0.5892 &  0.2946 \tabularnewline
101 &  0.6394 &  0.7212 &  0.3606 \tabularnewline
102 &  0.5615 &  0.877 &  0.4385 \tabularnewline
103 &  0.5297 &  0.9406 &  0.4703 \tabularnewline
104 &  0.4731 &  0.9462 &  0.5269 \tabularnewline
105 &  0.4419 &  0.8837 &  0.5582 \tabularnewline
106 &  0.5367 &  0.9266 &  0.4633 \tabularnewline
107 &  0.4813 &  0.9625 &  0.5187 \tabularnewline
108 &  0.3804 &  0.7607 &  0.6196 \tabularnewline
109 &  0.2881 &  0.5762 &  0.7119 \tabularnewline
110 &  0.2044 &  0.4088 &  0.7956 \tabularnewline
111 &  0.1539 &  0.3078 &  0.8461 \tabularnewline
112 &  0.238 &  0.4761 &  0.762 \tabularnewline
113 &  0.1392 &  0.2784 &  0.8608 \tabularnewline
\hline
\end{tabular}
%Source: https://freestatistics.org/blog/index.php?pk=309365&T=6

[TABLE]
[ROW][C]Goldfeld-Quandt test for Heteroskedasticity[/C][/ROW]
[ROW][C]p-values[/C][C]Alternative Hypothesis[/C][/ROW]
[ROW][C]breakpoint index[/C][C]greater[/C][C]2-sided[/C][C]less[/C][/ROW]
[ROW][C]7[/C][C] 0.8418[/C][C] 0.3163[/C][C] 0.1582[/C][/ROW]
[ROW][C]8[/C][C] 0.7305[/C][C] 0.539[/C][C] 0.2695[/C][/ROW]
[ROW][C]9[/C][C] 0.7011[/C][C] 0.5978[/C][C] 0.2989[/C][/ROW]
[ROW][C]10[/C][C] 0.6853[/C][C] 0.6293[/C][C] 0.3147[/C][/ROW]
[ROW][C]11[/C][C] 0.6239[/C][C] 0.7521[/C][C] 0.3761[/C][/ROW]
[ROW][C]12[/C][C] 0.5319[/C][C] 0.9363[/C][C] 0.4681[/C][/ROW]
[ROW][C]13[/C][C] 0.457[/C][C] 0.9141[/C][C] 0.543[/C][/ROW]
[ROW][C]14[/C][C] 0.514[/C][C] 0.9721[/C][C] 0.486[/C][/ROW]
[ROW][C]15[/C][C] 0.5211[/C][C] 0.9579[/C][C] 0.4789[/C][/ROW]
[ROW][C]16[/C][C] 0.4425[/C][C] 0.8851[/C][C] 0.5575[/C][/ROW]
[ROW][C]17[/C][C] 0.3929[/C][C] 0.7859[/C][C] 0.6071[/C][/ROW]
[ROW][C]18[/C][C] 0.3944[/C][C] 0.7889[/C][C] 0.6056[/C][/ROW]
[ROW][C]19[/C][C] 0.343[/C][C] 0.6861[/C][C] 0.657[/C][/ROW]
[ROW][C]20[/C][C] 0.3042[/C][C] 0.6085[/C][C] 0.6958[/C][/ROW]
[ROW][C]21[/C][C] 0.2519[/C][C] 0.5038[/C][C] 0.7481[/C][/ROW]
[ROW][C]22[/C][C] 0.2095[/C][C] 0.419[/C][C] 0.7905[/C][/ROW]
[ROW][C]23[/C][C] 0.4254[/C][C] 0.8508[/C][C] 0.5746[/C][/ROW]
[ROW][C]24[/C][C] 0.4854[/C][C] 0.9708[/C][C] 0.5146[/C][/ROW]
[ROW][C]25[/C][C] 0.5776[/C][C] 0.8447[/C][C] 0.4224[/C][/ROW]
[ROW][C]26[/C][C] 0.7723[/C][C] 0.4554[/C][C] 0.2277[/C][/ROW]
[ROW][C]27[/C][C] 0.8164[/C][C] 0.3673[/C][C] 0.1836[/C][/ROW]
[ROW][C]28[/C][C] 0.8018[/C][C] 0.3964[/C][C] 0.1982[/C][/ROW]
[ROW][C]29[/C][C] 0.8156[/C][C] 0.3688[/C][C] 0.1844[/C][/ROW]
[ROW][C]30[/C][C] 0.774[/C][C] 0.452[/C][C] 0.226[/C][/ROW]
[ROW][C]31[/C][C] 0.8041[/C][C] 0.3918[/C][C] 0.1959[/C][/ROW]
[ROW][C]32[/C][C] 0.7665[/C][C] 0.467[/C][C] 0.2335[/C][/ROW]
[ROW][C]33[/C][C] 0.7428[/C][C] 0.5144[/C][C] 0.2572[/C][/ROW]
[ROW][C]34[/C][C] 0.7277[/C][C] 0.5446[/C][C] 0.2723[/C][/ROW]
[ROW][C]35[/C][C] 0.684[/C][C] 0.6321[/C][C] 0.316[/C][/ROW]
[ROW][C]36[/C][C] 0.6357[/C][C] 0.7286[/C][C] 0.3643[/C][/ROW]
[ROW][C]37[/C][C] 0.5908[/C][C] 0.8184[/C][C] 0.4092[/C][/ROW]
[ROW][C]38[/C][C] 0.5672[/C][C] 0.8657[/C][C] 0.4328[/C][/ROW]
[ROW][C]39[/C][C] 0.5376[/C][C] 0.9248[/C][C] 0.4624[/C][/ROW]
[ROW][C]40[/C][C] 0.5899[/C][C] 0.8202[/C][C] 0.4101[/C][/ROW]
[ROW][C]41[/C][C] 0.5352[/C][C] 0.9296[/C][C] 0.4648[/C][/ROW]
[ROW][C]42[/C][C] 0.5296[/C][C] 0.9408[/C][C] 0.4704[/C][/ROW]
[ROW][C]43[/C][C] 0.4773[/C][C] 0.9547[/C][C] 0.5227[/C][/ROW]
[ROW][C]44[/C][C] 0.4837[/C][C] 0.9673[/C][C] 0.5163[/C][/ROW]
[ROW][C]45[/C][C] 0.5328[/C][C] 0.9345[/C][C] 0.4672[/C][/ROW]
[ROW][C]46[/C][C] 0.4848[/C][C] 0.9697[/C][C] 0.5152[/C][/ROW]
[ROW][C]47[/C][C] 0.4742[/C][C] 0.9483[/C][C] 0.5258[/C][/ROW]
[ROW][C]48[/C][C] 0.5022[/C][C] 0.9956[/C][C] 0.4978[/C][/ROW]
[ROW][C]49[/C][C] 0.4714[/C][C] 0.9428[/C][C] 0.5286[/C][/ROW]
[ROW][C]50[/C][C] 0.4765[/C][C] 0.953[/C][C] 0.5235[/C][/ROW]
[ROW][C]51[/C][C] 0.4548[/C][C] 0.9096[/C][C] 0.5452[/C][/ROW]
[ROW][C]52[/C][C] 0.4029[/C][C] 0.8058[/C][C] 0.5971[/C][/ROW]
[ROW][C]53[/C][C] 0.5603[/C][C] 0.8793[/C][C] 0.4397[/C][/ROW]
[ROW][C]54[/C][C] 0.5085[/C][C] 0.983[/C][C] 0.4915[/C][/ROW]
[ROW][C]55[/C][C] 0.4933[/C][C] 0.9866[/C][C] 0.5067[/C][/ROW]
[ROW][C]56[/C][C] 0.4836[/C][C] 0.9671[/C][C] 0.5164[/C][/ROW]
[ROW][C]57[/C][C] 0.4326[/C][C] 0.8652[/C][C] 0.5674[/C][/ROW]
[ROW][C]58[/C][C] 0.4289[/C][C] 0.8578[/C][C] 0.5711[/C][/ROW]
[ROW][C]59[/C][C] 0.4138[/C][C] 0.8276[/C][C] 0.5862[/C][/ROW]
[ROW][C]60[/C][C] 0.4435[/C][C] 0.8871[/C][C] 0.5565[/C][/ROW]
[ROW][C]61[/C][C] 0.4275[/C][C] 0.8551[/C][C] 0.5725[/C][/ROW]
[ROW][C]62[/C][C] 0.3811[/C][C] 0.7622[/C][C] 0.6189[/C][/ROW]
[ROW][C]63[/C][C] 0.3887[/C][C] 0.7774[/C][C] 0.6113[/C][/ROW]
[ROW][C]64[/C][C] 0.3445[/C][C] 0.6889[/C][C] 0.6555[/C][/ROW]
[ROW][C]65[/C][C] 0.4031[/C][C] 0.8062[/C][C] 0.5969[/C][/ROW]
[ROW][C]66[/C][C] 0.3555[/C][C] 0.7109[/C][C] 0.6445[/C][/ROW]
[ROW][C]67[/C][C] 0.492[/C][C] 0.9839[/C][C] 0.508[/C][/ROW]
[ROW][C]68[/C][C] 0.4983[/C][C] 0.9966[/C][C] 0.5017[/C][/ROW]
[ROW][C]69[/C][C] 0.4976[/C][C] 0.9952[/C][C] 0.5024[/C][/ROW]
[ROW][C]70[/C][C] 0.4683[/C][C] 0.9366[/C][C] 0.5317[/C][/ROW]
[ROW][C]71[/C][C] 0.46[/C][C] 0.9199[/C][C] 0.54[/C][/ROW]
[ROW][C]72[/C][C] 0.4354[/C][C] 0.8708[/C][C] 0.5646[/C][/ROW]
[ROW][C]73[/C][C] 0.3829[/C][C] 0.7657[/C][C] 0.6171[/C][/ROW]
[ROW][C]74[/C][C] 0.3746[/C][C] 0.7493[/C][C] 0.6254[/C][/ROW]
[ROW][C]75[/C][C] 0.33[/C][C] 0.66[/C][C] 0.67[/C][/ROW]
[ROW][C]76[/C][C] 0.2837[/C][C] 0.5674[/C][C] 0.7163[/C][/ROW]
[ROW][C]77[/C][C] 0.3414[/C][C] 0.6828[/C][C] 0.6586[/C][/ROW]
[ROW][C]78[/C][C] 0.3085[/C][C] 0.6171[/C][C] 0.6915[/C][/ROW]
[ROW][C]79[/C][C] 0.4134[/C][C] 0.8269[/C][C] 0.5866[/C][/ROW]
[ROW][C]80[/C][C] 0.3685[/C][C] 0.737[/C][C] 0.6315[/C][/ROW]
[ROW][C]81[/C][C] 0.3362[/C][C] 0.6725[/C][C] 0.6638[/C][/ROW]
[ROW][C]82[/C][C] 0.3527[/C][C] 0.7054[/C][C] 0.6473[/C][/ROW]
[ROW][C]83[/C][C] 0.3383[/C][C] 0.6766[/C][C] 0.6617[/C][/ROW]
[ROW][C]84[/C][C] 0.3037[/C][C] 0.6075[/C][C] 0.6963[/C][/ROW]
[ROW][C]85[/C][C] 0.2646[/C][C] 0.5292[/C][C] 0.7354[/C][/ROW]
[ROW][C]86[/C][C] 0.2266[/C][C] 0.4532[/C][C] 0.7734[/C][/ROW]
[ROW][C]87[/C][C] 0.3221[/C][C] 0.6443[/C][C] 0.6779[/C][/ROW]
[ROW][C]88[/C][C] 0.3764[/C][C] 0.7527[/C][C] 0.6236[/C][/ROW]
[ROW][C]89[/C][C] 0.3448[/C][C] 0.6895[/C][C] 0.6552[/C][/ROW]
[ROW][C]90[/C][C] 0.295[/C][C] 0.5899[/C][C] 0.705[/C][/ROW]
[ROW][C]91[/C][C] 0.2784[/C][C] 0.5568[/C][C] 0.7216[/C][/ROW]
[ROW][C]92[/C][C] 0.6245[/C][C] 0.7511[/C][C] 0.3755[/C][/ROW]
[ROW][C]93[/C][C] 0.5927[/C][C] 0.8145[/C][C] 0.4073[/C][/ROW]
[ROW][C]94[/C][C] 0.562[/C][C] 0.8759[/C][C] 0.438[/C][/ROW]
[ROW][C]95[/C][C] 0.6187[/C][C] 0.7625[/C][C] 0.3813[/C][/ROW]
[ROW][C]96[/C][C] 0.5918[/C][C] 0.8164[/C][C] 0.4082[/C][/ROW]
[ROW][C]97[/C][C] 0.6572[/C][C] 0.6856[/C][C] 0.3428[/C][/ROW]
[ROW][C]98[/C][C] 0.7356[/C][C] 0.5288[/C][C] 0.2644[/C][/ROW]
[ROW][C]99[/C][C] 0.7004[/C][C] 0.5991[/C][C] 0.2996[/C][/ROW]
[ROW][C]100[/C][C] 0.7054[/C][C] 0.5892[/C][C] 0.2946[/C][/ROW]
[ROW][C]101[/C][C] 0.6394[/C][C] 0.7212[/C][C] 0.3606[/C][/ROW]
[ROW][C]102[/C][C] 0.5615[/C][C] 0.877[/C][C] 0.4385[/C][/ROW]
[ROW][C]103[/C][C] 0.5297[/C][C] 0.9406[/C][C] 0.4703[/C][/ROW]
[ROW][C]104[/C][C] 0.4731[/C][C] 0.9462[/C][C] 0.5269[/C][/ROW]
[ROW][C]105[/C][C] 0.4419[/C][C] 0.8837[/C][C] 0.5582[/C][/ROW]
[ROW][C]106[/C][C] 0.5367[/C][C] 0.9266[/C][C] 0.4633[/C][/ROW]
[ROW][C]107[/C][C] 0.4813[/C][C] 0.9625[/C][C] 0.5187[/C][/ROW]
[ROW][C]108[/C][C] 0.3804[/C][C] 0.7607[/C][C] 0.6196[/C][/ROW]
[ROW][C]109[/C][C] 0.2881[/C][C] 0.5762[/C][C] 0.7119[/C][/ROW]
[ROW][C]110[/C][C] 0.2044[/C][C] 0.4088[/C][C] 0.7956[/C][/ROW]
[ROW][C]111[/C][C] 0.1539[/C][C] 0.3078[/C][C] 0.8461[/C][/ROW]
[ROW][C]112[/C][C] 0.238[/C][C] 0.4761[/C][C] 0.762[/C][/ROW]
[ROW][C]113[/C][C] 0.1392[/C][C] 0.2784[/C][C] 0.8608[/C][/ROW]
[/TABLE]
Source: https://freestatistics.org/blog/index.php?pk=309365&T=6

Globally Unique Identifier (entire table): ba.freestatistics.org/blog/index.php?pk=309365&T=6

As an alternative you can also use a QR Code:  

The GUIDs for individual cells are displayed in the table below:

Goldfeld-Quandt test for Heteroskedasticity
p-valuesAlternative Hypothesis
breakpoint indexgreater2-sidedless
7 0.8418 0.3163 0.1582
8 0.7305 0.539 0.2695
9 0.7011 0.5978 0.2989
10 0.6853 0.6293 0.3147
11 0.6239 0.7521 0.3761
12 0.5319 0.9363 0.4681
13 0.457 0.9141 0.543
14 0.514 0.9721 0.486
15 0.5211 0.9579 0.4789
16 0.4425 0.8851 0.5575
17 0.3929 0.7859 0.6071
18 0.3944 0.7889 0.6056
19 0.343 0.6861 0.657
20 0.3042 0.6085 0.6958
21 0.2519 0.5038 0.7481
22 0.2095 0.419 0.7905
23 0.4254 0.8508 0.5746
24 0.4854 0.9708 0.5146
25 0.5776 0.8447 0.4224
26 0.7723 0.4554 0.2277
27 0.8164 0.3673 0.1836
28 0.8018 0.3964 0.1982
29 0.8156 0.3688 0.1844
30 0.774 0.452 0.226
31 0.8041 0.3918 0.1959
32 0.7665 0.467 0.2335
33 0.7428 0.5144 0.2572
34 0.7277 0.5446 0.2723
35 0.684 0.6321 0.316
36 0.6357 0.7286 0.3643
37 0.5908 0.8184 0.4092
38 0.5672 0.8657 0.4328
39 0.5376 0.9248 0.4624
40 0.5899 0.8202 0.4101
41 0.5352 0.9296 0.4648
42 0.5296 0.9408 0.4704
43 0.4773 0.9547 0.5227
44 0.4837 0.9673 0.5163
45 0.5328 0.9345 0.4672
46 0.4848 0.9697 0.5152
47 0.4742 0.9483 0.5258
48 0.5022 0.9956 0.4978
49 0.4714 0.9428 0.5286
50 0.4765 0.953 0.5235
51 0.4548 0.9096 0.5452
52 0.4029 0.8058 0.5971
53 0.5603 0.8793 0.4397
54 0.5085 0.983 0.4915
55 0.4933 0.9866 0.5067
56 0.4836 0.9671 0.5164
57 0.4326 0.8652 0.5674
58 0.4289 0.8578 0.5711
59 0.4138 0.8276 0.5862
60 0.4435 0.8871 0.5565
61 0.4275 0.8551 0.5725
62 0.3811 0.7622 0.6189
63 0.3887 0.7774 0.6113
64 0.3445 0.6889 0.6555
65 0.4031 0.8062 0.5969
66 0.3555 0.7109 0.6445
67 0.492 0.9839 0.508
68 0.4983 0.9966 0.5017
69 0.4976 0.9952 0.5024
70 0.4683 0.9366 0.5317
71 0.46 0.9199 0.54
72 0.4354 0.8708 0.5646
73 0.3829 0.7657 0.6171
74 0.3746 0.7493 0.6254
75 0.33 0.66 0.67
76 0.2837 0.5674 0.7163
77 0.3414 0.6828 0.6586
78 0.3085 0.6171 0.6915
79 0.4134 0.8269 0.5866
80 0.3685 0.737 0.6315
81 0.3362 0.6725 0.6638
82 0.3527 0.7054 0.6473
83 0.3383 0.6766 0.6617
84 0.3037 0.6075 0.6963
85 0.2646 0.5292 0.7354
86 0.2266 0.4532 0.7734
87 0.3221 0.6443 0.6779
88 0.3764 0.7527 0.6236
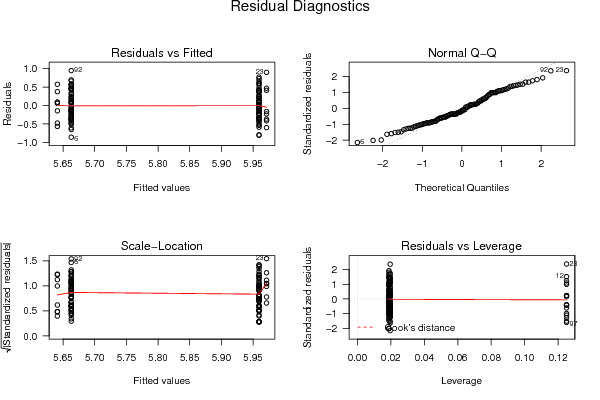
89 0.3448 0.6895 0.6552
90 0.295 0.5899 0.705
91 0.2784 0.5568 0.7216
92 0.6245 0.7511 0.3755
93 0.5927 0.8145 0.4073
94 0.562 0.8759 0.438
95 0.6187 0.7625 0.3813
96 0.5918 0.8164 0.4082
97 0.6572 0.6856 0.3428
98 0.7356 0.5288 0.2644
99 0.7004 0.5991 0.2996
100 0.7054 0.5892 0.2946
101 0.6394 0.7212 0.3606
102 0.5615 0.877 0.4385
103 0.5297 0.9406 0.4703
104 0.4731 0.9462 0.5269
105 0.4419 0.8837 0.5582
106 0.5367 0.9266 0.4633
107 0.4813 0.9625 0.5187
108 0.3804 0.7607 0.6196
109 0.2881 0.5762 0.7119
110 0.2044 0.4088 0.7956
111 0.1539 0.3078 0.8461
112 0.238 0.4761 0.762
113 0.1392 0.2784 0.8608


Meta Analysis of Goldfeld-Quandt test for Heteroskedasticity
Description# significant tests% significant testsOK/NOK
1% type I error level0 0OK
5% type I error level00OK
10% type I error level00OK

\begin{tabular}{lllllllll}
\hline
Meta Analysis of Goldfeld-Quandt test for Heteroskedasticity \tabularnewline
Description & # significant tests & % significant tests & OK/NOK \tabularnewline
1% type I error level & 0 &  0 & OK \tabularnewline
5% type I error level & 0 & 0 & OK \tabularnewline
10% type I error level & 0 & 0 & OK \tabularnewline
\hline
\end{tabular}
%Source: https://freestatistics.org/blog/index.php?pk=309365&T=7

[TABLE]
[ROW][C]Meta Analysis of Goldfeld-Quandt test for Heteroskedasticity[/C][/ROW]
[ROW][C]Description[/C][C]# significant tests[/C][C]% significant tests[/C][C]OK/NOK[/C][/ROW]
[ROW][C]1% type I error level[/C][C]0[/C][C] 0[/C][C]OK[/C][/ROW]
[ROW][C]5% type I error level[/C][C]0[/C][C]0[/C][C]OK[/C][/ROW]
[ROW][C]10% type I error level[/C][C]0[/C][C]0[/C][C]OK[/C][/ROW]
[/TABLE]
Source: https://freestatistics.org/blog/index.php?pk=309365&T=7

Globally Unique Identifier (entire table): ba.freestatistics.org/blog/index.php?pk=309365&T=7

As an alternative you can also use a QR Code:  

The GUIDs for individual cells are displayed in the table below:

Meta Analysis of Goldfeld-Quandt test for Heteroskedasticity
Description# significant tests% significant testsOK/NOK
1% type I error level0 0OK
5% type I error level00OK
10% type I error level00OK


Ramsey RESET F-Test for powers (2 and 3) of fitted values
> reset_test_fitted
	RESET test
data:  mylm
RESET = 0, df1 = 2, df2 = 114, p-value = 1
Ramsey RESET F-Test for powers (2 and 3) of regressors
> reset_test_regressors
	RESET test
data:  mylm
RESET = 0, df1 = 6, df2 = 110, p-value = 1
Ramsey RESET F-Test for powers (2 and 3) of principal components
> reset_test_principal_components
	RESET test
data:  mylm
RESET = 0, df1 = 2, df2 = 114, p-value = 1

\begin{tabular}{lllllllll}
\hline
Ramsey RESET F-Test for powers (2 and 3) of fitted values \tabularnewline
> reset_test_fitted
	RESET test
data:  mylm
RESET = 0, df1 = 2, df2 = 114, p-value = 1
\tabularnewline Ramsey RESET F-Test for powers (2 and 3) of regressors \tabularnewline
> reset_test_regressors
	RESET test
data:  mylm
RESET = 0, df1 = 6, df2 = 110, p-value = 1
\tabularnewline Ramsey RESET F-Test for powers (2 and 3) of principal components \tabularnewline
> reset_test_principal_components
	RESET test
data:  mylm
RESET = 0, df1 = 2, df2 = 114, p-value = 1
\tabularnewline \hline \end{tabular} %Source: https://freestatistics.org/blog/index.php?pk=309365&T=8

[TABLE]
[ROW][C]Ramsey RESET F-Test for powers (2 and 3) of fitted values[/C][/ROW]
[ROW][C]
> reset_test_fitted
	RESET test
data:  mylm
RESET = 0, df1 = 2, df2 = 114, p-value = 1
[/C][/ROW] [ROW][C]Ramsey RESET F-Test for powers (2 and 3) of regressors[/C][/ROW] [ROW][C]
> reset_test_regressors
	RESET test
data:  mylm
RESET = 0, df1 = 6, df2 = 110, p-value = 1
[/C][/ROW] [ROW][C]Ramsey RESET F-Test for powers (2 and 3) of principal components[/C][/ROW] [ROW][C]
> reset_test_principal_components
	RESET test
data:  mylm
RESET = 0, df1 = 2, df2 = 114, p-value = 1
[/C][/ROW] [/TABLE] Source: https://freestatistics.org/blog/index.php?pk=309365&T=8

Globally Unique Identifier (entire table): ba.freestatistics.org/blog/index.php?pk=309365&T=8

As an alternative you can also use a QR Code:  

The GUIDs for individual cells are displayed in the table below:

Ramsey RESET F-Test for powers (2 and 3) of fitted values
> reset_test_fitted
	RESET test
data:  mylm
RESET = 0, df1 = 2, df2 = 114, p-value = 1
Ramsey RESET F-Test for powers (2 and 3) of regressors
> reset_test_regressors
	RESET test
data:  mylm
RESET = 0, df1 = 6, df2 = 110, p-value = 1
Ramsey RESET F-Test for powers (2 and 3) of principal components
> reset_test_principal_components
	RESET test
data:  mylm
RESET = 0, df1 = 2, df2 = 114, p-value = 1


Variance Inflation Factors (Multicollinearity)
> vif
MetropolitanDummy     MarriageDummy       Interaction 
         2.005229          7.497917          8.536479 

\begin{tabular}{lllllllll}
\hline
Variance Inflation Factors (Multicollinearity) \tabularnewline
> vif
MetropolitanDummy     MarriageDummy       Interaction 
         2.005229          7.497917          8.536479 
\tabularnewline \hline \end{tabular} %Source: https://freestatistics.org/blog/index.php?pk=309365&T=9

[TABLE]
[ROW][C]Variance Inflation Factors (Multicollinearity)[/C][/ROW]
[ROW][C]
> vif
MetropolitanDummy     MarriageDummy       Interaction 
         2.005229          7.497917          8.536479 
[/C][/ROW] [/TABLE] Source: https://freestatistics.org/blog/index.php?pk=309365&T=9

Globally Unique Identifier (entire table): ba.freestatistics.org/blog/index.php?pk=309365&T=9

As an alternative you can also use a QR Code:  

The GUIDs for individual cells are displayed in the table below:

Variance Inflation Factors (Multicollinearity)
> vif
MetropolitanDummy     MarriageDummy       Interaction 
         2.005229          7.497917          8.536479 


Parameters (Session):
par1 = 1 ; par2 = Do not include Seasonal Dummies ; par3 = No Linear Trend ; par4 = 0 ; par5 = 0 ; par6 = 12 ;
Parameters (R input):
par1 = 1 ; par2 = Do not include Seasonal Dummies ; par3 = No Linear Trend ; par4 = 0 ; par5 = 0 ; par6 = 12 ;
R code (references can be found in the software module):
par6 <- '12'
par5 <- '0'
par4 <- '0'
par3 <- 'No Linear Trend'
par2 <- 'Do not include Seasonal Dummies'
par1 <- '1'
library(lattice)
library(lmtest)
library(car)
library(MASS)
n25 <- 25 #minimum number of obs. for Goldfeld-Quandt test
mywarning <- ''
par6 <- as.numeric(par6)
if(is.na(par6)) {
par6 <- 12
mywarning = 'Warning: you did not specify the seasonality. The seasonal period was set to s = 12.'
}
par1 <- as.numeric(par1)
if(is.na(par1)) {
par1 <- 1
mywarning = 'Warning: you did not specify the column number of the endogenous series! The first column was selected by default.'
}
if (par4=='') par4 <- 0
par4 <- as.numeric(par4)
if (!is.numeric(par4)) par4 <- 0
if (par5=='') par5 <- 0
par5 <- as.numeric(par5)
if (!is.numeric(par5)) par5 <- 0
x <- na.omit(t(y))
k <- length(x[1,])
n <- length(x[,1])
x1 <- cbind(x[,par1], x[,1:k!=par1])
mycolnames <- c(colnames(x)[par1], colnames(x)[1:k!=par1])
colnames(x1) <- mycolnames #colnames(x)[par1]
x <- x1
if (par3 == 'First Differences'){
(n <- n -1)
x2 <- array(0, dim=c(n,k), dimnames=list(1:n, paste('(1-B)',colnames(x),sep='')))
for (i in 1:n) {
for (j in 1:k) {
x2[i,j] <- x[i+1,j] - x[i,j]
}
}
x <- x2
}
if (par3 == 'Seasonal Differences (s)'){
(n <- n - par6)
x2 <- array(0, dim=c(n,k), dimnames=list(1:n, paste('(1-Bs)',colnames(x),sep='')))
for (i in 1:n) {
for (j in 1:k) {
x2[i,j] <- x[i+par6,j] - x[i,j]
}
}
x <- x2
}
if (par3 == 'First and Seasonal Differences (s)'){
(n <- n -1)
x2 <- array(0, dim=c(n,k), dimnames=list(1:n, paste('(1-B)',colnames(x),sep='')))
for (i in 1:n) {
for (j in 1:k) {
x2[i,j] <- x[i+1,j] - x[i,j]
}
}
x <- x2
(n <- n - par6)
x2 <- array(0, dim=c(n,k), dimnames=list(1:n, paste('(1-Bs)',colnames(x),sep='')))
for (i in 1:n) {
for (j in 1:k) {
x2[i,j] <- x[i+par6,j] - x[i,j]
}
}
x <- x2
}
if(par4 > 0) {
x2 <- array(0, dim=c(n-par4,par4), dimnames=list(1:(n-par4), paste(colnames(x)[par1],'(t-',1:par4,')',sep='')))
for (i in 1:(n-par4)) {
for (j in 1:par4) {
x2[i,j] <- x[i+par4-j,par1]
}
}
x <- cbind(x[(par4+1):n,], x2)
n <- n - par4
}
if(par5 > 0) {
x2 <- array(0, dim=c(n-par5*par6,par5), dimnames=list(1:(n-par5*par6), paste(colnames(x)[par1],'(t-',1:par5,'s)',sep='')))
for (i in 1:(n-par5*par6)) {
for (j in 1:par5) {
x2[i,j] <- x[i+par5*par6-j*par6,par1]
}
}
x <- cbind(x[(par5*par6+1):n,], x2)
n <- n - par5*par6
}
if (par2 == 'Include Seasonal Dummies'){
x2 <- array(0, dim=c(n,par6-1), dimnames=list(1:n, paste('M', seq(1:(par6-1)), sep ='')))
for (i in 1:(par6-1)){
x2[seq(i,n,par6),i] <- 1
}
x <- cbind(x, x2)
}
if (par2 == 'Include Monthly Dummies'){
x2 <- array(0, dim=c(n,11), dimnames=list(1:n, paste('M', seq(1:11), sep ='')))
for (i in 1:11){
x2[seq(i,n,12),i] <- 1
}
x <- cbind(x, x2)
}
if (par2 == 'Include Quarterly Dummies'){
x2 <- array(0, dim=c(n,3), dimnames=list(1:n, paste('Q', seq(1:3), sep ='')))
for (i in 1:3){
x2[seq(i,n,4),i] <- 1
}
x <- cbind(x, x2)
}
(k <- length(x[n,]))
if (par3 == 'Linear Trend'){
x <- cbind(x, c(1:n))
colnames(x)[k+1] <- 't'
}
print(x)
(k <- length(x[n,]))
head(x)
df <- as.data.frame(x)
(mylm <- lm(df))
(mysum <- summary(mylm))
if (n > n25) {
kp3 <- k + 3
nmkm3 <- n - k - 3
gqarr <- array(NA, dim=c(nmkm3-kp3+1,3))
numgqtests <- 0
numsignificant1 <- 0
numsignificant5 <- 0
numsignificant10 <- 0
for (mypoint in kp3:nmkm3) {
j <- 0
numgqtests <- numgqtests + 1
for (myalt in c('greater', 'two.sided', 'less')) {
j <- j + 1
gqarr[mypoint-kp3+1,j] <- gqtest(mylm, point=mypoint, alternative=myalt)$p.value
}
if (gqarr[mypoint-kp3+1,2] < 0.01) numsignificant1 <- numsignificant1 + 1
if (gqarr[mypoint-kp3+1,2] < 0.05) numsignificant5 <- numsignificant5 + 1
if (gqarr[mypoint-kp3+1,2] < 0.10) numsignificant10 <- numsignificant10 + 1
}
gqarr
}
bitmap(file='test0.png')
plot(x[,1], type='l', main='Actuals and Interpolation', ylab='value of Actuals and Interpolation (dots)', xlab='time or index')
points(x[,1]-mysum$resid)
grid()
dev.off()
bitmap(file='test1.png')
plot(mysum$resid, type='b', pch=19, main='Residuals', ylab='value of Residuals', xlab='time or index')
grid()
dev.off()
bitmap(file='test2.png')
sresid <- studres(mylm)
hist(sresid, freq=FALSE, main='Distribution of Studentized Residuals')
xfit<-seq(min(sresid),max(sresid),length=40)
yfit<-dnorm(xfit)
lines(xfit, yfit)
grid()
dev.off()
bitmap(file='test3.png')
densityplot(~mysum$resid,col='black',main='Residual Density Plot', xlab='values of Residuals')
dev.off()
bitmap(file='test4.png')
qqPlot(mylm, main='QQ Plot')
grid()
dev.off()
(myerror <- as.ts(mysum$resid))
bitmap(file='test5.png')
dum <- cbind(lag(myerror,k=1),myerror)
dum
dum1 <- dum[2:length(myerror),]
dum1
z <- as.data.frame(dum1)
print(z)
plot(z,main=paste('Residual Lag plot, lowess, and regression line'), ylab='values of Residuals', xlab='lagged values of Residuals')
lines(lowess(z))
abline(lm(z))
grid()
dev.off()
bitmap(file='test6.png')
acf(mysum$resid, lag.max=length(mysum$resid)/2, main='Residual Autocorrelation Function')
grid()
dev.off()
bitmap(file='test7.png')
pacf(mysum$resid, lag.max=length(mysum$resid)/2, main='Residual Partial Autocorrelation Function')
grid()
dev.off()
bitmap(file='test8.png')
opar <- par(mfrow = c(2,2), oma = c(0, 0, 1.1, 0))
plot(mylm, las = 1, sub='Residual Diagnostics')
par(opar)
dev.off()
if (n > n25) {
bitmap(file='test9.png')
plot(kp3:nmkm3,gqarr[,2], main='Goldfeld-Quandt test',ylab='2-sided p-value',xlab='breakpoint')
grid()
dev.off()
}
load(file='createtable')
a<-table.start()
a<-table.row.start(a)
a<-table.element(a, 'Multiple Linear Regression - Estimated Regression Equation', 1, TRUE)
a<-table.row.end(a)
myeq <- colnames(x)[1]
myeq <- paste(myeq, '[t] = ', sep='')
for (i in 1:k){
if (mysum$coefficients[i,1] > 0) myeq <- paste(myeq, '+', '')
myeq <- paste(myeq, signif(mysum$coefficients[i,1],6), sep=' ')
if (rownames(mysum$coefficients)[i] != '(Intercept)') {
myeq <- paste(myeq, rownames(mysum$coefficients)[i], sep='')
if (rownames(mysum$coefficients)[i] != 't') myeq <- paste(myeq, '[t]', sep='')
}
}
myeq <- paste(myeq, ' + e[t]')
a<-table.row.start(a)
a<-table.element(a, myeq)
a<-table.row.end(a)
a<-table.row.start(a)
a<-table.element(a, mywarning)
a<-table.row.end(a)
a<-table.end(a)
table.save(a,file='mytable1.tab')
a<-table.start()
a<-table.row.start(a)
a<-table.element(a,'Multiple Linear Regression - Ordinary Least Squares', 6, TRUE)
a<-table.row.end(a)
a<-table.row.start(a)
a<-table.element(a,'Variable',header=TRUE)
a<-table.element(a,'Parameter',header=TRUE)
a<-table.element(a,'S.D.',header=TRUE)
a<-table.element(a,'T-STAT
H0: parameter = 0',header=TRUE)
a<-table.element(a,'2-tail p-value',header=TRUE)
a<-table.element(a,'1-tail p-value',header=TRUE)
a<-table.row.end(a)
for (i in 1:k){
a<-table.row.start(a)
a<-table.element(a,rownames(mysum$coefficients)[i],header=TRUE)
a<-table.element(a,formatC(signif(mysum$coefficients[i,1],5),format='g',flag='+'))
a<-table.element(a,formatC(signif(mysum$coefficients[i,2],5),format='g',flag=' '))
a<-table.element(a,formatC(signif(mysum$coefficients[i,3],4),format='e',flag='+'))
a<-table.element(a,formatC(signif(mysum$coefficients[i,4],4),format='g',flag=' '))
a<-table.element(a,formatC(signif(mysum$coefficients[i,4]/2,4),format='g',flag=' '))
a<-table.row.end(a)
}
a<-table.end(a)
table.save(a,file='mytable2.tab')
a<-table.start()
a<-table.row.start(a)
a<-table.element(a, 'Multiple Linear Regression - Regression Statistics', 2, TRUE)
a<-table.row.end(a)
a<-table.row.start(a)
a<-table.element(a, 'Multiple R',1,TRUE)
a<-table.element(a,formatC(signif(sqrt(mysum$r.squared),6),format='g',flag=' '))
a<-table.row.end(a)
a<-table.row.start(a)
a<-table.element(a, 'R-squared',1,TRUE)
a<-table.element(a,formatC(signif(mysum$r.squared,6),format='g',flag=' '))
a<-table.row.end(a)
a<-table.row.start(a)
a<-table.element(a, 'Adjusted R-squared',1,TRUE)
a<-table.element(a,formatC(signif(mysum$adj.r.squared,6),format='g',flag=' '))
a<-table.row.end(a)
a<-table.row.start(a)
a<-table.element(a, 'F-TEST (value)',1,TRUE)
a<-table.element(a,formatC(signif(mysum$fstatistic[1],6),format='g',flag=' '))
a<-table.row.end(a)
a<-table.row.start(a)
a<-table.element(a, 'F-TEST (DF numerator)',1,TRUE)
a<-table.element(a, signif(mysum$fstatistic[2],6))
a<-table.row.end(a)
a<-table.row.start(a)
a<-table.element(a, 'F-TEST (DF denominator)',1,TRUE)
a<-table.element(a, signif(mysum$fstatistic[3],6))
a<-table.row.end(a)
a<-table.row.start(a)
a<-table.element(a, 'p-value',1,TRUE)
a<-table.element(a,formatC(signif(1-pf(mysum$fstatistic[1],mysum$fstatistic[2],mysum$fstatistic[3]),6),format='g',flag=' '))
a<-table.row.end(a)
a<-table.row.start(a)
a<-table.element(a, 'Multiple Linear Regression - Residual Statistics', 2, TRUE)
a<-table.row.end(a)
a<-table.row.start(a)
a<-table.element(a, 'Residual Standard Deviation',1,TRUE)
a<-table.element(a,formatC(signif(mysum$sigma,6),format='g',flag=' '))
a<-table.row.end(a)
a<-table.row.start(a)
a<-table.element(a, 'Sum Squared Residuals',1,TRUE)
a<-table.element(a,formatC(signif(sum(myerror*myerror),6),format='g',flag=' '))
a<-table.row.end(a)
a<-table.end(a)
table.save(a,file='mytable3.tab')
myr <- as.numeric(mysum$resid)
myr
a <-table.start()
a <- table.row.start(a)
a <- table.element(a,'Menu of Residual Diagnostics',2,TRUE)
a <- table.row.end(a)
a <- table.row.start(a)
a <- table.element(a,'Description',1,TRUE)
a <- table.element(a,'Link',1,TRUE)
a <- table.row.end(a)
a <- table.row.start(a)
a <-table.element(a,'Histogram',1,header=TRUE)
a <- table.element(a,hyperlink( paste('https://supernova.wessa.net/rwasp_histogram.wasp?convertgetintopost=1&data=',paste(as.character(mysum$resid),sep='',collapse=' '),sep='') ,'Compute','Click here to examine the Residuals.'),1)
a <- table.row.end(a)
a <- table.row.start(a)
a <-table.element(a,'Central Tendency',1,header=TRUE)
a <- table.element(a,hyperlink( paste('https://supernova.wessa.net/rwasp_centraltendency.wasp?convertgetintopost=1&data=',paste(as.character(mysum$resid),sep='',collapse=' '),sep='') ,'Compute','Click here to examine the Residuals.'),1)
a <- table.row.end(a)
a <- table.row.start(a)
a <-table.element(a,'QQ Plot',1,header=TRUE)
a <- table.element(a,hyperlink( paste('https://supernova.wessa.net/rwasp_fitdistrnorm.wasp?convertgetintopost=1&data=',paste(as.character(mysum$resid),sep='',collapse=' '),sep='') ,'Compute','Click here to examine the Residuals.'),1)
a <- table.row.end(a)
a <- table.row.start(a)
a <-table.element(a,'Kernel Density Plot',1,header=TRUE)
a <- table.element(a,hyperlink( paste('https://supernova.wessa.net/rwasp_density.wasp?convertgetintopost=1&data=',paste(as.character(mysum$resid),sep='',collapse=' '),sep='') ,'Compute','Click here to examine the Residuals.'),1)
a <- table.row.end(a)
a <- table.row.start(a)
a <-table.element(a,'Skewness/Kurtosis Test',1,header=TRUE)
a <- table.element(a,hyperlink( paste('https://supernova.wessa.net/rwasp_skewness_kurtosis.wasp?convertgetintopost=1&data=',paste(as.character(mysum$resid),sep='',collapse=' '),sep='') ,'Compute','Click here to examine the Residuals.'),1)
a <- table.row.end(a)
a <- table.row.start(a)
a <-table.element(a,'Skewness-Kurtosis Plot',1,header=TRUE)
a <- table.element(a,hyperlink( paste('https://supernova.wessa.net/rwasp_skewness_kurtosis_plot.wasp?convertgetintopost=1&data=',paste(as.character(mysum$resid),sep='',collapse=' '),sep='') ,'Compute','Click here to examine the Residuals.'),1)
a <- table.row.end(a)
a <- table.row.start(a)
a <-table.element(a,'Harrell-Davis Plot',1,header=TRUE)
a <- table.element(a,hyperlink( paste('https://supernova.wessa.net/rwasp_harrell_davis.wasp?convertgetintopost=1&data=',paste(as.character(mysum$resid),sep='',collapse=' '),sep='') ,'Compute','Click here to examine the Residuals.'),1)
a <- table.row.end(a)
a <- table.row.start(a)
a <-table.element(a,'Bootstrap Plot -- Central Tendency',1,header=TRUE)
a <- table.element(a,hyperlink( paste('https://supernova.wessa.net/rwasp_bootstrapplot1.wasp?convertgetintopost=1&data=',paste(as.character(mysum$resid),sep='',collapse=' '),sep='') ,'Compute','Click here to examine the Residuals.'),1)
a <- table.row.end(a)
a <- table.row.start(a)
a <-table.element(a,'Blocked Bootstrap Plot -- Central Tendency',1,header=TRUE)
a <- table.element(a,hyperlink( paste('https://supernova.wessa.net/rwasp_bootstrapplot.wasp?convertgetintopost=1&data=',paste(as.character(mysum$resid),sep='',collapse=' '),sep='') ,'Compute','Click here to examine the Residuals.'),1)
a <- table.row.end(a)
a <- table.row.start(a)
a <-table.element(a,'(Partial) Autocorrelation Plot',1,header=TRUE)
a <- table.element(a,hyperlink( paste('https://supernova.wessa.net/rwasp_autocorrelation.wasp?convertgetintopost=1&data=',paste(as.character(mysum$resid),sep='',collapse=' '),sep='') ,'Compute','Click here to examine the Residuals.'),1)
a <- table.row.end(a)
a <- table.row.start(a)
a <-table.element(a,'Spectral Analysis',1,header=TRUE)
a <- table.element(a,hyperlink( paste('https://supernova.wessa.net/rwasp_spectrum.wasp?convertgetintopost=1&data=',paste(as.character(mysum$resid),sep='',collapse=' '),sep='') ,'Compute','Click here to examine the Residuals.'),1)
a <- table.row.end(a)
a <- table.row.start(a)
a <-table.element(a,'Tukey lambda PPCC Plot',1,header=TRUE)
a <- table.element(a,hyperlink( paste('https://supernova.wessa.net/rwasp_tukeylambda.wasp?convertgetintopost=1&data=',paste(as.character(mysum$resid),sep='',collapse=' '),sep='') ,'Compute','Click here to examine the Residuals.'),1)
a <- table.row.end(a)
a <- table.row.start(a)
a <-table.element(a,'Box-Cox Normality Plot',1,header=TRUE)
a <- table.element(a,hyperlink( paste('https://supernova.wessa.net/rwasp_boxcoxnorm.wasp?convertgetintopost=1&data=',paste(as.character(mysum$resid),sep='',collapse=' '),sep='') ,'Compute','Click here to examine the Residuals.'),1)
a <- table.row.end(a)
a <- table.row.start(a)
a <- table.element(a,'Summary Statistics',1,header=TRUE)
a <- table.element(a,hyperlink( paste('https://supernova.wessa.net/rwasp_summary1.wasp?convertgetintopost=1&data=',paste(as.character(mysum$resid),sep='',collapse=' '),sep='') ,'Compute','Click here to examine the Residuals.'),1)
a <- table.row.end(a)
a<-table.end(a)
table.save(a,file='mytable7.tab')
if(n < 200) {
a<-table.start()
a<-table.row.start(a)
a<-table.element(a, 'Multiple Linear Regression - Actuals, Interpolation, and Residuals', 4, TRUE)
a<-table.row.end(a)
a<-table.row.start(a)
a<-table.element(a, 'Time or Index', 1, TRUE)
a<-table.element(a, 'Actuals', 1, TRUE)
a<-table.element(a, 'Interpolation
Forecast', 1, TRUE)
a<-table.element(a, 'Residuals
Prediction Error', 1, TRUE)
a<-table.row.end(a)
for (i in 1:n) {
a<-table.row.start(a)
a<-table.element(a,i, 1, TRUE)
a<-table.element(a,formatC(signif(x[i],6),format='g',flag=' '))
a<-table.element(a,formatC(signif(x[i]-mysum$resid[i],6),format='g',flag=' '))
a<-table.element(a,formatC(signif(mysum$resid[i],6),format='g',flag=' '))
a<-table.row.end(a)
}
a<-table.end(a)
table.save(a,file='mytable4.tab')
if (n > n25) {
a<-table.start()
a<-table.row.start(a)
a<-table.element(a,'Goldfeld-Quandt test for Heteroskedasticity',4,TRUE)
a<-table.row.end(a)
a<-table.row.start(a)
a<-table.element(a,'p-values',header=TRUE)
a<-table.element(a,'Alternative Hypothesis',3,header=TRUE)
a<-table.row.end(a)
a<-table.row.start(a)
a<-table.element(a,'breakpoint index',header=TRUE)
a<-table.element(a,'greater',header=TRUE)
a<-table.element(a,'2-sided',header=TRUE)
a<-table.element(a,'less',header=TRUE)
a<-table.row.end(a)
for (mypoint in kp3:nmkm3) {
a<-table.row.start(a)
a<-table.element(a,mypoint,header=TRUE)
a<-table.element(a,formatC(signif(gqarr[mypoint-kp3+1,1],6),format='g',flag=' '))
a<-table.element(a,formatC(signif(gqarr[mypoint-kp3+1,2],6),format='g',flag=' '))
a<-table.element(a,formatC(signif(gqarr[mypoint-kp3+1,3],6),format='g',flag=' '))
a<-table.row.end(a)
}
a<-table.end(a)
table.save(a,file='mytable5.tab')
a<-table.start()
a<-table.row.start(a)
a<-table.element(a,'Meta Analysis of Goldfeld-Quandt test for Heteroskedasticity',4,TRUE)
a<-table.row.end(a)
a<-table.row.start(a)
a<-table.element(a,'Description',header=TRUE)
a<-table.element(a,'# significant tests',header=TRUE)
a<-table.element(a,'% significant tests',header=TRUE)
a<-table.element(a,'OK/NOK',header=TRUE)
a<-table.row.end(a)
a<-table.row.start(a)
a<-table.element(a,'1% type I error level',header=TRUE)
a<-table.element(a,signif(numsignificant1,6))
a<-table.element(a,formatC(signif(numsignificant1/numgqtests,6),format='g',flag=' '))
if (numsignificant1/numgqtests < 0.01) dum <- 'OK' else dum <- 'NOK'
a<-table.element(a,dum)
a<-table.row.end(a)
a<-table.row.start(a)
a<-table.element(a,'5% type I error level',header=TRUE)
a<-table.element(a,signif(numsignificant5,6))
a<-table.element(a,signif(numsignificant5/numgqtests,6))
if (numsignificant5/numgqtests < 0.05) dum <- 'OK' else dum <- 'NOK'
a<-table.element(a,dum)
a<-table.row.end(a)
a<-table.row.start(a)
a<-table.element(a,'10% type I error level',header=TRUE)
a<-table.element(a,signif(numsignificant10,6))
a<-table.element(a,signif(numsignificant10/numgqtests,6))
if (numsignificant10/numgqtests < 0.1) dum <- 'OK' else dum <- 'NOK'
a<-table.element(a,dum)
a<-table.row.end(a)
a<-table.end(a)
table.save(a,file='mytable6.tab')
}
}
a<-table.start()
a<-table.row.start(a)
a<-table.element(a,'Ramsey RESET F-Test for powers (2 and 3) of fitted values',1,TRUE)
a<-table.row.end(a)
a<-table.row.start(a)
reset_test_fitted <- resettest(mylm,power=2:3,type='fitted')
a<-table.element(a,paste('
',RC.texteval('reset_test_fitted'),'
',sep=''))
a<-table.row.end(a)
a<-table.row.start(a)
a<-table.element(a,'Ramsey RESET F-Test for powers (2 and 3) of regressors',1,TRUE)
a<-table.row.end(a)
a<-table.row.start(a)
reset_test_regressors <- resettest(mylm,power=2:3,type='regressor')
a<-table.element(a,paste('
',RC.texteval('reset_test_regressors'),'
',sep=''))
a<-table.row.end(a)
a<-table.row.start(a)
a<-table.element(a,'Ramsey RESET F-Test for powers (2 and 3) of principal components',1,TRUE)
a<-table.row.end(a)
a<-table.row.start(a)
reset_test_principal_components <- resettest(mylm,power=2:3,type='princomp')
a<-table.element(a,paste('
',RC.texteval('reset_test_principal_components'),'
',sep=''))
a<-table.row.end(a)
a<-table.end(a)
table.save(a,file='mytable8.tab')
a<-table.start()
a<-table.row.start(a)
a<-table.element(a,'Variance Inflation Factors (Multicollinearity)',1,TRUE)
a<-table.row.end(a)
a<-table.row.start(a)
vif <- vif(mylm)
a<-table.element(a,paste('
',RC.texteval('vif'),'
',sep=''))
a<-table.row.end(a)
a<-table.end(a)
table.save(a,file='mytable9.tab')