Free Statistics

of Irreproducible Research!

Author's title

Author*The author of this computation has been verified*
R Software Modulerwasp_autocorrelation.wasp
Title produced by software(Partial) Autocorrelation Function
Date of computationWed, 13 Dec 2017 16:06:02 +0100
Cite this page as followsStatistical Computations at FreeStatistics.org, Office for Research Development and Education, URL https://freestatistics.org/blog/index.php?v=date/2017/Dec/13/t15131775904tfxadijfbzgomu.htm/, Retrieved Wed, 15 May 2024 16:43:28 +0000
Statistical Computations at FreeStatistics.org, Office for Research Development and Education, URL https://freestatistics.org/blog/index.php?pk=309335, Retrieved Wed, 15 May 2024 16:43:28 +0000
QR Codes:

Original text written by user:
IsPrivate?No (this computation is public)
User-defined keywords
Estimated Impact67
Family? (F = Feedback message, R = changed R code, M = changed R Module, P = changed Parameters, D = changed Data)
-       [(Partial) Autocorrelation Function] [ Y(t):d=1,D=0] [2017-12-13 15:06:02] [f0c04f92d9de470b9a4b46d90127e7c3] [Current]
Feedback Forum

Post a new message
Dataseries X:
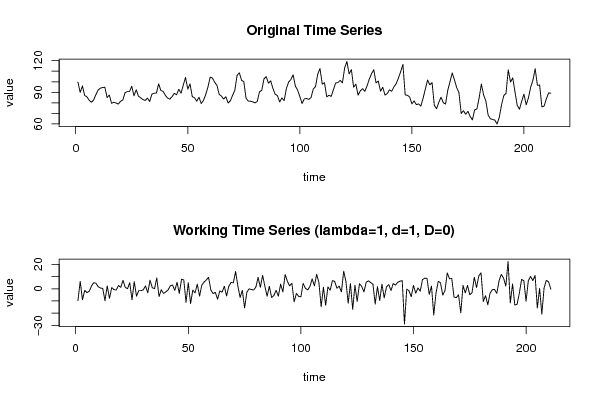
99.5
89.9
96
86.9
85.6
82.5
80.5
82.7
87.7
92.2
93.9
94.5
94.8
85
87.4
79.5
80.5
79.8
78.8
81.5
82.6
89.5
90.7
90.7
95.7
86.6
92.4
86.3
84.7
83.1
82.2
84.5
81.2
88.2
89.1
89.1
98
91.7
90.9
87.1
84.5
83.5
85.9
89
87.6
92.9
89.1
96.9
104.1
93
98
85.9
84.8
81.5
85.3
79.3
82.3
87.8
95
104.4
103.5
99.5
96.6
88.1
86.4
83.6
85.7
79.8
81.9
87.1
92
106.1
108.5
101.4
100.1
84.4
81.6
81.5
80.9
79.9
81.2
90.5
91.7
102.7
104.8
98.7
100.8
93.6
88.1
86.8
80.8
84.6
82
93.6
99.7
102.1
106.6
95.9
92.1
85.9
79.3
83.7
84.1
83.2
85
93.1
95.4
107.3
112.5
97.8
99.1
85.6
87.2
86
92.7
98.8
99.2
101.4
98.8
113.2
119.2
107.4
111.6
94.8
97.7
87.3
91.4
93.4
90.8
96.1
102.6
107.7
111.4
98.9
100.7
91
94.8
87.3
88.8
92.3
90.9
95.2
98.2
103.5
109.7
116.4
87.5
87.2
85.5
79
81.8
78.2
78.9
76.9
84.4
93.1
101.6
97.1
99.3
77.8
74.3
80.4
85.3
80.1
78.8
91.8
100
108.4
101.7
94.4
89.5
69.8
72.5
69.1
71.9
67
63.8
73.2
74.2
84.7
97.8
87.4
81.8
68.6
64.9
64.1
63.6
59.8
66.3
78.1
86.8
89
111.3
99.7
103.7
90.4
77.6
73.9
81.5
88.2
78
84.7
94.8
101.5
112.4
96.6
96.9
76.1
76.9
83.8
89.4
89.1


Summary of computational transaction
Raw Input view raw input (R code)
Raw Outputview raw output of R engine
Computing time3 seconds
R ServerBig Analytics Cloud Computing Center

\begin{tabular}{lllllllll}
\hline
Summary of computational transaction \tabularnewline
Raw Input view raw input (R code)  \tabularnewline
Raw Outputview raw output of R engine  \tabularnewline
Computing time3 seconds \tabularnewline
R ServerBig Analytics Cloud Computing Center \tabularnewline
\hline
\end{tabular}
%Source: https://freestatistics.org/blog/index.php?pk=309335&T=0

[TABLE]
[ROW]
Summary of computational transaction[/C][/ROW] [ROW]Raw Input[/C] view raw input (R code) [/C][/ROW] [ROW]Raw Output[/C]view raw output of R engine [/C][/ROW] [ROW]Computing time[/C]3 seconds[/C][/ROW] [ROW]R Server[/C]Big Analytics Cloud Computing Center[/C][/ROW] [/TABLE] Source: https://freestatistics.org/blog/index.php?pk=309335&T=0

Globally Unique Identifier (entire table): ba.freestatistics.org/blog/index.php?pk=309335&T=0

As an alternative you can also use a QR Code:  

The GUIDs for individual cells are displayed in the table below:

Summary of computational transaction
Raw Input view raw input (R code)
Raw Outputview raw output of R engine
Computing time3 seconds
R ServerBig Analytics Cloud Computing Center


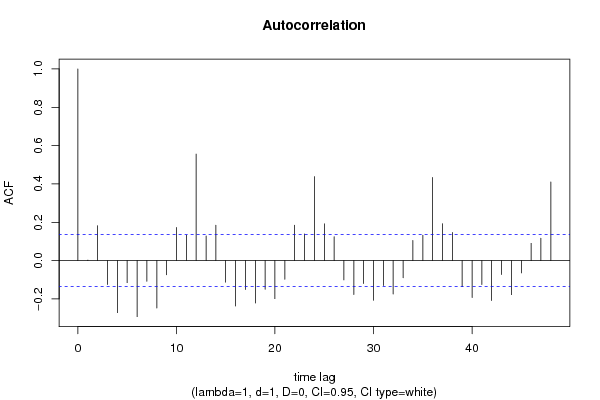
Autocorrelation Function
Time lag kACF(k)T-STATP-value
10.0026560.03860.484628
20.181872.64180.004432
3-0.124497-1.80840.035982
4-0.271634-3.94575.4e-05
5-0.115217-1.67360.047843
6-0.29254-4.24941.6e-05
7-0.107678-1.56410.059644
8-0.247024-3.58820.000207
9-0.073564-1.06860.14324
100.1726692.50820.006444
110.1325421.92530.027769
120.5556268.07090
130.1286391.86860.031533
140.1848022.68440.003921
15-0.112354-1.6320.052082
16-0.236773-3.43930.000351
17-0.151282-2.19750.014537
18-0.221051-3.2110.000765
19-0.149212-2.16740.015661
20-0.198713-2.88650.00215
21-0.097379-1.41450.079343
220.1844542.67940.003979
230.1390052.01920.022367
240.4382046.36530
250.1914932.78160.00295
260.1246981.81130.035755
27-0.100533-1.46030.072844
28-0.176984-2.57080.005417
29-0.119248-1.73220.042351
30-0.207197-3.00970.001467
31-0.130329-1.89310.029854
32-0.174381-2.5330.006017
33-0.089814-1.30460.096721
340.1045481.51870.065174
350.1322681.92130.02802
360.4338826.30250
370.1927052.79920.002799
380.1468252.13280.01705
39-0.135999-1.97550.024758
40-0.192516-2.79650.002822
41-0.124523-1.80880.035953
42-0.208579-3.02980.001376
43-0.072218-1.0490.147683
44-0.177805-2.58280.005239
45-0.064081-0.93080.176503
460.0899611.30680.096358
470.1163251.68970.04628
480.409875.95370

\begin{tabular}{lllllllll}
\hline
Autocorrelation Function \tabularnewline
Time lag k & ACF(k) & T-STAT & P-value \tabularnewline
1 & 0.002656 & 0.0386 & 0.484628 \tabularnewline
2 & 0.18187 & 2.6418 & 0.004432 \tabularnewline
3 & -0.124497 & -1.8084 & 0.035982 \tabularnewline
4 & -0.271634 & -3.9457 & 5.4e-05 \tabularnewline
5 & -0.115217 & -1.6736 & 0.047843 \tabularnewline
6 & -0.29254 & -4.2494 & 1.6e-05 \tabularnewline
7 & -0.107678 & -1.5641 & 0.059644 \tabularnewline
8 & -0.247024 & -3.5882 & 0.000207 \tabularnewline
9 & -0.073564 & -1.0686 & 0.14324 \tabularnewline
10 & 0.172669 & 2.5082 & 0.006444 \tabularnewline
11 & 0.132542 & 1.9253 & 0.027769 \tabularnewline
12 & 0.555626 & 8.0709 & 0 \tabularnewline
13 & 0.128639 & 1.8686 & 0.031533 \tabularnewline
14 & 0.184802 & 2.6844 & 0.003921 \tabularnewline
15 & -0.112354 & -1.632 & 0.052082 \tabularnewline
16 & -0.236773 & -3.4393 & 0.000351 \tabularnewline
17 & -0.151282 & -2.1975 & 0.014537 \tabularnewline
18 & -0.221051 & -3.211 & 0.000765 \tabularnewline
19 & -0.149212 & -2.1674 & 0.015661 \tabularnewline
20 & -0.198713 & -2.8865 & 0.00215 \tabularnewline
21 & -0.097379 & -1.4145 & 0.079343 \tabularnewline
22 & 0.184454 & 2.6794 & 0.003979 \tabularnewline
23 & 0.139005 & 2.0192 & 0.022367 \tabularnewline
24 & 0.438204 & 6.3653 & 0 \tabularnewline
25 & 0.191493 & 2.7816 & 0.00295 \tabularnewline
26 & 0.124698 & 1.8113 & 0.035755 \tabularnewline
27 & -0.100533 & -1.4603 & 0.072844 \tabularnewline
28 & -0.176984 & -2.5708 & 0.005417 \tabularnewline
29 & -0.119248 & -1.7322 & 0.042351 \tabularnewline
30 & -0.207197 & -3.0097 & 0.001467 \tabularnewline
31 & -0.130329 & -1.8931 & 0.029854 \tabularnewline
32 & -0.174381 & -2.533 & 0.006017 \tabularnewline
33 & -0.089814 & -1.3046 & 0.096721 \tabularnewline
34 & 0.104548 & 1.5187 & 0.065174 \tabularnewline
35 & 0.132268 & 1.9213 & 0.02802 \tabularnewline
36 & 0.433882 & 6.3025 & 0 \tabularnewline
37 & 0.192705 & 2.7992 & 0.002799 \tabularnewline
38 & 0.146825 & 2.1328 & 0.01705 \tabularnewline
39 & -0.135999 & -1.9755 & 0.024758 \tabularnewline
40 & -0.192516 & -2.7965 & 0.002822 \tabularnewline
41 & -0.124523 & -1.8088 & 0.035953 \tabularnewline
42 & -0.208579 & -3.0298 & 0.001376 \tabularnewline
43 & -0.072218 & -1.049 & 0.147683 \tabularnewline
44 & -0.177805 & -2.5828 & 0.005239 \tabularnewline
45 & -0.064081 & -0.9308 & 0.176503 \tabularnewline
46 & 0.089961 & 1.3068 & 0.096358 \tabularnewline
47 & 0.116325 & 1.6897 & 0.04628 \tabularnewline
48 & 0.40987 & 5.9537 & 0 \tabularnewline
\hline
\end{tabular}
%Source: https://freestatistics.org/blog/index.php?pk=309335&T=1

[TABLE]
[ROW][C]Autocorrelation Function[/C][/ROW]
[ROW][C]Time lag k[/C][C]ACF(k)[/C][C]T-STAT[/C][C]P-value[/C][/ROW]
[ROW][C]1[/C][C]0.002656[/C][C]0.0386[/C][C]0.484628[/C][/ROW]
[ROW][C]2[/C][C]0.18187[/C][C]2.6418[/C][C]0.004432[/C][/ROW]
[ROW][C]3[/C][C]-0.124497[/C][C]-1.8084[/C][C]0.035982[/C][/ROW]
[ROW][C]4[/C][C]-0.271634[/C][C]-3.9457[/C][C]5.4e-05[/C][/ROW]
[ROW][C]5[/C][C]-0.115217[/C][C]-1.6736[/C][C]0.047843[/C][/ROW]
[ROW][C]6[/C][C]-0.29254[/C][C]-4.2494[/C][C]1.6e-05[/C][/ROW]
[ROW][C]7[/C][C]-0.107678[/C][C]-1.5641[/C][C]0.059644[/C][/ROW]
[ROW][C]8[/C][C]-0.247024[/C][C]-3.5882[/C][C]0.000207[/C][/ROW]
[ROW][C]9[/C][C]-0.073564[/C][C]-1.0686[/C][C]0.14324[/C][/ROW]
[ROW][C]10[/C][C]0.172669[/C][C]2.5082[/C][C]0.006444[/C][/ROW]
[ROW][C]11[/C][C]0.132542[/C][C]1.9253[/C][C]0.027769[/C][/ROW]
[ROW][C]12[/C][C]0.555626[/C][C]8.0709[/C][C]0[/C][/ROW]
[ROW][C]13[/C][C]0.128639[/C][C]1.8686[/C][C]0.031533[/C][/ROW]
[ROW][C]14[/C][C]0.184802[/C][C]2.6844[/C][C]0.003921[/C][/ROW]
[ROW][C]15[/C][C]-0.112354[/C][C]-1.632[/C][C]0.052082[/C][/ROW]
[ROW][C]16[/C][C]-0.236773[/C][C]-3.4393[/C][C]0.000351[/C][/ROW]
[ROW][C]17[/C][C]-0.151282[/C][C]-2.1975[/C][C]0.014537[/C][/ROW]
[ROW][C]18[/C][C]-0.221051[/C][C]-3.211[/C][C]0.000765[/C][/ROW]
[ROW][C]19[/C][C]-0.149212[/C][C]-2.1674[/C][C]0.015661[/C][/ROW]
[ROW][C]20[/C][C]-0.198713[/C][C]-2.8865[/C][C]0.00215[/C][/ROW]
[ROW][C]21[/C][C]-0.097379[/C][C]-1.4145[/C][C]0.079343[/C][/ROW]
[ROW][C]22[/C][C]0.184454[/C][C]2.6794[/C][C]0.003979[/C][/ROW]
[ROW][C]23[/C][C]0.139005[/C][C]2.0192[/C][C]0.022367[/C][/ROW]
[ROW][C]24[/C][C]0.438204[/C][C]6.3653[/C][C]0[/C][/ROW]
[ROW][C]25[/C][C]0.191493[/C][C]2.7816[/C][C]0.00295[/C][/ROW]
[ROW][C]26[/C][C]0.124698[/C][C]1.8113[/C][C]0.035755[/C][/ROW]
[ROW][C]27[/C][C]-0.100533[/C][C]-1.4603[/C][C]0.072844[/C][/ROW]
[ROW][C]28[/C][C]-0.176984[/C][C]-2.5708[/C][C]0.005417[/C][/ROW]
[ROW][C]29[/C][C]-0.119248[/C][C]-1.7322[/C][C]0.042351[/C][/ROW]
[ROW][C]30[/C][C]-0.207197[/C][C]-3.0097[/C][C]0.001467[/C][/ROW]
[ROW][C]31[/C][C]-0.130329[/C][C]-1.8931[/C][C]0.029854[/C][/ROW]
[ROW][C]32[/C][C]-0.174381[/C][C]-2.533[/C][C]0.006017[/C][/ROW]
[ROW][C]33[/C][C]-0.089814[/C][C]-1.3046[/C][C]0.096721[/C][/ROW]
[ROW][C]34[/C][C]0.104548[/C][C]1.5187[/C][C]0.065174[/C][/ROW]
[ROW][C]35[/C][C]0.132268[/C][C]1.9213[/C][C]0.02802[/C][/ROW]
[ROW][C]36[/C][C]0.433882[/C][C]6.3025[/C][C]0[/C][/ROW]
[ROW][C]37[/C][C]0.192705[/C][C]2.7992[/C][C]0.002799[/C][/ROW]
[ROW][C]38[/C][C]0.146825[/C][C]2.1328[/C][C]0.01705[/C][/ROW]
[ROW][C]39[/C][C]-0.135999[/C][C]-1.9755[/C][C]0.024758[/C][/ROW]
[ROW][C]40[/C][C]-0.192516[/C][C]-2.7965[/C][C]0.002822[/C][/ROW]
[ROW][C]41[/C][C]-0.124523[/C][C]-1.8088[/C][C]0.035953[/C][/ROW]
[ROW][C]42[/C][C]-0.208579[/C][C]-3.0298[/C][C]0.001376[/C][/ROW]
[ROW][C]43[/C][C]-0.072218[/C][C]-1.049[/C][C]0.147683[/C][/ROW]
[ROW][C]44[/C][C]-0.177805[/C][C]-2.5828[/C][C]0.005239[/C][/ROW]
[ROW][C]45[/C][C]-0.064081[/C][C]-0.9308[/C][C]0.176503[/C][/ROW]
[ROW][C]46[/C][C]0.089961[/C][C]1.3068[/C][C]0.096358[/C][/ROW]
[ROW][C]47[/C][C]0.116325[/C][C]1.6897[/C][C]0.04628[/C][/ROW]
[ROW][C]48[/C][C]0.40987[/C][C]5.9537[/C][C]0[/C][/ROW]
[/TABLE]
Source: https://freestatistics.org/blog/index.php?pk=309335&T=1

Globally Unique Identifier (entire table): ba.freestatistics.org/blog/index.php?pk=309335&T=1

As an alternative you can also use a QR Code:  

The GUIDs for individual cells are displayed in the table below:

Autocorrelation Function
Time lag kACF(k)T-STATP-value
10.0026560.03860.484628
20.181872.64180.004432
3-0.124497-1.80840.035982
4-0.271634-3.94575.4e-05
5-0.115217-1.67360.047843
6-0.29254-4.24941.6e-05
7-0.107678-1.56410.059644
8-0.247024-3.58820.000207
9-0.073564-1.06860.14324
100.1726692.50820.006444
110.1325421.92530.027769
120.5556268.07090
130.1286391.86860.031533
140.1848022.68440.003921
15-0.112354-1.6320.052082
16-0.236773-3.43930.000351
17-0.151282-2.19750.014537
18-0.221051-3.2110.000765
19-0.149212-2.16740.015661
20-0.198713-2.88650.00215
21-0.097379-1.41450.079343
220.1844542.67940.003979
230.1390052.01920.022367
240.4382046.36530
250.1914932.78160.00295
260.1246981.81130.035755
27-0.100533-1.46030.072844
28-0.176984-2.57080.005417
29-0.119248-1.73220.042351
30-0.207197-3.00970.001467
31-0.130329-1.89310.029854
32-0.174381-2.5330.006017
33-0.089814-1.30460.096721
340.1045481.51870.065174
350.1322681.92130.02802
360.4338826.30250
370.1927052.79920.002799
380.1468252.13280.01705
39-0.135999-1.97550.024758
40-0.192516-2.79650.002822
41-0.124523-1.80880.035953
42-0.208579-3.02980.001376
43-0.072218-1.0490.147683
44-0.177805-2.58280.005239
45-0.064081-0.93080.176503
460.0899611.30680.096358
470.1163251.68970.04628
480.409875.95370


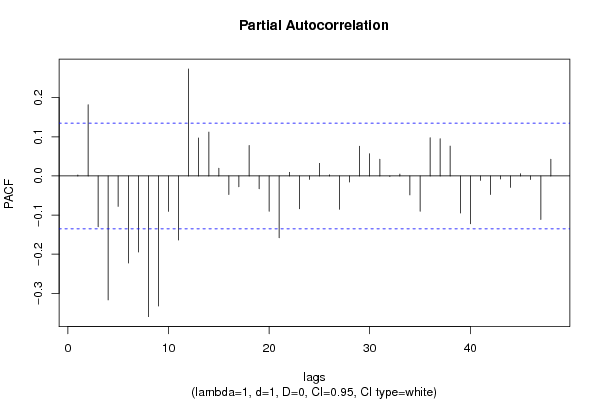
Partial Autocorrelation Function
Time lag kPACF(k)T-STATP-value
10.0026560.03860.484628
20.1818642.64170.004433
3-0.129665-1.88350.030504
4-0.316842-4.60244e-06
5-0.07785-1.13080.129704
6-0.222717-3.23520.000706
7-0.194405-2.82390.002599
8-0.359629-5.22390
9-0.332635-4.83181e-06
10-0.090521-1.31490.094986
11-0.1636-2.37640.009188
120.2735683.97384.9e-05
130.0972781.4130.079559
140.1120911.62820.052485
150.0198340.28810.386776
16-0.047549-0.69070.245261
17-0.02747-0.3990.34514
180.0777681.12960.129955
19-0.032787-0.47630.317193
20-0.090266-1.31120.095609
21-0.157973-2.29470.011367
220.009150.13290.447197
23-0.083649-1.21510.112849
24-0.008729-0.12680.449613
250.0322460.46840.319989
260.0027820.04040.483901
27-0.085319-1.23930.108299
28-0.015624-0.2270.410339
290.0759451.10320.135606
300.0569560.82730.204492
310.0428730.62280.267054
32-0.001345-0.01950.492217
330.0047990.06970.472243
34-0.048434-0.70350.241247
35-0.090043-1.3080.096156
360.0975481.4170.078983
370.0952741.38390.083921
380.076241.10740.134681
39-0.094526-1.37310.085593
40-0.122259-1.77590.038594
41-0.011306-0.16420.434852
42-0.047307-0.68720.246364
43-0.007952-0.11550.454075
44-0.029249-0.42490.335685
450.005650.08210.467333
46-0.008893-0.12920.448671
47-0.111387-1.6180.05358
480.0428630.62260.267102

\begin{tabular}{lllllllll}
\hline
Partial Autocorrelation Function \tabularnewline
Time lag k & PACF(k) & T-STAT & P-value \tabularnewline
1 & 0.002656 & 0.0386 & 0.484628 \tabularnewline
2 & 0.181864 & 2.6417 & 0.004433 \tabularnewline
3 & -0.129665 & -1.8835 & 0.030504 \tabularnewline
4 & -0.316842 & -4.6024 & 4e-06 \tabularnewline
5 & -0.07785 & -1.1308 & 0.129704 \tabularnewline
6 & -0.222717 & -3.2352 & 0.000706 \tabularnewline
7 & -0.194405 & -2.8239 & 0.002599 \tabularnewline
8 & -0.359629 & -5.2239 & 0 \tabularnewline
9 & -0.332635 & -4.8318 & 1e-06 \tabularnewline
10 & -0.090521 & -1.3149 & 0.094986 \tabularnewline
11 & -0.1636 & -2.3764 & 0.009188 \tabularnewline
12 & 0.273568 & 3.9738 & 4.9e-05 \tabularnewline
13 & 0.097278 & 1.413 & 0.079559 \tabularnewline
14 & 0.112091 & 1.6282 & 0.052485 \tabularnewline
15 & 0.019834 & 0.2881 & 0.386776 \tabularnewline
16 & -0.047549 & -0.6907 & 0.245261 \tabularnewline
17 & -0.02747 & -0.399 & 0.34514 \tabularnewline
18 & 0.077768 & 1.1296 & 0.129955 \tabularnewline
19 & -0.032787 & -0.4763 & 0.317193 \tabularnewline
20 & -0.090266 & -1.3112 & 0.095609 \tabularnewline
21 & -0.157973 & -2.2947 & 0.011367 \tabularnewline
22 & 0.00915 & 0.1329 & 0.447197 \tabularnewline
23 & -0.083649 & -1.2151 & 0.112849 \tabularnewline
24 & -0.008729 & -0.1268 & 0.449613 \tabularnewline
25 & 0.032246 & 0.4684 & 0.319989 \tabularnewline
26 & 0.002782 & 0.0404 & 0.483901 \tabularnewline
27 & -0.085319 & -1.2393 & 0.108299 \tabularnewline
28 & -0.015624 & -0.227 & 0.410339 \tabularnewline
29 & 0.075945 & 1.1032 & 0.135606 \tabularnewline
30 & 0.056956 & 0.8273 & 0.204492 \tabularnewline
31 & 0.042873 & 0.6228 & 0.267054 \tabularnewline
32 & -0.001345 & -0.0195 & 0.492217 \tabularnewline
33 & 0.004799 & 0.0697 & 0.472243 \tabularnewline
34 & -0.048434 & -0.7035 & 0.241247 \tabularnewline
35 & -0.090043 & -1.308 & 0.096156 \tabularnewline
36 & 0.097548 & 1.417 & 0.078983 \tabularnewline
37 & 0.095274 & 1.3839 & 0.083921 \tabularnewline
38 & 0.07624 & 1.1074 & 0.134681 \tabularnewline
39 & -0.094526 & -1.3731 & 0.085593 \tabularnewline
40 & -0.122259 & -1.7759 & 0.038594 \tabularnewline
41 & -0.011306 & -0.1642 & 0.434852 \tabularnewline
42 & -0.047307 & -0.6872 & 0.246364 \tabularnewline
43 & -0.007952 & -0.1155 & 0.454075 \tabularnewline
44 & -0.029249 & -0.4249 & 0.335685 \tabularnewline
45 & 0.00565 & 0.0821 & 0.467333 \tabularnewline
46 & -0.008893 & -0.1292 & 0.448671 \tabularnewline
47 & -0.111387 & -1.618 & 0.05358 \tabularnewline
48 & 0.042863 & 0.6226 & 0.267102 \tabularnewline
\hline
\end{tabular}
%Source: https://freestatistics.org/blog/index.php?pk=309335&T=2

[TABLE]
[ROW][C]Partial Autocorrelation Function[/C][/ROW]
[ROW][C]Time lag k[/C][C]PACF(k)[/C][C]T-STAT[/C][C]P-value[/C][/ROW]
[ROW][C]1[/C][C]0.002656[/C][C]0.0386[/C][C]0.484628[/C][/ROW]
[ROW][C]2[/C][C]0.181864[/C][C]2.6417[/C][C]0.004433[/C][/ROW]
[ROW][C]3[/C][C]-0.129665[/C][C]-1.8835[/C][C]0.030504[/C][/ROW]
[ROW][C]4[/C][C]-0.316842[/C][C]-4.6024[/C][C]4e-06[/C][/ROW]
[ROW][C]5[/C][C]-0.07785[/C][C]-1.1308[/C][C]0.129704[/C][/ROW]
[ROW][C]6[/C][C]-0.222717[/C][C]-3.2352[/C][C]0.000706[/C][/ROW]
[ROW][C]7[/C][C]-0.194405[/C][C]-2.8239[/C][C]0.002599[/C][/ROW]
[ROW][C]8[/C][C]-0.359629[/C][C]-5.2239[/C][C]0[/C][/ROW]
[ROW][C]9[/C][C]-0.332635[/C][C]-4.8318[/C][C]1e-06[/C][/ROW]
[ROW][C]10[/C][C]-0.090521[/C][C]-1.3149[/C][C]0.094986[/C][/ROW]
[ROW][C]11[/C][C]-0.1636[/C][C]-2.3764[/C][C]0.009188[/C][/ROW]
[ROW][C]12[/C][C]0.273568[/C][C]3.9738[/C][C]4.9e-05[/C][/ROW]
[ROW][C]13[/C][C]0.097278[/C][C]1.413[/C][C]0.079559[/C][/ROW]
[ROW][C]14[/C][C]0.112091[/C][C]1.6282[/C][C]0.052485[/C][/ROW]
[ROW][C]15[/C][C]0.019834[/C][C]0.2881[/C][C]0.386776[/C][/ROW]
[ROW][C]16[/C][C]-0.047549[/C][C]-0.6907[/C][C]0.245261[/C][/ROW]
[ROW][C]17[/C][C]-0.02747[/C][C]-0.399[/C][C]0.34514[/C][/ROW]
[ROW][C]18[/C][C]0.077768[/C][C]1.1296[/C][C]0.129955[/C][/ROW]
[ROW][C]19[/C][C]-0.032787[/C][C]-0.4763[/C][C]0.317193[/C][/ROW]
[ROW][C]20[/C][C]-0.090266[/C][C]-1.3112[/C][C]0.095609[/C][/ROW]
[ROW][C]21[/C][C]-0.157973[/C][C]-2.2947[/C][C]0.011367[/C][/ROW]
[ROW][C]22[/C][C]0.00915[/C][C]0.1329[/C][C]0.447197[/C][/ROW]
[ROW][C]23[/C][C]-0.083649[/C][C]-1.2151[/C][C]0.112849[/C][/ROW]
[ROW][C]24[/C][C]-0.008729[/C][C]-0.1268[/C][C]0.449613[/C][/ROW]
[ROW][C]25[/C][C]0.032246[/C][C]0.4684[/C][C]0.319989[/C][/ROW]
[ROW][C]26[/C][C]0.002782[/C][C]0.0404[/C][C]0.483901[/C][/ROW]
[ROW][C]27[/C][C]-0.085319[/C][C]-1.2393[/C][C]0.108299[/C][/ROW]
[ROW][C]28[/C][C]-0.015624[/C][C]-0.227[/C][C]0.410339[/C][/ROW]
[ROW][C]29[/C][C]0.075945[/C][C]1.1032[/C][C]0.135606[/C][/ROW]
[ROW][C]30[/C][C]0.056956[/C][C]0.8273[/C][C]0.204492[/C][/ROW]
[ROW][C]31[/C][C]0.042873[/C][C]0.6228[/C][C]0.267054[/C][/ROW]
[ROW][C]32[/C][C]-0.001345[/C][C]-0.0195[/C][C]0.492217[/C][/ROW]
[ROW][C]33[/C][C]0.004799[/C][C]0.0697[/C][C]0.472243[/C][/ROW]
[ROW][C]34[/C][C]-0.048434[/C][C]-0.7035[/C][C]0.241247[/C][/ROW]
[ROW][C]35[/C][C]-0.090043[/C][C]-1.308[/C][C]0.096156[/C][/ROW]
[ROW][C]36[/C][C]0.097548[/C][C]1.417[/C][C]0.078983[/C][/ROW]
[ROW][C]37[/C][C]0.095274[/C][C]1.3839[/C][C]0.083921[/C][/ROW]
[ROW][C]38[/C][C]0.07624[/C][C]1.1074[/C][C]0.134681[/C][/ROW]
[ROW][C]39[/C][C]-0.094526[/C][C]-1.3731[/C][C]0.085593[/C][/ROW]
[ROW][C]40[/C][C]-0.122259[/C][C]-1.7759[/C][C]0.038594[/C][/ROW]
[ROW][C]41[/C][C]-0.011306[/C][C]-0.1642[/C][C]0.434852[/C][/ROW]
[ROW][C]42[/C][C]-0.047307[/C][C]-0.6872[/C][C]0.246364[/C][/ROW]
[ROW][C]43[/C][C]-0.007952[/C][C]-0.1155[/C][C]0.454075[/C][/ROW]
[ROW][C]44[/C][C]-0.029249[/C][C]-0.4249[/C][C]0.335685[/C][/ROW]
[ROW][C]45[/C][C]0.00565[/C][C]0.0821[/C][C]0.467333[/C][/ROW]
[ROW][C]46[/C][C]-0.008893[/C][C]-0.1292[/C][C]0.448671[/C][/ROW]
[ROW][C]47[/C][C]-0.111387[/C][C]-1.618[/C][C]0.05358[/C][/ROW]
[ROW][C]48[/C][C]0.042863[/C][C]0.6226[/C][C]0.267102[/C][/ROW]
[/TABLE]
Source: https://freestatistics.org/blog/index.php?pk=309335&T=2

Globally Unique Identifier (entire table): ba.freestatistics.org/blog/index.php?pk=309335&T=2

As an alternative you can also use a QR Code:  

The GUIDs for individual cells are displayed in the table below:

Partial Autocorrelation Function
Time lag kPACF(k)T-STATP-value
10.0026560.03860.484628
20.1818642.64170.004433
3-0.129665-1.88350.030504
4-0.316842-4.60244e-06
5-0.07785-1.13080.129704
6-0.222717-3.23520.000706
7-0.194405-2.82390.002599
8-0.359629-5.22390
9-0.332635-4.83181e-06
10-0.090521-1.31490.094986
11-0.1636-2.37640.009188
120.2735683.97384.9e-05
130.0972781.4130.079559
140.1120911.62820.052485
150.0198340.28810.386776
16-0.047549-0.69070.245261
17-0.02747-0.3990.34514
180.0777681.12960.129955
19-0.032787-0.47630.317193
20-0.090266-1.31120.095609
21-0.157973-2.29470.011367
220.009150.13290.447197
23-0.083649-1.21510.112849
24-0.008729-0.12680.449613
250.0322460.46840.319989
260.0027820.04040.483901
27-0.085319-1.23930.108299
28-0.015624-0.2270.410339
290.0759451.10320.135606
300.0569560.82730.204492
310.0428730.62280.267054
32-0.001345-0.01950.492217
330.0047990.06970.472243
34-0.048434-0.70350.241247
35-0.090043-1.3080.096156
360.0975481.4170.078983
370.0952741.38390.083921
380.076241.10740.134681
39-0.094526-1.37310.085593
40-0.122259-1.77590.038594
41-0.011306-0.16420.434852
42-0.047307-0.68720.246364
43-0.007952-0.11550.454075
44-0.029249-0.42490.335685
450.005650.08210.467333
46-0.008893-0.12920.448671
47-0.111387-1.6180.05358
480.0428630.62260.267102


Parameters (Session):
par1 = 48 ; par2 = 1 ; par3 = 1 ; par4 = 0 ; par5 = 12 ; par6 = White Noise ; par7 = 0.95 ;
Parameters (R input):
par1 = 48 ; par2 = 1 ; par3 = 1 ; par4 = 0 ; par5 = 12 ; par6 = White Noise ; par7 = 0.95 ; par8 = ;
R code (references can be found in the software module):
if (par1 == 'Default') {
par1 = 10*log10(length(x))
} else {
par1 <- as.numeric(par1)
}
par2 <- as.numeric(par2)
par3 <- as.numeric(par3)
par4 <- as.numeric(par4)
par5 <- as.numeric(par5)
if (par6 == 'White Noise') par6 <- 'white' else par6 <- 'ma'
par7 <- as.numeric(par7)
if (par8 != '') par8 <- as.numeric(par8)
x <- na.omit(x)
ox <- x
if (par8 == '') {
if (par2 == 0) {
x <- log(x)
} else {
x <- (x ^ par2 - 1) / par2
}
} else {
x <- log(x,base=par8)
}
if (par3 > 0) x <- diff(x,lag=1,difference=par3)
if (par4 > 0) x <- diff(x,lag=par5,difference=par4)
bitmap(file='picts.png')
op <- par(mfrow=c(2,1))
plot(ox,type='l',main='Original Time Series',xlab='time',ylab='value')
if (par8=='') {
mytitle <- paste('Working Time Series (lambda=',par2,', d=',par3,', D=',par4,')',sep='')
mysub <- paste('(lambda=',par2,', d=',par3,', D=',par4,', CI=', par7, ', CI type=',par6,')',sep='')
} else {
mytitle <- paste('Working Time Series (base=',par8,', d=',par3,', D=',par4,')',sep='')
mysub <- paste('(base=',par8,', d=',par3,', D=',par4,', CI=', par7, ', CI type=',par6,')',sep='')
}
plot(x,type='l', main=mytitle,xlab='time',ylab='value')
par(op)
dev.off()
bitmap(file='pic1.png')
racf <- acf(x, par1, main='Autocorrelation', xlab='time lag', ylab='ACF', ci.type=par6, ci=par7, sub=mysub)
dev.off()
bitmap(file='pic2.png')
rpacf <- pacf(x,par1,main='Partial Autocorrelation',xlab='lags',ylab='PACF',sub=mysub)
dev.off()
(myacf <- c(racf$acf))
(mypacf <- c(rpacf$acf))
lengthx <- length(x)
sqrtn <- sqrt(lengthx)
load(file='createtable')
a<-table.start()
a<-table.row.start(a)
a<-table.element(a,'Autocorrelation Function',4,TRUE)
a<-table.row.end(a)
a<-table.row.start(a)
a<-table.element(a,'Time lag k',header=TRUE)
a<-table.element(a,'ACF(k)',header=TRUE)
a<-table.element(a,'T-STAT',header=TRUE)
a<-table.element(a,'P-value',header=TRUE)
a<-table.row.end(a)
for (i in 2:(par1+1)) {
a<-table.row.start(a)
a<-table.element(a,i-1,header=TRUE)
a<-table.element(a,round(myacf[i],6))
mytstat <- myacf[i]*sqrtn
a<-table.element(a,round(mytstat,4))
a<-table.element(a,round(1-pt(abs(mytstat),lengthx),6))
a<-table.row.end(a)
}
a<-table.end(a)
table.save(a,file='mytable.tab')
a<-table.start()
a<-table.row.start(a)
a<-table.element(a,'Partial Autocorrelation Function',4,TRUE)
a<-table.row.end(a)
a<-table.row.start(a)
a<-table.element(a,'Time lag k',header=TRUE)
a<-table.element(a,'PACF(k)',header=TRUE)
a<-table.element(a,'T-STAT',header=TRUE)
a<-table.element(a,'P-value',header=TRUE)
a<-table.row.end(a)
for (i in 1:par1) {
a<-table.row.start(a)
a<-table.element(a,i,header=TRUE)
a<-table.element(a,round(mypacf[i],6))
mytstat <- mypacf[i]*sqrtn
a<-table.element(a,round(mytstat,4))
a<-table.element(a,round(1-pt(abs(mytstat),lengthx),6))
a<-table.row.end(a)
}
a<-table.end(a)
table.save(a,file='mytable1.tab')