Free Statistics

of Irreproducible Research!

Author's title

Author*The author of this computation has been verified*
R Software Modulerwasp_autocorrelation.wasp
Title produced by software(Partial) Autocorrelation Function
Date of computationWed, 13 Dec 2017 15:56:32 +0100
Cite this page as followsStatistical Computations at FreeStatistics.org, Office for Research Development and Education, URL https://freestatistics.org/blog/index.php?v=date/2017/Dec/13/t1513177282cm6fq67xwq85eks.htm/, Retrieved Wed, 15 May 2024 12:27:48 +0000
Statistical Computations at FreeStatistics.org, Office for Research Development and Education, URL https://freestatistics.org/blog/index.php?pk=309326, Retrieved Wed, 15 May 2024 12:27:48 +0000
QR Codes:

Original text written by user:
IsPrivate?No (this computation is public)
User-defined keywords
Estimated Impact64
Family? (F = Feedback message, R = changed R code, M = changed R Module, P = changed Parameters, D = changed Data)
-       [(Partial) Autocorrelation Function] [Autocorrelatie fu...] [2017-12-13 14:56:32] [71733e7e3fc4cdee2971288e32d35d04] [Current]
Feedback Forum

Post a new message
Dataseries X:
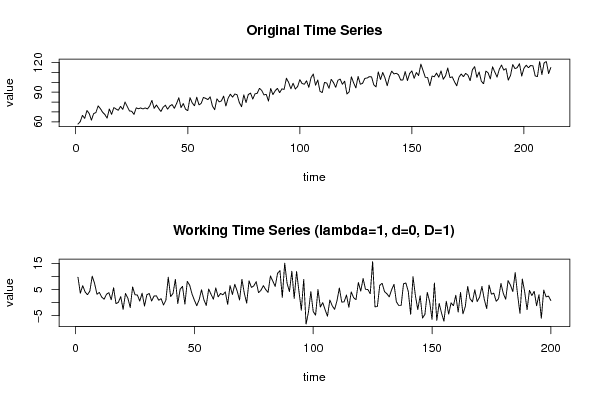
57.7
60.1
66.5
63.4
71.4
68.5
61.6
68.3
69.3
76.1
73.3
69.7
67.4
63.7
73
67.5
74.4
72.9
71.7
75.6
72.5
80
75.4
71
70.6
67.5
74.1
73.2
74
73
74
73
76
81.7
73.5
77
73.6
70.4
74.7
76.8
72.7
76
77.5
73.6
78.5
84.3
74.4
78.5
72.7
71.3
84.4
79.1
76.2
84.9
77.1
78.7
84.7
83.7
82.5
85.2
76
72.2
83.2
80.2
81.1
86
76
83.9
87.9
85
88.1
87.4
79.5
75.2
87.3
79.5
87.6
89.1
83
88.3
88.9
93.9
91.7
87.2
87.8
81
93.7
87.5
91.4
93.8
89.5
93.3
92.8
104.1
99.9
93.4
99
93.2
95.7
102.6
98.8
98
101.5
94.9
104.7
108.4
97
102.3
90.8
89.6
99.9
99.2
94
103
99.8
94.9
102
103.2
98
101.1
88.2
90.3
105.5
99.4
94.3
105.9
98
99
103.9
104.3
105.7
105.5
97.4
95.4
110.5
102.8
110
104.3
96.5
105.6
111.3
108.5
109.1
107.7
102.3
102.4
110.8
101.7
108.9
111.5
104
109.9
106.8
118.4
111.8
105
104.9
96.5
106.3
105.6
109.3
105.1
111.5
103.1
106.5
114.4
104.7
105.5
100.5
96.4
105.1
108.4
105.7
109
107.2
101.6
112.7
115.9
105
110.4
100.9
98.5
111.3
109.6
103.4
115.7
110.4
105.2
113.2
117.4
112.3
113.9
102.2
106.9
118
113.8
114.9
118.8
106.3
114.2
117.3
114.7
117
116.6
106.5
105.7
121
107.8
119.7
121
108.8
115


Summary of computational transaction
Raw Input view raw input (R code)
Raw Outputview raw output of R engine
Computing time3 seconds
R ServerBig Analytics Cloud Computing Center

\begin{tabular}{lllllllll}
\hline
Summary of computational transaction \tabularnewline
Raw Input view raw input (R code)  \tabularnewline
Raw Outputview raw output of R engine  \tabularnewline
Computing time3 seconds \tabularnewline
R ServerBig Analytics Cloud Computing Center \tabularnewline
\hline
\end{tabular}
%Source: https://freestatistics.org/blog/index.php?pk=309326&T=0

[TABLE]
[ROW]
Summary of computational transaction[/C][/ROW] [ROW]Raw Input[/C] view raw input (R code) [/C][/ROW] [ROW]Raw Output[/C]view raw output of R engine [/C][/ROW] [ROW]Computing time[/C]3 seconds[/C][/ROW] [ROW]R Server[/C]Big Analytics Cloud Computing Center[/C][/ROW] [/TABLE] Source: https://freestatistics.org/blog/index.php?pk=309326&T=0

Globally Unique Identifier (entire table): ba.freestatistics.org/blog/index.php?pk=309326&T=0

As an alternative you can also use a QR Code:  

The GUIDs for individual cells are displayed in the table below:

Summary of computational transaction
Raw Input view raw input (R code)
Raw Outputview raw output of R engine
Computing time3 seconds
R ServerBig Analytics Cloud Computing Center


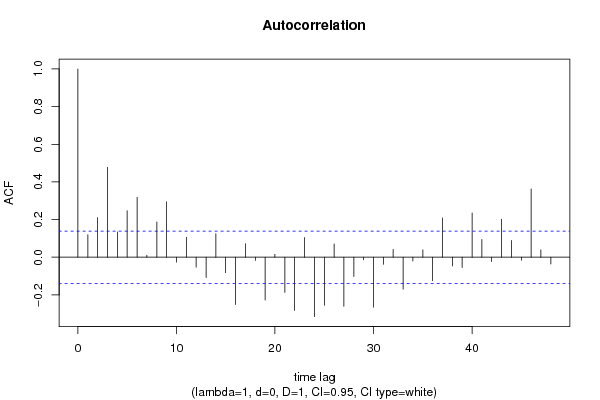
Autocorrelation Function
Time lag kACF(k)T-STATP-value
10.1193071.68730.046557
20.2102672.97360.001652
30.4776356.75480
40.1336551.89020.03009
50.2468463.49090.000296
60.3181364.49916e-06
70.0100480.14210.443571
80.1872112.64760.004377
90.2940084.15792.4e-05
10-0.026284-0.37170.355248
110.1060921.50040.067548
12-0.052615-0.74410.22885
13-0.107599-1.52170.064834
140.1248171.76520.03953
15-0.082561-1.16760.12218
16-0.251477-3.55640.000235
170.071611.01270.15621
18-0.016725-0.23650.406633
19-0.227812-3.22170.000744
200.0152490.21570.414737
21-0.187052-2.64530.004405
22-0.282996-4.00224.4e-05
230.1046311.47970.070263
24-0.315773-4.46577e-06
25-0.255135-3.60820.000195
260.0703810.99530.160387
27-0.260522-3.68430.000148
28-0.102259-1.44620.074848
29-0.013991-0.19790.421676
30-0.26514-3.74970.000116
31-0.037543-0.53090.298026
320.040570.57370.283394
33-0.169511-2.39720.00872
34-0.020023-0.28320.38867
350.0391290.55340.290314
36-0.124807-1.7650.039542
370.2087032.95150.00177
38-0.046841-0.66240.25423
39-0.054855-0.77580.219401
400.2344343.31540.000543
410.0944561.33580.091565
42-0.023258-0.32890.371282
430.2014252.84860.002425
440.089151.26080.10443
45-0.016425-0.23230.408277
460.3626635.12880
470.0388260.54910.291781
48-0.036084-0.51030.3052

\begin{tabular}{lllllllll}
\hline
Autocorrelation Function \tabularnewline
Time lag k & ACF(k) & T-STAT & P-value \tabularnewline
1 & 0.119307 & 1.6873 & 0.046557 \tabularnewline
2 & 0.210267 & 2.9736 & 0.001652 \tabularnewline
3 & 0.477635 & 6.7548 & 0 \tabularnewline
4 & 0.133655 & 1.8902 & 0.03009 \tabularnewline
5 & 0.246846 & 3.4909 & 0.000296 \tabularnewline
6 & 0.318136 & 4.4991 & 6e-06 \tabularnewline
7 & 0.010048 & 0.1421 & 0.443571 \tabularnewline
8 & 0.187211 & 2.6476 & 0.004377 \tabularnewline
9 & 0.294008 & 4.1579 & 2.4e-05 \tabularnewline
10 & -0.026284 & -0.3717 & 0.355248 \tabularnewline
11 & 0.106092 & 1.5004 & 0.067548 \tabularnewline
12 & -0.052615 & -0.7441 & 0.22885 \tabularnewline
13 & -0.107599 & -1.5217 & 0.064834 \tabularnewline
14 & 0.124817 & 1.7652 & 0.03953 \tabularnewline
15 & -0.082561 & -1.1676 & 0.12218 \tabularnewline
16 & -0.251477 & -3.5564 & 0.000235 \tabularnewline
17 & 0.07161 & 1.0127 & 0.15621 \tabularnewline
18 & -0.016725 & -0.2365 & 0.406633 \tabularnewline
19 & -0.227812 & -3.2217 & 0.000744 \tabularnewline
20 & 0.015249 & 0.2157 & 0.414737 \tabularnewline
21 & -0.187052 & -2.6453 & 0.004405 \tabularnewline
22 & -0.282996 & -4.0022 & 4.4e-05 \tabularnewline
23 & 0.104631 & 1.4797 & 0.070263 \tabularnewline
24 & -0.315773 & -4.4657 & 7e-06 \tabularnewline
25 & -0.255135 & -3.6082 & 0.000195 \tabularnewline
26 & 0.070381 & 0.9953 & 0.160387 \tabularnewline
27 & -0.260522 & -3.6843 & 0.000148 \tabularnewline
28 & -0.102259 & -1.4462 & 0.074848 \tabularnewline
29 & -0.013991 & -0.1979 & 0.421676 \tabularnewline
30 & -0.26514 & -3.7497 & 0.000116 \tabularnewline
31 & -0.037543 & -0.5309 & 0.298026 \tabularnewline
32 & 0.04057 & 0.5737 & 0.283394 \tabularnewline
33 & -0.169511 & -2.3972 & 0.00872 \tabularnewline
34 & -0.020023 & -0.2832 & 0.38867 \tabularnewline
35 & 0.039129 & 0.5534 & 0.290314 \tabularnewline
36 & -0.124807 & -1.765 & 0.039542 \tabularnewline
37 & 0.208703 & 2.9515 & 0.00177 \tabularnewline
38 & -0.046841 & -0.6624 & 0.25423 \tabularnewline
39 & -0.054855 & -0.7758 & 0.219401 \tabularnewline
40 & 0.234434 & 3.3154 & 0.000543 \tabularnewline
41 & 0.094456 & 1.3358 & 0.091565 \tabularnewline
42 & -0.023258 & -0.3289 & 0.371282 \tabularnewline
43 & 0.201425 & 2.8486 & 0.002425 \tabularnewline
44 & 0.08915 & 1.2608 & 0.10443 \tabularnewline
45 & -0.016425 & -0.2323 & 0.408277 \tabularnewline
46 & 0.362663 & 5.1288 & 0 \tabularnewline
47 & 0.038826 & 0.5491 & 0.291781 \tabularnewline
48 & -0.036084 & -0.5103 & 0.3052 \tabularnewline
\hline
\end{tabular}
%Source: https://freestatistics.org/blog/index.php?pk=309326&T=1

[TABLE]
[ROW][C]Autocorrelation Function[/C][/ROW]
[ROW][C]Time lag k[/C][C]ACF(k)[/C][C]T-STAT[/C][C]P-value[/C][/ROW]
[ROW][C]1[/C][C]0.119307[/C][C]1.6873[/C][C]0.046557[/C][/ROW]
[ROW][C]2[/C][C]0.210267[/C][C]2.9736[/C][C]0.001652[/C][/ROW]
[ROW][C]3[/C][C]0.477635[/C][C]6.7548[/C][C]0[/C][/ROW]
[ROW][C]4[/C][C]0.133655[/C][C]1.8902[/C][C]0.03009[/C][/ROW]
[ROW][C]5[/C][C]0.246846[/C][C]3.4909[/C][C]0.000296[/C][/ROW]
[ROW][C]6[/C][C]0.318136[/C][C]4.4991[/C][C]6e-06[/C][/ROW]
[ROW][C]7[/C][C]0.010048[/C][C]0.1421[/C][C]0.443571[/C][/ROW]
[ROW][C]8[/C][C]0.187211[/C][C]2.6476[/C][C]0.004377[/C][/ROW]
[ROW][C]9[/C][C]0.294008[/C][C]4.1579[/C][C]2.4e-05[/C][/ROW]
[ROW][C]10[/C][C]-0.026284[/C][C]-0.3717[/C][C]0.355248[/C][/ROW]
[ROW][C]11[/C][C]0.106092[/C][C]1.5004[/C][C]0.067548[/C][/ROW]
[ROW][C]12[/C][C]-0.052615[/C][C]-0.7441[/C][C]0.22885[/C][/ROW]
[ROW][C]13[/C][C]-0.107599[/C][C]-1.5217[/C][C]0.064834[/C][/ROW]
[ROW][C]14[/C][C]0.124817[/C][C]1.7652[/C][C]0.03953[/C][/ROW]
[ROW][C]15[/C][C]-0.082561[/C][C]-1.1676[/C][C]0.12218[/C][/ROW]
[ROW][C]16[/C][C]-0.251477[/C][C]-3.5564[/C][C]0.000235[/C][/ROW]
[ROW][C]17[/C][C]0.07161[/C][C]1.0127[/C][C]0.15621[/C][/ROW]
[ROW][C]18[/C][C]-0.016725[/C][C]-0.2365[/C][C]0.406633[/C][/ROW]
[ROW][C]19[/C][C]-0.227812[/C][C]-3.2217[/C][C]0.000744[/C][/ROW]
[ROW][C]20[/C][C]0.015249[/C][C]0.2157[/C][C]0.414737[/C][/ROW]
[ROW][C]21[/C][C]-0.187052[/C][C]-2.6453[/C][C]0.004405[/C][/ROW]
[ROW][C]22[/C][C]-0.282996[/C][C]-4.0022[/C][C]4.4e-05[/C][/ROW]
[ROW][C]23[/C][C]0.104631[/C][C]1.4797[/C][C]0.070263[/C][/ROW]
[ROW][C]24[/C][C]-0.315773[/C][C]-4.4657[/C][C]7e-06[/C][/ROW]
[ROW][C]25[/C][C]-0.255135[/C][C]-3.6082[/C][C]0.000195[/C][/ROW]
[ROW][C]26[/C][C]0.070381[/C][C]0.9953[/C][C]0.160387[/C][/ROW]
[ROW][C]27[/C][C]-0.260522[/C][C]-3.6843[/C][C]0.000148[/C][/ROW]
[ROW][C]28[/C][C]-0.102259[/C][C]-1.4462[/C][C]0.074848[/C][/ROW]
[ROW][C]29[/C][C]-0.013991[/C][C]-0.1979[/C][C]0.421676[/C][/ROW]
[ROW][C]30[/C][C]-0.26514[/C][C]-3.7497[/C][C]0.000116[/C][/ROW]
[ROW][C]31[/C][C]-0.037543[/C][C]-0.5309[/C][C]0.298026[/C][/ROW]
[ROW][C]32[/C][C]0.04057[/C][C]0.5737[/C][C]0.283394[/C][/ROW]
[ROW][C]33[/C][C]-0.169511[/C][C]-2.3972[/C][C]0.00872[/C][/ROW]
[ROW][C]34[/C][C]-0.020023[/C][C]-0.2832[/C][C]0.38867[/C][/ROW]
[ROW][C]35[/C][C]0.039129[/C][C]0.5534[/C][C]0.290314[/C][/ROW]
[ROW][C]36[/C][C]-0.124807[/C][C]-1.765[/C][C]0.039542[/C][/ROW]
[ROW][C]37[/C][C]0.208703[/C][C]2.9515[/C][C]0.00177[/C][/ROW]
[ROW][C]38[/C][C]-0.046841[/C][C]-0.6624[/C][C]0.25423[/C][/ROW]
[ROW][C]39[/C][C]-0.054855[/C][C]-0.7758[/C][C]0.219401[/C][/ROW]
[ROW][C]40[/C][C]0.234434[/C][C]3.3154[/C][C]0.000543[/C][/ROW]
[ROW][C]41[/C][C]0.094456[/C][C]1.3358[/C][C]0.091565[/C][/ROW]
[ROW][C]42[/C][C]-0.023258[/C][C]-0.3289[/C][C]0.371282[/C][/ROW]
[ROW][C]43[/C][C]0.201425[/C][C]2.8486[/C][C]0.002425[/C][/ROW]
[ROW][C]44[/C][C]0.08915[/C][C]1.2608[/C][C]0.10443[/C][/ROW]
[ROW][C]45[/C][C]-0.016425[/C][C]-0.2323[/C][C]0.408277[/C][/ROW]
[ROW][C]46[/C][C]0.362663[/C][C]5.1288[/C][C]0[/C][/ROW]
[ROW][C]47[/C][C]0.038826[/C][C]0.5491[/C][C]0.291781[/C][/ROW]
[ROW][C]48[/C][C]-0.036084[/C][C]-0.5103[/C][C]0.3052[/C][/ROW]
[/TABLE]
Source: https://freestatistics.org/blog/index.php?pk=309326&T=1

Globally Unique Identifier (entire table): ba.freestatistics.org/blog/index.php?pk=309326&T=1

As an alternative you can also use a QR Code:  

The GUIDs for individual cells are displayed in the table below:

Autocorrelation Function
Time lag kACF(k)T-STATP-value
10.1193071.68730.046557
20.2102672.97360.001652
30.4776356.75480
40.1336551.89020.03009
50.2468463.49090.000296
60.3181364.49916e-06
70.0100480.14210.443571
80.1872112.64760.004377
90.2940084.15792.4e-05
10-0.026284-0.37170.355248
110.1060921.50040.067548
12-0.052615-0.74410.22885
13-0.107599-1.52170.064834
140.1248171.76520.03953
15-0.082561-1.16760.12218
16-0.251477-3.55640.000235
170.071611.01270.15621
18-0.016725-0.23650.406633
19-0.227812-3.22170.000744
200.0152490.21570.414737
21-0.187052-2.64530.004405
22-0.282996-4.00224.4e-05
230.1046311.47970.070263
24-0.315773-4.46577e-06
25-0.255135-3.60820.000195
260.0703810.99530.160387
27-0.260522-3.68430.000148
28-0.102259-1.44620.074848
29-0.013991-0.19790.421676
30-0.26514-3.74970.000116
31-0.037543-0.53090.298026
320.040570.57370.283394
33-0.169511-2.39720.00872
34-0.020023-0.28320.38867
350.0391290.55340.290314
36-0.124807-1.7650.039542
370.2087032.95150.00177
38-0.046841-0.66240.25423
39-0.054855-0.77580.219401
400.2344343.31540.000543
410.0944561.33580.091565
42-0.023258-0.32890.371282
430.2014252.84860.002425
440.089151.26080.10443
45-0.016425-0.23230.408277
460.3626635.12880
470.0388260.54910.291781
48-0.036084-0.51030.3052


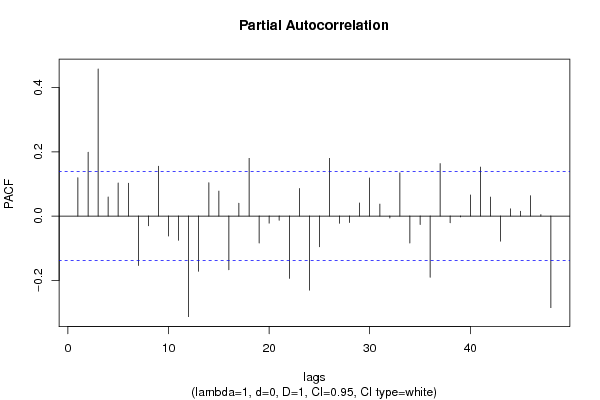
Partial Autocorrelation Function
Time lag kPACF(k)T-STATP-value
10.1193071.68730.046557
20.1988642.81240.002704
30.4581956.47990
40.059160.83660.201895
50.1030881.45790.073219
60.1020661.44340.075231
7-0.154093-2.17920.015242
8-0.030292-0.42840.334414
90.1549852.19180.014773
10-0.06195-0.87610.191012
11-0.075439-1.06690.143658
12-0.313296-4.43078e-06
13-0.171664-2.42770.00804
140.1039881.47060.071484
150.077741.09940.136455
16-0.167304-2.3660.009468
170.0396880.56130.287619
180.1796972.54130.005901
19-0.08396-1.18740.118244
20-0.022106-0.31260.377444
21-0.013077-0.18490.426732
22-0.194073-2.74460.003305
230.0860641.21710.112494
24-0.230718-3.26280.000649
25-0.095477-1.35030.089231
260.1797152.54160.005897
27-0.022469-0.31780.375498
28-0.020301-0.28710.387169
290.0406560.5750.28298
300.1183381.67350.047891
310.0371850.52590.299779
32-0.006111-0.08640.465607
330.1344811.90180.029315
34-0.083969-1.18750.118219
35-0.0261-0.36910.35622
36-0.190436-2.69320.003839
370.1634012.31080.010931
38-0.021038-0.29750.383188
39-0.002544-0.0360.48567
400.0654340.92540.177941
410.1523572.15460.016192
420.0589380.83350.202776
43-0.078014-1.10330.135615
440.0224220.31710.375749
450.0152170.21520.414913
460.06320.89380.186255
470.0046180.06530.473994
48-0.285314-4.03493.9e-05

\begin{tabular}{lllllllll}
\hline
Partial Autocorrelation Function \tabularnewline
Time lag k & PACF(k) & T-STAT & P-value \tabularnewline
1 & 0.119307 & 1.6873 & 0.046557 \tabularnewline
2 & 0.198864 & 2.8124 & 0.002704 \tabularnewline
3 & 0.458195 & 6.4799 & 0 \tabularnewline
4 & 0.05916 & 0.8366 & 0.201895 \tabularnewline
5 & 0.103088 & 1.4579 & 0.073219 \tabularnewline
6 & 0.102066 & 1.4434 & 0.075231 \tabularnewline
7 & -0.154093 & -2.1792 & 0.015242 \tabularnewline
8 & -0.030292 & -0.4284 & 0.334414 \tabularnewline
9 & 0.154985 & 2.1918 & 0.014773 \tabularnewline
10 & -0.06195 & -0.8761 & 0.191012 \tabularnewline
11 & -0.075439 & -1.0669 & 0.143658 \tabularnewline
12 & -0.313296 & -4.4307 & 8e-06 \tabularnewline
13 & -0.171664 & -2.4277 & 0.00804 \tabularnewline
14 & 0.103988 & 1.4706 & 0.071484 \tabularnewline
15 & 0.07774 & 1.0994 & 0.136455 \tabularnewline
16 & -0.167304 & -2.366 & 0.009468 \tabularnewline
17 & 0.039688 & 0.5613 & 0.287619 \tabularnewline
18 & 0.179697 & 2.5413 & 0.005901 \tabularnewline
19 & -0.08396 & -1.1874 & 0.118244 \tabularnewline
20 & -0.022106 & -0.3126 & 0.377444 \tabularnewline
21 & -0.013077 & -0.1849 & 0.426732 \tabularnewline
22 & -0.194073 & -2.7446 & 0.003305 \tabularnewline
23 & 0.086064 & 1.2171 & 0.112494 \tabularnewline
24 & -0.230718 & -3.2628 & 0.000649 \tabularnewline
25 & -0.095477 & -1.3503 & 0.089231 \tabularnewline
26 & 0.179715 & 2.5416 & 0.005897 \tabularnewline
27 & -0.022469 & -0.3178 & 0.375498 \tabularnewline
28 & -0.020301 & -0.2871 & 0.387169 \tabularnewline
29 & 0.040656 & 0.575 & 0.28298 \tabularnewline
30 & 0.118338 & 1.6735 & 0.047891 \tabularnewline
31 & 0.037185 & 0.5259 & 0.299779 \tabularnewline
32 & -0.006111 & -0.0864 & 0.465607 \tabularnewline
33 & 0.134481 & 1.9018 & 0.029315 \tabularnewline
34 & -0.083969 & -1.1875 & 0.118219 \tabularnewline
35 & -0.0261 & -0.3691 & 0.35622 \tabularnewline
36 & -0.190436 & -2.6932 & 0.003839 \tabularnewline
37 & 0.163401 & 2.3108 & 0.010931 \tabularnewline
38 & -0.021038 & -0.2975 & 0.383188 \tabularnewline
39 & -0.002544 & -0.036 & 0.48567 \tabularnewline
40 & 0.065434 & 0.9254 & 0.177941 \tabularnewline
41 & 0.152357 & 2.1546 & 0.016192 \tabularnewline
42 & 0.058938 & 0.8335 & 0.202776 \tabularnewline
43 & -0.078014 & -1.1033 & 0.135615 \tabularnewline
44 & 0.022422 & 0.3171 & 0.375749 \tabularnewline
45 & 0.015217 & 0.2152 & 0.414913 \tabularnewline
46 & 0.0632 & 0.8938 & 0.186255 \tabularnewline
47 & 0.004618 & 0.0653 & 0.473994 \tabularnewline
48 & -0.285314 & -4.0349 & 3.9e-05 \tabularnewline
\hline
\end{tabular}
%Source: https://freestatistics.org/blog/index.php?pk=309326&T=2

[TABLE]
[ROW][C]Partial Autocorrelation Function[/C][/ROW]
[ROW][C]Time lag k[/C][C]PACF(k)[/C][C]T-STAT[/C][C]P-value[/C][/ROW]
[ROW][C]1[/C][C]0.119307[/C][C]1.6873[/C][C]0.046557[/C][/ROW]
[ROW][C]2[/C][C]0.198864[/C][C]2.8124[/C][C]0.002704[/C][/ROW]
[ROW][C]3[/C][C]0.458195[/C][C]6.4799[/C][C]0[/C][/ROW]
[ROW][C]4[/C][C]0.05916[/C][C]0.8366[/C][C]0.201895[/C][/ROW]
[ROW][C]5[/C][C]0.103088[/C][C]1.4579[/C][C]0.073219[/C][/ROW]
[ROW][C]6[/C][C]0.102066[/C][C]1.4434[/C][C]0.075231[/C][/ROW]
[ROW][C]7[/C][C]-0.154093[/C][C]-2.1792[/C][C]0.015242[/C][/ROW]
[ROW][C]8[/C][C]-0.030292[/C][C]-0.4284[/C][C]0.334414[/C][/ROW]
[ROW][C]9[/C][C]0.154985[/C][C]2.1918[/C][C]0.014773[/C][/ROW]
[ROW][C]10[/C][C]-0.06195[/C][C]-0.8761[/C][C]0.191012[/C][/ROW]
[ROW][C]11[/C][C]-0.075439[/C][C]-1.0669[/C][C]0.143658[/C][/ROW]
[ROW][C]12[/C][C]-0.313296[/C][C]-4.4307[/C][C]8e-06[/C][/ROW]
[ROW][C]13[/C][C]-0.171664[/C][C]-2.4277[/C][C]0.00804[/C][/ROW]
[ROW][C]14[/C][C]0.103988[/C][C]1.4706[/C][C]0.071484[/C][/ROW]
[ROW][C]15[/C][C]0.07774[/C][C]1.0994[/C][C]0.136455[/C][/ROW]
[ROW][C]16[/C][C]-0.167304[/C][C]-2.366[/C][C]0.009468[/C][/ROW]
[ROW][C]17[/C][C]0.039688[/C][C]0.5613[/C][C]0.287619[/C][/ROW]
[ROW][C]18[/C][C]0.179697[/C][C]2.5413[/C][C]0.005901[/C][/ROW]
[ROW][C]19[/C][C]-0.08396[/C][C]-1.1874[/C][C]0.118244[/C][/ROW]
[ROW][C]20[/C][C]-0.022106[/C][C]-0.3126[/C][C]0.377444[/C][/ROW]
[ROW][C]21[/C][C]-0.013077[/C][C]-0.1849[/C][C]0.426732[/C][/ROW]
[ROW][C]22[/C][C]-0.194073[/C][C]-2.7446[/C][C]0.003305[/C][/ROW]
[ROW][C]23[/C][C]0.086064[/C][C]1.2171[/C][C]0.112494[/C][/ROW]
[ROW][C]24[/C][C]-0.230718[/C][C]-3.2628[/C][C]0.000649[/C][/ROW]
[ROW][C]25[/C][C]-0.095477[/C][C]-1.3503[/C][C]0.089231[/C][/ROW]
[ROW][C]26[/C][C]0.179715[/C][C]2.5416[/C][C]0.005897[/C][/ROW]
[ROW][C]27[/C][C]-0.022469[/C][C]-0.3178[/C][C]0.375498[/C][/ROW]
[ROW][C]28[/C][C]-0.020301[/C][C]-0.2871[/C][C]0.387169[/C][/ROW]
[ROW][C]29[/C][C]0.040656[/C][C]0.575[/C][C]0.28298[/C][/ROW]
[ROW][C]30[/C][C]0.118338[/C][C]1.6735[/C][C]0.047891[/C][/ROW]
[ROW][C]31[/C][C]0.037185[/C][C]0.5259[/C][C]0.299779[/C][/ROW]
[ROW][C]32[/C][C]-0.006111[/C][C]-0.0864[/C][C]0.465607[/C][/ROW]
[ROW][C]33[/C][C]0.134481[/C][C]1.9018[/C][C]0.029315[/C][/ROW]
[ROW][C]34[/C][C]-0.083969[/C][C]-1.1875[/C][C]0.118219[/C][/ROW]
[ROW][C]35[/C][C]-0.0261[/C][C]-0.3691[/C][C]0.35622[/C][/ROW]
[ROW][C]36[/C][C]-0.190436[/C][C]-2.6932[/C][C]0.003839[/C][/ROW]
[ROW][C]37[/C][C]0.163401[/C][C]2.3108[/C][C]0.010931[/C][/ROW]
[ROW][C]38[/C][C]-0.021038[/C][C]-0.2975[/C][C]0.383188[/C][/ROW]
[ROW][C]39[/C][C]-0.002544[/C][C]-0.036[/C][C]0.48567[/C][/ROW]
[ROW][C]40[/C][C]0.065434[/C][C]0.9254[/C][C]0.177941[/C][/ROW]
[ROW][C]41[/C][C]0.152357[/C][C]2.1546[/C][C]0.016192[/C][/ROW]
[ROW][C]42[/C][C]0.058938[/C][C]0.8335[/C][C]0.202776[/C][/ROW]
[ROW][C]43[/C][C]-0.078014[/C][C]-1.1033[/C][C]0.135615[/C][/ROW]
[ROW][C]44[/C][C]0.022422[/C][C]0.3171[/C][C]0.375749[/C][/ROW]
[ROW][C]45[/C][C]0.015217[/C][C]0.2152[/C][C]0.414913[/C][/ROW]
[ROW][C]46[/C][C]0.0632[/C][C]0.8938[/C][C]0.186255[/C][/ROW]
[ROW][C]47[/C][C]0.004618[/C][C]0.0653[/C][C]0.473994[/C][/ROW]
[ROW][C]48[/C][C]-0.285314[/C][C]-4.0349[/C][C]3.9e-05[/C][/ROW]
[/TABLE]
Source: https://freestatistics.org/blog/index.php?pk=309326&T=2

Globally Unique Identifier (entire table): ba.freestatistics.org/blog/index.php?pk=309326&T=2

As an alternative you can also use a QR Code:  

The GUIDs for individual cells are displayed in the table below:

Partial Autocorrelation Function
Time lag kPACF(k)T-STATP-value
10.1193071.68730.046557
20.1988642.81240.002704
30.4581956.47990
40.059160.83660.201895
50.1030881.45790.073219
60.1020661.44340.075231
7-0.154093-2.17920.015242
8-0.030292-0.42840.334414
90.1549852.19180.014773
10-0.06195-0.87610.191012
11-0.075439-1.06690.143658
12-0.313296-4.43078e-06
13-0.171664-2.42770.00804
140.1039881.47060.071484
150.077741.09940.136455
16-0.167304-2.3660.009468
170.0396880.56130.287619
180.1796972.54130.005901
19-0.08396-1.18740.118244
20-0.022106-0.31260.377444
21-0.013077-0.18490.426732
22-0.194073-2.74460.003305
230.0860641.21710.112494
24-0.230718-3.26280.000649
25-0.095477-1.35030.089231
260.1797152.54160.005897
27-0.022469-0.31780.375498
28-0.020301-0.28710.387169
290.0406560.5750.28298
300.1183381.67350.047891
310.0371850.52590.299779
32-0.006111-0.08640.465607
330.1344811.90180.029315
34-0.083969-1.18750.118219
35-0.0261-0.36910.35622
36-0.190436-2.69320.003839
370.1634012.31080.010931
38-0.021038-0.29750.383188
39-0.002544-0.0360.48567
400.0654340.92540.177941
410.1523572.15460.016192
420.0589380.83350.202776
43-0.078014-1.10330.135615
440.0224220.31710.375749
450.0152170.21520.414913
460.06320.89380.186255
470.0046180.06530.473994
48-0.285314-4.03493.9e-05


Parameters (Session):
par1 = 48 ; par2 = 1 ; par3 = 0 ; par4 = 1 ; par5 = 12 ; par6 = White Noise ; par7 = 0.95 ;
Parameters (R input):
par1 = 48 ; par2 = 1 ; par3 = 0 ; par4 = 1 ; par5 = 12 ; par6 = White Noise ; par7 = 0.95 ; par8 = ;
R code (references can be found in the software module):
par8 <- ''
par7 <- '0.95'
par6 <- 'White Noise'
par5 <- '12'
par4 <- '1'
par3 <- '1'
par2 <- '1'
par1 <- '48'
if (par1 == 'Default') {
par1 = 10*log10(length(x))
} else {
par1 <- as.numeric(par1)
}
par2 <- as.numeric(par2)
par3 <- as.numeric(par3)
par4 <- as.numeric(par4)
par5 <- as.numeric(par5)
if (par6 == 'White Noise') par6 <- 'white' else par6 <- 'ma'
par7 <- as.numeric(par7)
if (par8 != '') par8 <- as.numeric(par8)
x <- na.omit(x)
ox <- x
if (par8 == '') {
if (par2 == 0) {
x <- log(x)
} else {
x <- (x ^ par2 - 1) / par2
}
} else {
x <- log(x,base=par8)
}
if (par3 > 0) x <- diff(x,lag=1,difference=par3)
if (par4 > 0) x <- diff(x,lag=par5,difference=par4)
bitmap(file='picts.png')
op <- par(mfrow=c(2,1))
plot(ox,type='l',main='Original Time Series',xlab='time',ylab='value')
if (par8=='') {
mytitle <- paste('Working Time Series (lambda=',par2,', d=',par3,', D=',par4,')',sep='')
mysub <- paste('(lambda=',par2,', d=',par3,', D=',par4,', CI=', par7, ', CI type=',par6,')',sep='')
} else {
mytitle <- paste('Working Time Series (base=',par8,', d=',par3,', D=',par4,')',sep='')
mysub <- paste('(base=',par8,', d=',par3,', D=',par4,', CI=', par7, ', CI type=',par6,')',sep='')
}
plot(x,type='l', main=mytitle,xlab='time',ylab='value')
par(op)
dev.off()
bitmap(file='pic1.png')
racf <- acf(x, par1, main='Autocorrelation', xlab='time lag', ylab='ACF', ci.type=par6, ci=par7, sub=mysub)
dev.off()
bitmap(file='pic2.png')
rpacf <- pacf(x,par1,main='Partial Autocorrelation',xlab='lags',ylab='PACF',sub=mysub)
dev.off()
(myacf <- c(racf$acf))
(mypacf <- c(rpacf$acf))
lengthx <- length(x)
sqrtn <- sqrt(lengthx)
load(file='createtable')
a<-table.start()
a<-table.row.start(a)
a<-table.element(a,'Autocorrelation Function',4,TRUE)
a<-table.row.end(a)
a<-table.row.start(a)
a<-table.element(a,'Time lag k',header=TRUE)
a<-table.element(a,'ACF(k)',header=TRUE)
a<-table.element(a,'T-STAT',header=TRUE)
a<-table.element(a,'P-value',header=TRUE)
a<-table.row.end(a)
for (i in 2:(par1+1)) {
a<-table.row.start(a)
a<-table.element(a,i-1,header=TRUE)
a<-table.element(a,round(myacf[i],6))
mytstat <- myacf[i]*sqrtn
a<-table.element(a,round(mytstat,4))
a<-table.element(a,round(1-pt(abs(mytstat),lengthx),6))
a<-table.row.end(a)
}
a<-table.end(a)
table.save(a,file='mytable.tab')
a<-table.start()
a<-table.row.start(a)
a<-table.element(a,'Partial Autocorrelation Function',4,TRUE)
a<-table.row.end(a)
a<-table.row.start(a)
a<-table.element(a,'Time lag k',header=TRUE)
a<-table.element(a,'PACF(k)',header=TRUE)
a<-table.element(a,'T-STAT',header=TRUE)
a<-table.element(a,'P-value',header=TRUE)
a<-table.row.end(a)
for (i in 1:par1) {
a<-table.row.start(a)
a<-table.element(a,i,header=TRUE)
a<-table.element(a,round(mypacf[i],6))
mytstat <- mypacf[i]*sqrtn
a<-table.element(a,round(mytstat,4))
a<-table.element(a,round(1-pt(abs(mytstat),lengthx),6))
a<-table.row.end(a)
}
a<-table.end(a)
table.save(a,file='mytable1.tab')