Free Statistics

of Irreproducible Research!

Author's title

Author*The author of this computation has been verified*
R Software Modulerwasp_autocorrelation.wasp
Title produced by software(Partial) Autocorrelation Function
Date of computationWed, 13 Dec 2017 15:01:33 +0100
Cite this page as followsStatistical Computations at FreeStatistics.org, Office for Research Development and Education, URL https://freestatistics.org/blog/index.php?v=date/2017/Dec/13/t1513174269jrhljwb7k3k726l.htm/, Retrieved Wed, 15 May 2024 23:22:41 +0000
Statistical Computations at FreeStatistics.org, Office for Research Development and Education, URL https://freestatistics.org/blog/index.php?pk=309315, Retrieved Wed, 15 May 2024 23:22:41 +0000
QR Codes:

Original text written by user:
IsPrivate?No (this computation is public)
User-defined keywords
Estimated Impact67
Family? (F = Feedback message, R = changed R code, M = changed R Module, P = changed Parameters, D = changed Data)
-       [(Partial) Autocorrelation Function] [Autocorrelation f...] [2017-12-13 14:01:33] [2b97d82843133ddef20cf33e30a14161] [Current]
Feedback Forum

Post a new message
Dataseries X:
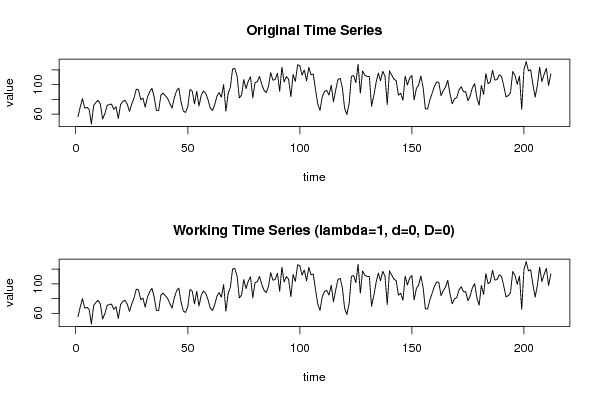
56.5
69.4
81
68
69.1
66.3
46.4
71.6
75.8
78.7
73.2
53.3
60.3
71.4
73.1
73.4
66.4
69.9
53.9
72.7
77.3
78.6
73.4
63.7
73.8
81.5
93.7
92.9
79.4
81.8
69.3
82.9
90.1
95
83.3
64.6
64.7
85.5
88.5
84.8
81.2
74.3
68.1
82.3
91.6
95.2
76.5
64
62.2
70
93.3
91.1
73.9
90.9
70.7
85.5
91.3
88.3
79.8
68.5
64.8
72.5
84.1
89.1
82.9
100.1
63.8
87.6
96.5
121.3
121.8
111.5
81.9
85.7
106.8
94.7
104.8
110.5
82
102.7
103.8
111.1
100.4
92.5
88.9
97.3
116.2
105.9
107.1
115.4
90.9
123.6
103.5
111
106.9
83.5
113.8
104.2
126.9
125.8
112.9
119.9
105.1
123.4
113.3
114.4
93
73.9
64.9
83.5
90.5
92.1
85.8
99.1
76.7
92.5
106.8
108.5
95.3
67.2
59.4
74.3
111.2
112.4
102.6
127.5
88.4
118.5
112.9
111.1
111
70.6
84.9
102.4
115.6
105.3
118
111.5
72.8
118.7
112.9
107.4
105.2
85.7
88.2
78.8
111.5
99.4
108.7
112.4
79.1
94.7
99.3
111.6
96.1
67.2
66.8
78.9
87.8
97
103.5
103
85
91.7
96.6
105.8
87.5
74
80.7
82.2
92.8
97.1
90.4
90.3
78.1
84.5
95.8
101.4
82.1
72
99
86.6
114.9
101.2
104
119.4
106.2
106.8
113.4
110.8
97.9
83.4
85
89
117.9
112.5
100.3
111.5
66.3
120.4
131.3
118.6
120
100.1
83
99.2
123.7
104
113.9
122.2
98.7
114.8


Summary of computational transaction
Raw Input view raw input (R code)
Raw Outputview raw output of R engine
Computing time3 seconds
R ServerBig Analytics Cloud Computing Center

\begin{tabular}{lllllllll}
\hline
Summary of computational transaction \tabularnewline
Raw Input view raw input (R code)  \tabularnewline
Raw Outputview raw output of R engine  \tabularnewline
Computing time3 seconds \tabularnewline
R ServerBig Analytics Cloud Computing Center \tabularnewline
\hline
\end{tabular}
%Source: https://freestatistics.org/blog/index.php?pk=309315&T=0

[TABLE]
[ROW]
Summary of computational transaction[/C][/ROW] [ROW]Raw Input[/C] view raw input (R code) [/C][/ROW] [ROW]Raw Output[/C]view raw output of R engine [/C][/ROW] [ROW]Computing time[/C]3 seconds[/C][/ROW] [ROW]R Server[/C]Big Analytics Cloud Computing Center[/C][/ROW] [/TABLE] Source: https://freestatistics.org/blog/index.php?pk=309315&T=0

Globally Unique Identifier (entire table): ba.freestatistics.org/blog/index.php?pk=309315&T=0

As an alternative you can also use a QR Code:  

The GUIDs for individual cells are displayed in the table below:

Summary of computational transaction
Raw Input view raw input (R code)
Raw Outputview raw output of R engine
Computing time3 seconds
R ServerBig Analytics Cloud Computing Center


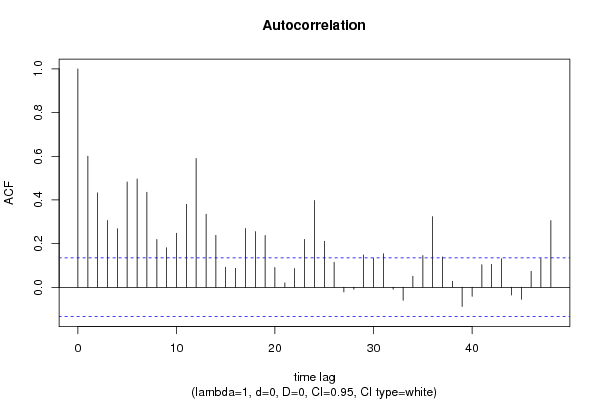
Autocorrelation Function
Time lag kACF(k)T-STATP-value
10.6003478.74120
20.4325086.29740
30.3062434.4597e-06
40.2680483.90286.4e-05
50.4818347.01560
60.4959017.22040
70.4352636.33750
80.2188783.18690.000828
90.1809012.6340.004531
100.2471863.59910.000199
110.380195.53570
120.5902248.59380
130.3342244.86641e-06
140.2376033.45960.000327
150.0921031.3410.090671
160.0873391.27170.102441
170.2692153.91986e-05
180.2548513.71070.000132
190.2368613.44880.00034
200.0906511.31990.094146
210.0200240.29160.385456
220.0859021.25070.106203
230.2192483.19230.000813
240.3978595.79290
250.2108553.07010.00121
260.1143181.66450.048746
27-0.021323-0.31050.378253
28-0.008976-0.13070.448069
290.1480222.15520.016135
300.1328481.93430.027204
310.1535232.23530.013219
32-0.009292-0.13530.446252
33-0.059252-0.86270.194633
340.050420.73410.231843
350.1450872.11250.017907
360.3235524.7112e-06
370.1383492.01440.022616
380.0275330.40090.344454
39-0.088361-1.28660.099825
40-0.040822-0.59440.276446
410.1029921.49960.067605
420.1050551.52960.0638
430.1310331.90790.02888
44-0.035716-0.520.301793
45-0.054792-0.79780.212943
460.0727991.060.145181
470.1318651.920.028101
480.3053594.44617e-06

\begin{tabular}{lllllllll}
\hline
Autocorrelation Function \tabularnewline
Time lag k & ACF(k) & T-STAT & P-value \tabularnewline
1 & 0.600347 & 8.7412 & 0 \tabularnewline
2 & 0.432508 & 6.2974 & 0 \tabularnewline
3 & 0.306243 & 4.459 & 7e-06 \tabularnewline
4 & 0.268048 & 3.9028 & 6.4e-05 \tabularnewline
5 & 0.481834 & 7.0156 & 0 \tabularnewline
6 & 0.495901 & 7.2204 & 0 \tabularnewline
7 & 0.435263 & 6.3375 & 0 \tabularnewline
8 & 0.218878 & 3.1869 & 0.000828 \tabularnewline
9 & 0.180901 & 2.634 & 0.004531 \tabularnewline
10 & 0.247186 & 3.5991 & 0.000199 \tabularnewline
11 & 0.38019 & 5.5357 & 0 \tabularnewline
12 & 0.590224 & 8.5938 & 0 \tabularnewline
13 & 0.334224 & 4.8664 & 1e-06 \tabularnewline
14 & 0.237603 & 3.4596 & 0.000327 \tabularnewline
15 & 0.092103 & 1.341 & 0.090671 \tabularnewline
16 & 0.087339 & 1.2717 & 0.102441 \tabularnewline
17 & 0.269215 & 3.9198 & 6e-05 \tabularnewline
18 & 0.254851 & 3.7107 & 0.000132 \tabularnewline
19 & 0.236861 & 3.4488 & 0.00034 \tabularnewline
20 & 0.090651 & 1.3199 & 0.094146 \tabularnewline
21 & 0.020024 & 0.2916 & 0.385456 \tabularnewline
22 & 0.085902 & 1.2507 & 0.106203 \tabularnewline
23 & 0.219248 & 3.1923 & 0.000813 \tabularnewline
24 & 0.397859 & 5.7929 & 0 \tabularnewline
25 & 0.210855 & 3.0701 & 0.00121 \tabularnewline
26 & 0.114318 & 1.6645 & 0.048746 \tabularnewline
27 & -0.021323 & -0.3105 & 0.378253 \tabularnewline
28 & -0.008976 & -0.1307 & 0.448069 \tabularnewline
29 & 0.148022 & 2.1552 & 0.016135 \tabularnewline
30 & 0.132848 & 1.9343 & 0.027204 \tabularnewline
31 & 0.153523 & 2.2353 & 0.013219 \tabularnewline
32 & -0.009292 & -0.1353 & 0.446252 \tabularnewline
33 & -0.059252 & -0.8627 & 0.194633 \tabularnewline
34 & 0.05042 & 0.7341 & 0.231843 \tabularnewline
35 & 0.145087 & 2.1125 & 0.017907 \tabularnewline
36 & 0.323552 & 4.711 & 2e-06 \tabularnewline
37 & 0.138349 & 2.0144 & 0.022616 \tabularnewline
38 & 0.027533 & 0.4009 & 0.344454 \tabularnewline
39 & -0.088361 & -1.2866 & 0.099825 \tabularnewline
40 & -0.040822 & -0.5944 & 0.276446 \tabularnewline
41 & 0.102992 & 1.4996 & 0.067605 \tabularnewline
42 & 0.105055 & 1.5296 & 0.0638 \tabularnewline
43 & 0.131033 & 1.9079 & 0.02888 \tabularnewline
44 & -0.035716 & -0.52 & 0.301793 \tabularnewline
45 & -0.054792 & -0.7978 & 0.212943 \tabularnewline
46 & 0.072799 & 1.06 & 0.145181 \tabularnewline
47 & 0.131865 & 1.92 & 0.028101 \tabularnewline
48 & 0.305359 & 4.4461 & 7e-06 \tabularnewline
\hline
\end{tabular}
%Source: https://freestatistics.org/blog/index.php?pk=309315&T=1

[TABLE]
[ROW][C]Autocorrelation Function[/C][/ROW]
[ROW][C]Time lag k[/C][C]ACF(k)[/C][C]T-STAT[/C][C]P-value[/C][/ROW]
[ROW][C]1[/C][C]0.600347[/C][C]8.7412[/C][C]0[/C][/ROW]
[ROW][C]2[/C][C]0.432508[/C][C]6.2974[/C][C]0[/C][/ROW]
[ROW][C]3[/C][C]0.306243[/C][C]4.459[/C][C]7e-06[/C][/ROW]
[ROW][C]4[/C][C]0.268048[/C][C]3.9028[/C][C]6.4e-05[/C][/ROW]
[ROW][C]5[/C][C]0.481834[/C][C]7.0156[/C][C]0[/C][/ROW]
[ROW][C]6[/C][C]0.495901[/C][C]7.2204[/C][C]0[/C][/ROW]
[ROW][C]7[/C][C]0.435263[/C][C]6.3375[/C][C]0[/C][/ROW]
[ROW][C]8[/C][C]0.218878[/C][C]3.1869[/C][C]0.000828[/C][/ROW]
[ROW][C]9[/C][C]0.180901[/C][C]2.634[/C][C]0.004531[/C][/ROW]
[ROW][C]10[/C][C]0.247186[/C][C]3.5991[/C][C]0.000199[/C][/ROW]
[ROW][C]11[/C][C]0.38019[/C][C]5.5357[/C][C]0[/C][/ROW]
[ROW][C]12[/C][C]0.590224[/C][C]8.5938[/C][C]0[/C][/ROW]
[ROW][C]13[/C][C]0.334224[/C][C]4.8664[/C][C]1e-06[/C][/ROW]
[ROW][C]14[/C][C]0.237603[/C][C]3.4596[/C][C]0.000327[/C][/ROW]
[ROW][C]15[/C][C]0.092103[/C][C]1.341[/C][C]0.090671[/C][/ROW]
[ROW][C]16[/C][C]0.087339[/C][C]1.2717[/C][C]0.102441[/C][/ROW]
[ROW][C]17[/C][C]0.269215[/C][C]3.9198[/C][C]6e-05[/C][/ROW]
[ROW][C]18[/C][C]0.254851[/C][C]3.7107[/C][C]0.000132[/C][/ROW]
[ROW][C]19[/C][C]0.236861[/C][C]3.4488[/C][C]0.00034[/C][/ROW]
[ROW][C]20[/C][C]0.090651[/C][C]1.3199[/C][C]0.094146[/C][/ROW]
[ROW][C]21[/C][C]0.020024[/C][C]0.2916[/C][C]0.385456[/C][/ROW]
[ROW][C]22[/C][C]0.085902[/C][C]1.2507[/C][C]0.106203[/C][/ROW]
[ROW][C]23[/C][C]0.219248[/C][C]3.1923[/C][C]0.000813[/C][/ROW]
[ROW][C]24[/C][C]0.397859[/C][C]5.7929[/C][C]0[/C][/ROW]
[ROW][C]25[/C][C]0.210855[/C][C]3.0701[/C][C]0.00121[/C][/ROW]
[ROW][C]26[/C][C]0.114318[/C][C]1.6645[/C][C]0.048746[/C][/ROW]
[ROW][C]27[/C][C]-0.021323[/C][C]-0.3105[/C][C]0.378253[/C][/ROW]
[ROW][C]28[/C][C]-0.008976[/C][C]-0.1307[/C][C]0.448069[/C][/ROW]
[ROW][C]29[/C][C]0.148022[/C][C]2.1552[/C][C]0.016135[/C][/ROW]
[ROW][C]30[/C][C]0.132848[/C][C]1.9343[/C][C]0.027204[/C][/ROW]
[ROW][C]31[/C][C]0.153523[/C][C]2.2353[/C][C]0.013219[/C][/ROW]
[ROW][C]32[/C][C]-0.009292[/C][C]-0.1353[/C][C]0.446252[/C][/ROW]
[ROW][C]33[/C][C]-0.059252[/C][C]-0.8627[/C][C]0.194633[/C][/ROW]
[ROW][C]34[/C][C]0.05042[/C][C]0.7341[/C][C]0.231843[/C][/ROW]
[ROW][C]35[/C][C]0.145087[/C][C]2.1125[/C][C]0.017907[/C][/ROW]
[ROW][C]36[/C][C]0.323552[/C][C]4.711[/C][C]2e-06[/C][/ROW]
[ROW][C]37[/C][C]0.138349[/C][C]2.0144[/C][C]0.022616[/C][/ROW]
[ROW][C]38[/C][C]0.027533[/C][C]0.4009[/C][C]0.344454[/C][/ROW]
[ROW][C]39[/C][C]-0.088361[/C][C]-1.2866[/C][C]0.099825[/C][/ROW]
[ROW][C]40[/C][C]-0.040822[/C][C]-0.5944[/C][C]0.276446[/C][/ROW]
[ROW][C]41[/C][C]0.102992[/C][C]1.4996[/C][C]0.067605[/C][/ROW]
[ROW][C]42[/C][C]0.105055[/C][C]1.5296[/C][C]0.0638[/C][/ROW]
[ROW][C]43[/C][C]0.131033[/C][C]1.9079[/C][C]0.02888[/C][/ROW]
[ROW][C]44[/C][C]-0.035716[/C][C]-0.52[/C][C]0.301793[/C][/ROW]
[ROW][C]45[/C][C]-0.054792[/C][C]-0.7978[/C][C]0.212943[/C][/ROW]
[ROW][C]46[/C][C]0.072799[/C][C]1.06[/C][C]0.145181[/C][/ROW]
[ROW][C]47[/C][C]0.131865[/C][C]1.92[/C][C]0.028101[/C][/ROW]
[ROW][C]48[/C][C]0.305359[/C][C]4.4461[/C][C]7e-06[/C][/ROW]
[/TABLE]
Source: https://freestatistics.org/blog/index.php?pk=309315&T=1

Globally Unique Identifier (entire table): ba.freestatistics.org/blog/index.php?pk=309315&T=1

As an alternative you can also use a QR Code:  

The GUIDs for individual cells are displayed in the table below:

Autocorrelation Function
Time lag kACF(k)T-STATP-value
10.6003478.74120
20.4325086.29740
30.3062434.4597e-06
40.2680483.90286.4e-05
50.4818347.01560
60.4959017.22040
70.4352636.33750
80.2188783.18690.000828
90.1809012.6340.004531
100.2471863.59910.000199
110.380195.53570
120.5902248.59380
130.3342244.86641e-06
140.2376033.45960.000327
150.0921031.3410.090671
160.0873391.27170.102441
170.2692153.91986e-05
180.2548513.71070.000132
190.2368613.44880.00034
200.0906511.31990.094146
210.0200240.29160.385456
220.0859021.25070.106203
230.2192483.19230.000813
240.3978595.79290
250.2108553.07010.00121
260.1143181.66450.048746
27-0.021323-0.31050.378253
28-0.008976-0.13070.448069
290.1480222.15520.016135
300.1328481.93430.027204
310.1535232.23530.013219
32-0.009292-0.13530.446252
33-0.059252-0.86270.194633
340.050420.73410.231843
350.1450872.11250.017907
360.3235524.7112e-06
370.1383492.01440.022616
380.0275330.40090.344454
39-0.088361-1.28660.099825
40-0.040822-0.59440.276446
410.1029921.49960.067605
420.1050551.52960.0638
430.1310331.90790.02888
44-0.035716-0.520.301793
45-0.054792-0.79780.212943
460.0727991.060.145181
470.1318651.920.028101
480.3053594.44617e-06


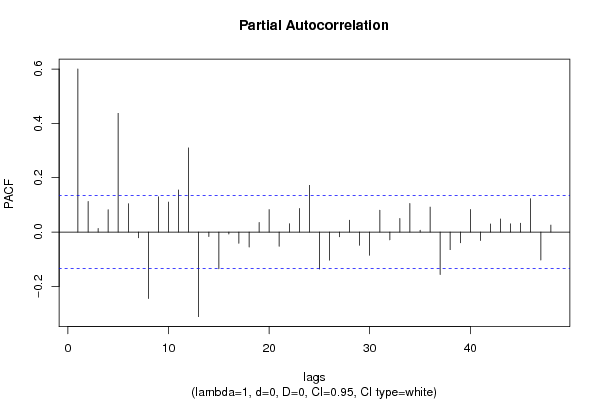
Partial Autocorrelation Function
Time lag kPACF(k)T-STATP-value
10.6003478.74120
20.1127161.64120.051122
30.0129660.18880.425221
40.0820761.1950.116702
50.4368686.36090
60.104231.51760.065301
7-0.020742-0.3020.381471
8-0.24452-3.56030.000229
90.1295531.88630.03031
100.1101771.60420.055079
110.154752.25320.012635
120.3097944.51075e-06
13-0.311215-4.53145e-06
14-0.016312-0.23750.406249
15-0.135008-1.96570.025317
16-0.00736-0.10720.457379
17-0.040823-0.59440.276441
18-0.054794-0.79780.212934
190.035010.50970.305379
200.0827911.20540.114687
21-0.052077-0.75830.224569
220.0307790.44810.327252
230.0870631.26770.103155
240.1718662.50240.006545
25-0.136174-1.98270.024344
26-0.103273-1.50370.067077
27-0.017043-0.24810.40213
280.0434310.63240.263917
29-0.048532-0.70660.240284
30-0.085318-1.24230.107757
310.0806671.17450.120751
32-0.028584-0.41620.338849
330.0498390.72570.234422
340.1052711.53280.063412
350.0064930.09450.462383
360.0918431.33730.091287
37-0.155983-2.27120.012071
38-0.064677-0.94170.173706
39-0.039547-0.57580.282678
400.0832041.21150.113532
41-0.030732-0.44750.327498
420.0295620.43040.333658
430.0483160.70350.24126
440.0302410.44030.330077
450.0324610.47260.318478
460.1228021.7880.0376
47-0.102458-1.49180.068618
480.0256470.37340.354605

\begin{tabular}{lllllllll}
\hline
Partial Autocorrelation Function \tabularnewline
Time lag k & PACF(k) & T-STAT & P-value \tabularnewline
1 & 0.600347 & 8.7412 & 0 \tabularnewline
2 & 0.112716 & 1.6412 & 0.051122 \tabularnewline
3 & 0.012966 & 0.1888 & 0.425221 \tabularnewline
4 & 0.082076 & 1.195 & 0.116702 \tabularnewline
5 & 0.436868 & 6.3609 & 0 \tabularnewline
6 & 0.10423 & 1.5176 & 0.065301 \tabularnewline
7 & -0.020742 & -0.302 & 0.381471 \tabularnewline
8 & -0.24452 & -3.5603 & 0.000229 \tabularnewline
9 & 0.129553 & 1.8863 & 0.03031 \tabularnewline
10 & 0.110177 & 1.6042 & 0.055079 \tabularnewline
11 & 0.15475 & 2.2532 & 0.012635 \tabularnewline
12 & 0.309794 & 4.5107 & 5e-06 \tabularnewline
13 & -0.311215 & -4.5314 & 5e-06 \tabularnewline
14 & -0.016312 & -0.2375 & 0.406249 \tabularnewline
15 & -0.135008 & -1.9657 & 0.025317 \tabularnewline
16 & -0.00736 & -0.1072 & 0.457379 \tabularnewline
17 & -0.040823 & -0.5944 & 0.276441 \tabularnewline
18 & -0.054794 & -0.7978 & 0.212934 \tabularnewline
19 & 0.03501 & 0.5097 & 0.305379 \tabularnewline
20 & 0.082791 & 1.2054 & 0.114687 \tabularnewline
21 & -0.052077 & -0.7583 & 0.224569 \tabularnewline
22 & 0.030779 & 0.4481 & 0.327252 \tabularnewline
23 & 0.087063 & 1.2677 & 0.103155 \tabularnewline
24 & 0.171866 & 2.5024 & 0.006545 \tabularnewline
25 & -0.136174 & -1.9827 & 0.024344 \tabularnewline
26 & -0.103273 & -1.5037 & 0.067077 \tabularnewline
27 & -0.017043 & -0.2481 & 0.40213 \tabularnewline
28 & 0.043431 & 0.6324 & 0.263917 \tabularnewline
29 & -0.048532 & -0.7066 & 0.240284 \tabularnewline
30 & -0.085318 & -1.2423 & 0.107757 \tabularnewline
31 & 0.080667 & 1.1745 & 0.120751 \tabularnewline
32 & -0.028584 & -0.4162 & 0.338849 \tabularnewline
33 & 0.049839 & 0.7257 & 0.234422 \tabularnewline
34 & 0.105271 & 1.5328 & 0.063412 \tabularnewline
35 & 0.006493 & 0.0945 & 0.462383 \tabularnewline
36 & 0.091843 & 1.3373 & 0.091287 \tabularnewline
37 & -0.155983 & -2.2712 & 0.012071 \tabularnewline
38 & -0.064677 & -0.9417 & 0.173706 \tabularnewline
39 & -0.039547 & -0.5758 & 0.282678 \tabularnewline
40 & 0.083204 & 1.2115 & 0.113532 \tabularnewline
41 & -0.030732 & -0.4475 & 0.327498 \tabularnewline
42 & 0.029562 & 0.4304 & 0.333658 \tabularnewline
43 & 0.048316 & 0.7035 & 0.24126 \tabularnewline
44 & 0.030241 & 0.4403 & 0.330077 \tabularnewline
45 & 0.032461 & 0.4726 & 0.318478 \tabularnewline
46 & 0.122802 & 1.788 & 0.0376 \tabularnewline
47 & -0.102458 & -1.4918 & 0.068618 \tabularnewline
48 & 0.025647 & 0.3734 & 0.354605 \tabularnewline
\hline
\end{tabular}
%Source: https://freestatistics.org/blog/index.php?pk=309315&T=2

[TABLE]
[ROW][C]Partial Autocorrelation Function[/C][/ROW]
[ROW][C]Time lag k[/C][C]PACF(k)[/C][C]T-STAT[/C][C]P-value[/C][/ROW]
[ROW][C]1[/C][C]0.600347[/C][C]8.7412[/C][C]0[/C][/ROW]
[ROW][C]2[/C][C]0.112716[/C][C]1.6412[/C][C]0.051122[/C][/ROW]
[ROW][C]3[/C][C]0.012966[/C][C]0.1888[/C][C]0.425221[/C][/ROW]
[ROW][C]4[/C][C]0.082076[/C][C]1.195[/C][C]0.116702[/C][/ROW]
[ROW][C]5[/C][C]0.436868[/C][C]6.3609[/C][C]0[/C][/ROW]
[ROW][C]6[/C][C]0.10423[/C][C]1.5176[/C][C]0.065301[/C][/ROW]
[ROW][C]7[/C][C]-0.020742[/C][C]-0.302[/C][C]0.381471[/C][/ROW]
[ROW][C]8[/C][C]-0.24452[/C][C]-3.5603[/C][C]0.000229[/C][/ROW]
[ROW][C]9[/C][C]0.129553[/C][C]1.8863[/C][C]0.03031[/C][/ROW]
[ROW][C]10[/C][C]0.110177[/C][C]1.6042[/C][C]0.055079[/C][/ROW]
[ROW][C]11[/C][C]0.15475[/C][C]2.2532[/C][C]0.012635[/C][/ROW]
[ROW][C]12[/C][C]0.309794[/C][C]4.5107[/C][C]5e-06[/C][/ROW]
[ROW][C]13[/C][C]-0.311215[/C][C]-4.5314[/C][C]5e-06[/C][/ROW]
[ROW][C]14[/C][C]-0.016312[/C][C]-0.2375[/C][C]0.406249[/C][/ROW]
[ROW][C]15[/C][C]-0.135008[/C][C]-1.9657[/C][C]0.025317[/C][/ROW]
[ROW][C]16[/C][C]-0.00736[/C][C]-0.1072[/C][C]0.457379[/C][/ROW]
[ROW][C]17[/C][C]-0.040823[/C][C]-0.5944[/C][C]0.276441[/C][/ROW]
[ROW][C]18[/C][C]-0.054794[/C][C]-0.7978[/C][C]0.212934[/C][/ROW]
[ROW][C]19[/C][C]0.03501[/C][C]0.5097[/C][C]0.305379[/C][/ROW]
[ROW][C]20[/C][C]0.082791[/C][C]1.2054[/C][C]0.114687[/C][/ROW]
[ROW][C]21[/C][C]-0.052077[/C][C]-0.7583[/C][C]0.224569[/C][/ROW]
[ROW][C]22[/C][C]0.030779[/C][C]0.4481[/C][C]0.327252[/C][/ROW]
[ROW][C]23[/C][C]0.087063[/C][C]1.2677[/C][C]0.103155[/C][/ROW]
[ROW][C]24[/C][C]0.171866[/C][C]2.5024[/C][C]0.006545[/C][/ROW]
[ROW][C]25[/C][C]-0.136174[/C][C]-1.9827[/C][C]0.024344[/C][/ROW]
[ROW][C]26[/C][C]-0.103273[/C][C]-1.5037[/C][C]0.067077[/C][/ROW]
[ROW][C]27[/C][C]-0.017043[/C][C]-0.2481[/C][C]0.40213[/C][/ROW]
[ROW][C]28[/C][C]0.043431[/C][C]0.6324[/C][C]0.263917[/C][/ROW]
[ROW][C]29[/C][C]-0.048532[/C][C]-0.7066[/C][C]0.240284[/C][/ROW]
[ROW][C]30[/C][C]-0.085318[/C][C]-1.2423[/C][C]0.107757[/C][/ROW]
[ROW][C]31[/C][C]0.080667[/C][C]1.1745[/C][C]0.120751[/C][/ROW]
[ROW][C]32[/C][C]-0.028584[/C][C]-0.4162[/C][C]0.338849[/C][/ROW]
[ROW][C]33[/C][C]0.049839[/C][C]0.7257[/C][C]0.234422[/C][/ROW]
[ROW][C]34[/C][C]0.105271[/C][C]1.5328[/C][C]0.063412[/C][/ROW]
[ROW][C]35[/C][C]0.006493[/C][C]0.0945[/C][C]0.462383[/C][/ROW]
[ROW][C]36[/C][C]0.091843[/C][C]1.3373[/C][C]0.091287[/C][/ROW]
[ROW][C]37[/C][C]-0.155983[/C][C]-2.2712[/C][C]0.012071[/C][/ROW]
[ROW][C]38[/C][C]-0.064677[/C][C]-0.9417[/C][C]0.173706[/C][/ROW]
[ROW][C]39[/C][C]-0.039547[/C][C]-0.5758[/C][C]0.282678[/C][/ROW]
[ROW][C]40[/C][C]0.083204[/C][C]1.2115[/C][C]0.113532[/C][/ROW]
[ROW][C]41[/C][C]-0.030732[/C][C]-0.4475[/C][C]0.327498[/C][/ROW]
[ROW][C]42[/C][C]0.029562[/C][C]0.4304[/C][C]0.333658[/C][/ROW]
[ROW][C]43[/C][C]0.048316[/C][C]0.7035[/C][C]0.24126[/C][/ROW]
[ROW][C]44[/C][C]0.030241[/C][C]0.4403[/C][C]0.330077[/C][/ROW]
[ROW][C]45[/C][C]0.032461[/C][C]0.4726[/C][C]0.318478[/C][/ROW]
[ROW][C]46[/C][C]0.122802[/C][C]1.788[/C][C]0.0376[/C][/ROW]
[ROW][C]47[/C][C]-0.102458[/C][C]-1.4918[/C][C]0.068618[/C][/ROW]
[ROW][C]48[/C][C]0.025647[/C][C]0.3734[/C][C]0.354605[/C][/ROW]
[/TABLE]
Source: https://freestatistics.org/blog/index.php?pk=309315&T=2

Globally Unique Identifier (entire table): ba.freestatistics.org/blog/index.php?pk=309315&T=2

As an alternative you can also use a QR Code:  

The GUIDs for individual cells are displayed in the table below:

Partial Autocorrelation Function
Time lag kPACF(k)T-STATP-value
10.6003478.74120
20.1127161.64120.051122
30.0129660.18880.425221
40.0820761.1950.116702
50.4368686.36090
60.104231.51760.065301
7-0.020742-0.3020.381471
8-0.24452-3.56030.000229
90.1295531.88630.03031
100.1101771.60420.055079
110.154752.25320.012635
120.3097944.51075e-06
13-0.311215-4.53145e-06
14-0.016312-0.23750.406249
15-0.135008-1.96570.025317
16-0.00736-0.10720.457379
17-0.040823-0.59440.276441
18-0.054794-0.79780.212934
190.035010.50970.305379
200.0827911.20540.114687
21-0.052077-0.75830.224569
220.0307790.44810.327252
230.0870631.26770.103155
240.1718662.50240.006545
25-0.136174-1.98270.024344
26-0.103273-1.50370.067077
27-0.017043-0.24810.40213
280.0434310.63240.263917
29-0.048532-0.70660.240284
30-0.085318-1.24230.107757
310.0806671.17450.120751
32-0.028584-0.41620.338849
330.0498390.72570.234422
340.1052711.53280.063412
350.0064930.09450.462383
360.0918431.33730.091287
37-0.155983-2.27120.012071
38-0.064677-0.94170.173706
39-0.039547-0.57580.282678
400.0832041.21150.113532
41-0.030732-0.44750.327498
420.0295620.43040.333658
430.0483160.70350.24126
440.0302410.44030.330077
450.0324610.47260.318478
460.1228021.7880.0376
47-0.102458-1.49180.068618
480.0256470.37340.354605


Parameters (Session):
Parameters (R input):
par1 = 48 ; par2 = 1 ; par3 = 0 ; par4 = 0 ; par5 = 12 ; par6 = White Noise ; par7 = 0.95 ; par8 = ;
R code (references can be found in the software module):
par8 <- ''
par7 <- '0.95'
par6 <- 'White Noise'
par5 <- '12'
par4 <- '0'
par3 <- '0'
par2 <- '1'
par1 <- '48'
if (par1 == 'Default') {
par1 = 10*log10(length(x))
} else {
par1 <- as.numeric(par1)
}
par2 <- as.numeric(par2)
par3 <- as.numeric(par3)
par4 <- as.numeric(par4)
par5 <- as.numeric(par5)
if (par6 == 'White Noise') par6 <- 'white' else par6 <- 'ma'
par7 <- as.numeric(par7)
if (par8 != '') par8 <- as.numeric(par8)
x <- na.omit(x)
ox <- x
if (par8 == '') {
if (par2 == 0) {
x <- log(x)
} else {
x <- (x ^ par2 - 1) / par2
}
} else {
x <- log(x,base=par8)
}
if (par3 > 0) x <- diff(x,lag=1,difference=par3)
if (par4 > 0) x <- diff(x,lag=par5,difference=par4)
bitmap(file='picts.png')
op <- par(mfrow=c(2,1))
plot(ox,type='l',main='Original Time Series',xlab='time',ylab='value')
if (par8=='') {
mytitle <- paste('Working Time Series (lambda=',par2,', d=',par3,', D=',par4,')',sep='')
mysub <- paste('(lambda=',par2,', d=',par3,', D=',par4,', CI=', par7, ', CI type=',par6,')',sep='')
} else {
mytitle <- paste('Working Time Series (base=',par8,', d=',par3,', D=',par4,')',sep='')
mysub <- paste('(base=',par8,', d=',par3,', D=',par4,', CI=', par7, ', CI type=',par6,')',sep='')
}
plot(x,type='l', main=mytitle,xlab='time',ylab='value')
par(op)
dev.off()
bitmap(file='pic1.png')
racf <- acf(x, par1, main='Autocorrelation', xlab='time lag', ylab='ACF', ci.type=par6, ci=par7, sub=mysub)
dev.off()
bitmap(file='pic2.png')
rpacf <- pacf(x,par1,main='Partial Autocorrelation',xlab='lags',ylab='PACF',sub=mysub)
dev.off()
(myacf <- c(racf$acf))
(mypacf <- c(rpacf$acf))
lengthx <- length(x)
sqrtn <- sqrt(lengthx)
load(file='createtable')
a<-table.start()
a<-table.row.start(a)
a<-table.element(a,'Autocorrelation Function',4,TRUE)
a<-table.row.end(a)
a<-table.row.start(a)
a<-table.element(a,'Time lag k',header=TRUE)
a<-table.element(a,'ACF(k)',header=TRUE)
a<-table.element(a,'T-STAT',header=TRUE)
a<-table.element(a,'P-value',header=TRUE)
a<-table.row.end(a)
for (i in 2:(par1+1)) {
a<-table.row.start(a)
a<-table.element(a,i-1,header=TRUE)
a<-table.element(a,round(myacf[i],6))
mytstat <- myacf[i]*sqrtn
a<-table.element(a,round(mytstat,4))
a<-table.element(a,round(1-pt(abs(mytstat),lengthx),6))
a<-table.row.end(a)
}
a<-table.end(a)
table.save(a,file='mytable.tab')
a<-table.start()
a<-table.row.start(a)
a<-table.element(a,'Partial Autocorrelation Function',4,TRUE)
a<-table.row.end(a)
a<-table.row.start(a)
a<-table.element(a,'Time lag k',header=TRUE)
a<-table.element(a,'PACF(k)',header=TRUE)
a<-table.element(a,'T-STAT',header=TRUE)
a<-table.element(a,'P-value',header=TRUE)
a<-table.row.end(a)
for (i in 1:par1) {
a<-table.row.start(a)
a<-table.element(a,i,header=TRUE)
a<-table.element(a,round(mypacf[i],6))
mytstat <- mypacf[i]*sqrtn
a<-table.element(a,round(mytstat,4))
a<-table.element(a,round(1-pt(abs(mytstat),lengthx),6))
a<-table.row.end(a)
}
a<-table.end(a)
table.save(a,file='mytable1.tab')