Free Statistics
of Irreproducible Research!
Description of Statistical Computation | ||||||||||||||||||||||||||||||
|---|---|---|---|---|---|---|---|---|---|---|---|---|---|---|---|---|---|---|---|---|---|---|---|---|---|---|---|---|---|---|
| Author's title | ||||||||||||||||||||||||||||||
| Author | *The author of this computation has been verified* | |||||||||||||||||||||||||||||
| R Software Module | rwasp_skewness_kurtosis_plot.wasp | |||||||||||||||||||||||||||||
| Title produced by software | Skewness-Kurtosis Plot | |||||||||||||||||||||||||||||
| Date of computation | Wed, 13 Dec 2017 10:47:37 +0100 | |||||||||||||||||||||||||||||
| Cite this page as follows | Statistical Computations at FreeStatistics.org, Office for Research Development and Education, URL https://freestatistics.org/blog/index.php?v=date/2017/Dec/13/t1513158475kpwjfvrhh3ma5qe.htm/, Retrieved Wed, 15 May 2024 13:56:24 +0000 | |||||||||||||||||||||||||||||
| Statistical Computations at FreeStatistics.org, Office for Research Development and Education, URL https://freestatistics.org/blog/index.php?pk=309233, Retrieved Wed, 15 May 2024 13:56:24 +0000 | ||||||||||||||||||||||||||||||
| QR Codes: | ||||||||||||||||||||||||||||||
|
| ||||||||||||||||||||||||||||||
| Original text written by user: | ||||||||||||||||||||||||||||||
| IsPrivate? | No (this computation is public) | |||||||||||||||||||||||||||||
| User-defined keywords | ||||||||||||||||||||||||||||||
| Estimated Impact | 92 | |||||||||||||||||||||||||||||
Tree of Dependent Computations | ||||||||||||||||||||||||||||||
| Family? (F = Feedback message, R = changed R code, M = changed R Module, P = changed Parameters, D = changed Data) | ||||||||||||||||||||||||||||||
| - [Skewness-Kurtosis Plot] [] [2017-12-13 09:47:37] [37d4e299f63d60aeb1b8f01e350555e9] [Current] | ||||||||||||||||||||||||||||||
| Feedback Forum | ||||||||||||||||||||||||||||||
Post a new message | ||||||||||||||||||||||||||||||
Dataset | ||||||||||||||||||||||||||||||
| Dataseries X: | ||||||||||||||||||||||||||||||
0.408940367496196 -0.191303874503801 0.111600037010135 0.0672558440101349 -0.0138233995038002 0.4071745764962 -0.3954455495038 -0.650445356503801 -0.530994491503801 0.472403874496199 0.721974343496199 -0.634541764503801 -0.225104312989865 0.0741408234961994 0.330170878010135 1.3169878334962 0.947214714010135 0.401238678496199 -0.0417548395038005 -0.149749929503801 -0.321614569503801 -0.344741699989865 0.3234957354962 0.5072943894962 -0.5259743205038 -0.6774863385038 -0.204952799503801 0.401000338496199 -0.775070288679054 -0.392745685165118 -0.501307072697213 -0.146554392 -0.352370776503801 0.146554392 -0.0905101784953546 0.358349311142857 0.549755170834882 -0.175465967857143 0.156946347834882 -0.232379362697213 0.216673512302787 -0.303090062989865 -0.179499387989865 -0.710791041989865 -0.425900615857143 -0.131674348697213 0.453850193142857 0.768498514834882 0.441783668834882 -0.00330523385714289 0.420131324142857 0.0571837525046454 -0.0429999474953547 -0.505482061165118 0.256928389504645 0.33991683199071 0.648687271788851 -0.0372079185038003 -0.520518848009291 -0.509162037165119 -0.627659010857143 0.265476369834882 | ||||||||||||||||||||||||||||||
Tables (Output of Computation) | ||||||||||||||||||||||||||||||
| ||||||||||||||||||||||||||||||
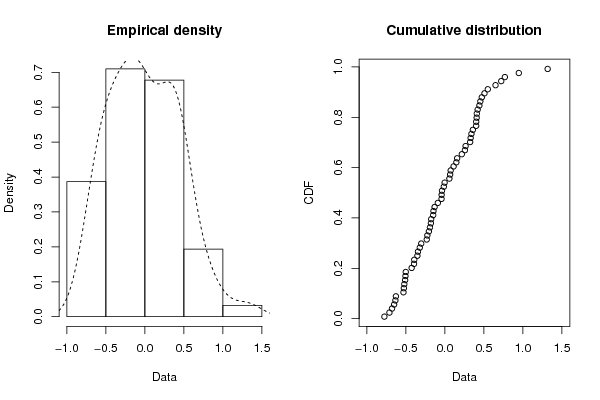
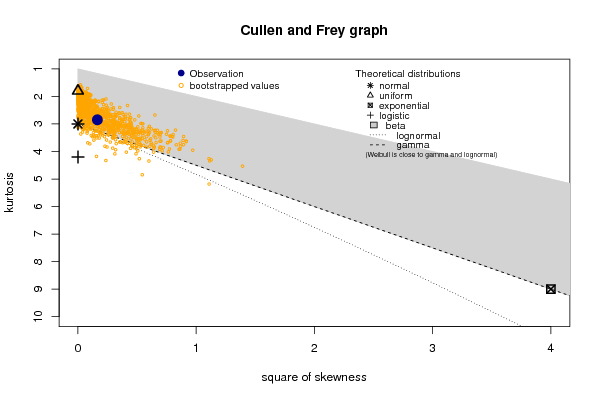
Figures (Output of Computation) | ||||||||||||||||||||||||||||||
Input Parameters & R Code | ||||||||||||||||||||||||||||||
| Parameters (Session): | ||||||||||||||||||||||||||||||
| par1 = 1 ; par2 = Do not include Seasonal Dummies ; par3 = No Linear Trend ; par4 = 0 ; par5 = 0 ; par6 = 12 ; | ||||||||||||||||||||||||||||||
| Parameters (R input): | ||||||||||||||||||||||||||||||
| R code (references can be found in the software module): | ||||||||||||||||||||||||||||||
library(fitdistrplus) | ||||||||||||||||||||||||||||||