Free Statistics
of Irreproducible Research!
Description of Statistical Computation | ||||||||||||||||||||||||||||||
|---|---|---|---|---|---|---|---|---|---|---|---|---|---|---|---|---|---|---|---|---|---|---|---|---|---|---|---|---|---|---|
| Author's title | ||||||||||||||||||||||||||||||
| Author | *The author of this computation has been verified* | |||||||||||||||||||||||||||||
| R Software Module | rwasp_skewness_kurtosis_plot.wasp | |||||||||||||||||||||||||||||
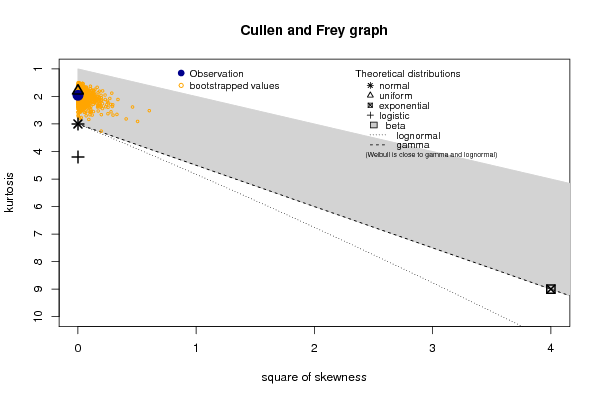
| Title produced by software | Skewness-Kurtosis Plot | |||||||||||||||||||||||||||||
| Date of computation | Wed, 13 Dec 2017 10:42:51 +0100 | |||||||||||||||||||||||||||||
| Cite this page as follows | Statistical Computations at FreeStatistics.org, Office for Research Development and Education, URL https://freestatistics.org/blog/index.php?v=date/2017/Dec/13/t1513158212z81hbj2ig3o9hvn.htm/, Retrieved Wed, 15 May 2024 15:23:28 +0000 | |||||||||||||||||||||||||||||
| Statistical Computations at FreeStatistics.org, Office for Research Development and Education, URL https://freestatistics.org/blog/index.php?pk=309230, Retrieved Wed, 15 May 2024 15:23:28 +0000 | ||||||||||||||||||||||||||||||
| QR Codes: | ||||||||||||||||||||||||||||||
|
| ||||||||||||||||||||||||||||||
| Original text written by user: | ||||||||||||||||||||||||||||||
| IsPrivate? | No (this computation is public) | |||||||||||||||||||||||||||||
| User-defined keywords | ||||||||||||||||||||||||||||||
| Estimated Impact | 92 | |||||||||||||||||||||||||||||
Tree of Dependent Computations | ||||||||||||||||||||||||||||||
| Family? (F = Feedback message, R = changed R code, M = changed R Module, P = changed Parameters, D = changed Data) | ||||||||||||||||||||||||||||||
| - [Skewness-Kurtosis Plot] [] [2017-12-13 09:42:51] [37d4e299f63d60aeb1b8f01e350555e9] [Current] | ||||||||||||||||||||||||||||||
| Feedback Forum | ||||||||||||||||||||||||||||||
Post a new message | ||||||||||||||||||||||||||||||
Dataset | ||||||||||||||||||||||||||||||
| Dataseries X: | ||||||||||||||||||||||||||||||
0.503952570904004 -0.0962916710960003 0.223588589014 0.179244396014 0.0811888039039998 0.502186779904 -0.300433346096 -0.555433153096 -0.435982288096 0.567416077903999 -0.539529561096 -0.113115760986 0.169153026904 0.442159430014 0.496250881903999 0.0532573639039997 -0.0547377260960004 -0.226602366096 -0.232753147986 0.418507938904 0.602306592904 -0.430962117096 -0.582474135096 -0.109940596096 0.496012541903999 -0.79016037632 -0.39085942421 -0.497911802978 -0.146554391999999 -0.257358573096 0.146554392000001 -0.0848513956299999 0.358349311142857 0.55164143179 -0.175465967857143 0.15883260879 -0.228984092978 0.220068782022 -0.191101510986 -0.0675108359859998 -0.598802489986 -0.425900615857143 -0.128279078978 0.453850193142857 0.77038477579 0.44366992979 -0.00330523385714294 0.420131324142857 0.0628425353700002 -0.03734116463 -0.50359580021 0.26258717237 0.32859926626 0.635106192912 0.0578042849039999 -0.53183641374 -0.50727577621 -0.627659010857143 0.26736263079 | ||||||||||||||||||||||||||||||
Tables (Output of Computation) | ||||||||||||||||||||||||||||||
| ||||||||||||||||||||||||||||||
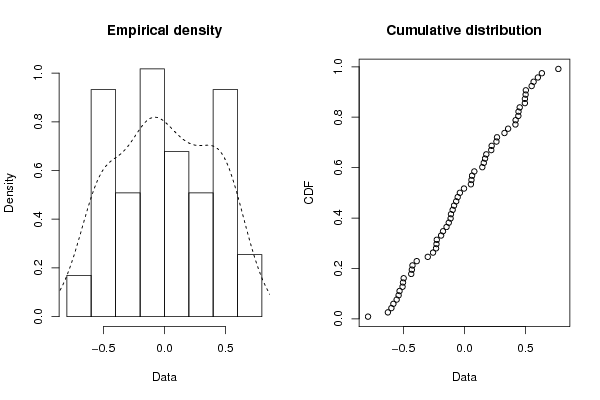
Figures (Output of Computation) | ||||||||||||||||||||||||||||||
Input Parameters & R Code | ||||||||||||||||||||||||||||||
| Parameters (Session): | ||||||||||||||||||||||||||||||
| par1 = 1 ; par2 = Do not include Seasonal Dummies ; par3 = No Linear Trend ; par4 = 0 ; par5 = 0 ; par6 = 12 ; | ||||||||||||||||||||||||||||||
| Parameters (R input): | ||||||||||||||||||||||||||||||
| R code (references can be found in the software module): | ||||||||||||||||||||||||||||||
library(fitdistrplus) | ||||||||||||||||||||||||||||||