Free Statistics

of Irreproducible Research!

Author's title

Author*The author of this computation has been verified*
R Software Modulerwasp_autocorrelation.wasp
Title produced by software(Partial) Autocorrelation Function
Date of computationTue, 12 Dec 2017 18:31:58 +0100
Cite this page as followsStatistical Computations at FreeStatistics.org, Office for Research Development and Education, URL https://freestatistics.org/blog/index.php?v=date/2017/Dec/12/t1513099946cat2197dsu8xzs1.htm/, Retrieved Wed, 15 May 2024 17:05:36 +0000
Statistical Computations at FreeStatistics.org, Office for Research Development and Education, URL https://freestatistics.org/blog/index.php?pk=309168, Retrieved Wed, 15 May 2024 17:05:36 +0000
QR Codes:

Original text written by user:
IsPrivate?No (this computation is public)
User-defined keywords
Estimated Impact38
Family? (F = Feedback message, R = changed R code, M = changed R Module, P = changed Parameters, D = changed Data)
-       [(Partial) Autocorrelation Function] [] [2017-12-12 17:31:58] [e3b8e8605812b99d9df07da90fc692a1] [Current]
Feedback Forum

Post a new message
Dataseries X:
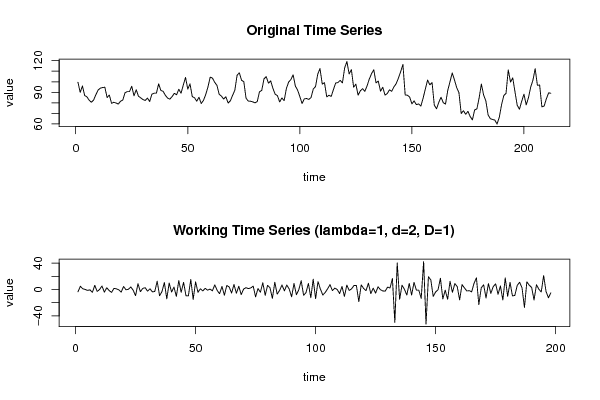
99.5
89.9
96
86.9
85.6
82.5
80.5
82.7
87.7
92.2
93.9
94.5
94.8
85
87.4
79.5
80.5
79.8
78.8
81.5
82.6
89.5
90.7
90.7
95.7
86.6
92.4
86.3
84.7
83.1
82.2
84.5
81.2
88.2
89.1
89.1
98
91.7
90.9
87.1
84.5
83.5
85.9
89
87.6
92.9
89.1
96.9
104.1
93
98
85.9
84.8
81.5
85.3
79.3
82.3
87.8
95
104.4
103.5
99.5
96.6
88.1
86.4
83.6
85.7
79.8
81.9
87.1
92
106.1
108.5
101.4
100.1
84.4
81.6
81.5
80.9
79.9
81.2
90.5
91.7
102.7
104.8
98.7
100.8
93.6
88.1
86.8
80.8
84.6
82
93.6
99.7
102.1
106.6
95.9
92.1
85.9
79.3
83.7
84.1
83.2
85
93.1
95.4
107.3
112.5
97.8
99.1
85.6
87.2
86
92.7
98.8
99.2
101.4
98.8
113.2
119.2
107.4
111.6
94.8
97.7
87.3
91.4
93.4
90.8
96.1
102.6
107.7
111.4
98.9
100.7
91
94.8
87.3
88.8
92.3
90.9
95.2
98.2
103.5
109.7
116.4
87.5
87.2
85.5
79
81.8
78.2
78.9
76.9
84.4
93.1
101.6
97.1
99.3
77.8
74.3
80.4
85.3
80.1
78.8
91.8
100
108.4
101.7
94.4
89.5
69.8
72.5
69.1
71.9
67
63.8
73.2
74.2
84.7
97.8
87.4
81.8
68.6
64.9
64.1
63.6
59.8
66.3
78.1
86.8
89
111.3
99.7
103.7
90.4
77.6
73.9
81.5
88.2
78
84.7
94.8
101.5
112.4
96.6
96.9
76.1
76.9
83.8
89.4
89.1


Summary of computational transaction
Raw Input view raw input (R code)
Raw Outputview raw output of R engine
Computing time2 seconds
R ServerBig Analytics Cloud Computing Center

\begin{tabular}{lllllllll}
\hline
Summary of computational transaction \tabularnewline
Raw Input view raw input (R code)  \tabularnewline
Raw Outputview raw output of R engine  \tabularnewline
Computing time2 seconds \tabularnewline
R ServerBig Analytics Cloud Computing Center \tabularnewline
\hline
\end{tabular}
%Source: https://freestatistics.org/blog/index.php?pk=309168&T=0

[TABLE]
[ROW]
Summary of computational transaction[/C][/ROW] [ROW]Raw Input[/C] view raw input (R code) [/C][/ROW] [ROW]Raw Output[/C]view raw output of R engine [/C][/ROW] [ROW]Computing time[/C]2 seconds[/C][/ROW] [ROW]R Server[/C]Big Analytics Cloud Computing Center[/C][/ROW] [/TABLE] Source: https://freestatistics.org/blog/index.php?pk=309168&T=0

Globally Unique Identifier (entire table): ba.freestatistics.org/blog/index.php?pk=309168&T=0

As an alternative you can also use a QR Code:  

The GUIDs for individual cells are displayed in the table below:

Summary of computational transaction
Raw Input view raw input (R code)
Raw Outputview raw output of R engine
Computing time2 seconds
R ServerBig Analytics Cloud Computing Center


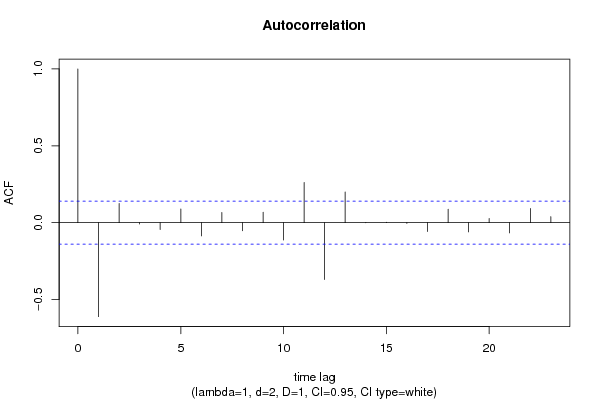
Autocorrelation Function
Time lag kACF(k)T-STATP-value
1-0.611942-8.61080
20.1240291.74520.041247
3-0.009224-0.12980.448429
4-0.045295-0.63740.262315
50.0892061.25520.105435
6-0.086184-1.21270.113343
70.0662740.93260.17609
8-0.052782-0.74270.229268
90.0678030.95410.170605
10-0.113002-1.59010.056707
110.2610333.67310.000154
12-0.370502-5.21340
130.1994442.80640.002755
14-0.001498-0.02110.491604
150.0018940.02670.489383
16-0.005212-0.07330.470803
17-0.057756-0.81270.208684
180.0865731.21820.1123
19-0.060459-0.85070.197974
200.0270550.38070.351917
21-0.066819-0.94020.174122
220.0920251.29490.098431
230.0387960.54590.292873

\begin{tabular}{lllllllll}
\hline
Autocorrelation Function \tabularnewline
Time lag k & ACF(k) & T-STAT & P-value \tabularnewline
1 & -0.611942 & -8.6108 & 0 \tabularnewline
2 & 0.124029 & 1.7452 & 0.041247 \tabularnewline
3 & -0.009224 & -0.1298 & 0.448429 \tabularnewline
4 & -0.045295 & -0.6374 & 0.262315 \tabularnewline
5 & 0.089206 & 1.2552 & 0.105435 \tabularnewline
6 & -0.086184 & -1.2127 & 0.113343 \tabularnewline
7 & 0.066274 & 0.9326 & 0.17609 \tabularnewline
8 & -0.052782 & -0.7427 & 0.229268 \tabularnewline
9 & 0.067803 & 0.9541 & 0.170605 \tabularnewline
10 & -0.113002 & -1.5901 & 0.056707 \tabularnewline
11 & 0.261033 & 3.6731 & 0.000154 \tabularnewline
12 & -0.370502 & -5.2134 & 0 \tabularnewline
13 & 0.199444 & 2.8064 & 0.002755 \tabularnewline
14 & -0.001498 & -0.0211 & 0.491604 \tabularnewline
15 & 0.001894 & 0.0267 & 0.489383 \tabularnewline
16 & -0.005212 & -0.0733 & 0.470803 \tabularnewline
17 & -0.057756 & -0.8127 & 0.208684 \tabularnewline
18 & 0.086573 & 1.2182 & 0.1123 \tabularnewline
19 & -0.060459 & -0.8507 & 0.197974 \tabularnewline
20 & 0.027055 & 0.3807 & 0.351917 \tabularnewline
21 & -0.066819 & -0.9402 & 0.174122 \tabularnewline
22 & 0.092025 & 1.2949 & 0.098431 \tabularnewline
23 & 0.038796 & 0.5459 & 0.292873 \tabularnewline
\hline
\end{tabular}
%Source: https://freestatistics.org/blog/index.php?pk=309168&T=1

[TABLE]
[ROW][C]Autocorrelation Function[/C][/ROW]
[ROW][C]Time lag k[/C][C]ACF(k)[/C][C]T-STAT[/C][C]P-value[/C][/ROW]
[ROW][C]1[/C][C]-0.611942[/C][C]-8.6108[/C][C]0[/C][/ROW]
[ROW][C]2[/C][C]0.124029[/C][C]1.7452[/C][C]0.041247[/C][/ROW]
[ROW][C]3[/C][C]-0.009224[/C][C]-0.1298[/C][C]0.448429[/C][/ROW]
[ROW][C]4[/C][C]-0.045295[/C][C]-0.6374[/C][C]0.262315[/C][/ROW]
[ROW][C]5[/C][C]0.089206[/C][C]1.2552[/C][C]0.105435[/C][/ROW]
[ROW][C]6[/C][C]-0.086184[/C][C]-1.2127[/C][C]0.113343[/C][/ROW]
[ROW][C]7[/C][C]0.066274[/C][C]0.9326[/C][C]0.17609[/C][/ROW]
[ROW][C]8[/C][C]-0.052782[/C][C]-0.7427[/C][C]0.229268[/C][/ROW]
[ROW][C]9[/C][C]0.067803[/C][C]0.9541[/C][C]0.170605[/C][/ROW]
[ROW][C]10[/C][C]-0.113002[/C][C]-1.5901[/C][C]0.056707[/C][/ROW]
[ROW][C]11[/C][C]0.261033[/C][C]3.6731[/C][C]0.000154[/C][/ROW]
[ROW][C]12[/C][C]-0.370502[/C][C]-5.2134[/C][C]0[/C][/ROW]
[ROW][C]13[/C][C]0.199444[/C][C]2.8064[/C][C]0.002755[/C][/ROW]
[ROW][C]14[/C][C]-0.001498[/C][C]-0.0211[/C][C]0.491604[/C][/ROW]
[ROW][C]15[/C][C]0.001894[/C][C]0.0267[/C][C]0.489383[/C][/ROW]
[ROW][C]16[/C][C]-0.005212[/C][C]-0.0733[/C][C]0.470803[/C][/ROW]
[ROW][C]17[/C][C]-0.057756[/C][C]-0.8127[/C][C]0.208684[/C][/ROW]
[ROW][C]18[/C][C]0.086573[/C][C]1.2182[/C][C]0.1123[/C][/ROW]
[ROW][C]19[/C][C]-0.060459[/C][C]-0.8507[/C][C]0.197974[/C][/ROW]
[ROW][C]20[/C][C]0.027055[/C][C]0.3807[/C][C]0.351917[/C][/ROW]
[ROW][C]21[/C][C]-0.066819[/C][C]-0.9402[/C][C]0.174122[/C][/ROW]
[ROW][C]22[/C][C]0.092025[/C][C]1.2949[/C][C]0.098431[/C][/ROW]
[ROW][C]23[/C][C]0.038796[/C][C]0.5459[/C][C]0.292873[/C][/ROW]
[/TABLE]
Source: https://freestatistics.org/blog/index.php?pk=309168&T=1

Globally Unique Identifier (entire table): ba.freestatistics.org/blog/index.php?pk=309168&T=1

As an alternative you can also use a QR Code:  

The GUIDs for individual cells are displayed in the table below:

Autocorrelation Function
Time lag kACF(k)T-STATP-value
1-0.611942-8.61080
20.1240291.74520.041247
3-0.009224-0.12980.448429
4-0.045295-0.63740.262315
50.0892061.25520.105435
6-0.086184-1.21270.113343
70.0662740.93260.17609
8-0.052782-0.74270.229268
90.0678030.95410.170605
10-0.113002-1.59010.056707
110.2610333.67310.000154
12-0.370502-5.21340
130.1994442.80640.002755
14-0.001498-0.02110.491604
150.0018940.02670.489383
16-0.005212-0.07330.470803
17-0.057756-0.81270.208684
180.0865731.21820.1123
19-0.060459-0.85070.197974
200.0270550.38070.351917
21-0.066819-0.94020.174122
220.0920251.29490.098431
230.0387960.54590.292873


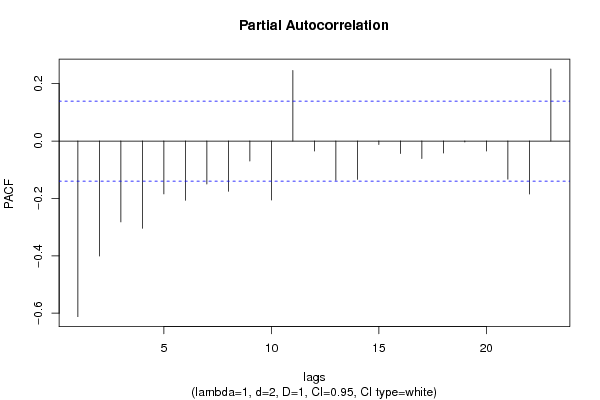
Partial Autocorrelation Function
Time lag kPACF(k)T-STATP-value
1-0.611942-8.61080
2-0.400374-5.63380
3-0.281661-3.96335.2e-05
4-0.303991-4.27751.5e-05
5-0.184197-2.59190.005128
6-0.206136-2.90060.002073
7-0.149457-2.1030.018362
8-0.174751-2.4590.007396
9-0.0697-0.98080.163952
10-0.20573-2.89490.002109
110.2459433.46070.00033
12-0.034671-0.48790.313091
13-0.136366-1.91880.028221
14-0.133629-1.88030.030765
15-0.012169-0.17120.432108
16-0.043234-0.60840.271824
17-0.060834-0.8560.196515
18-0.041431-0.5830.280282
19-0.003151-0.04430.482339
20-0.034472-0.48510.314086
21-0.132686-1.86710.031686
22-0.184787-2.60020.00501
230.2512763.53580.000253

\begin{tabular}{lllllllll}
\hline
Partial Autocorrelation Function \tabularnewline
Time lag k & PACF(k) & T-STAT & P-value \tabularnewline
1 & -0.611942 & -8.6108 & 0 \tabularnewline
2 & -0.400374 & -5.6338 & 0 \tabularnewline
3 & -0.281661 & -3.9633 & 5.2e-05 \tabularnewline
4 & -0.303991 & -4.2775 & 1.5e-05 \tabularnewline
5 & -0.184197 & -2.5919 & 0.005128 \tabularnewline
6 & -0.206136 & -2.9006 & 0.002073 \tabularnewline
7 & -0.149457 & -2.103 & 0.018362 \tabularnewline
8 & -0.174751 & -2.459 & 0.007396 \tabularnewline
9 & -0.0697 & -0.9808 & 0.163952 \tabularnewline
10 & -0.20573 & -2.8949 & 0.002109 \tabularnewline
11 & 0.245943 & 3.4607 & 0.00033 \tabularnewline
12 & -0.034671 & -0.4879 & 0.313091 \tabularnewline
13 & -0.136366 & -1.9188 & 0.028221 \tabularnewline
14 & -0.133629 & -1.8803 & 0.030765 \tabularnewline
15 & -0.012169 & -0.1712 & 0.432108 \tabularnewline
16 & -0.043234 & -0.6084 & 0.271824 \tabularnewline
17 & -0.060834 & -0.856 & 0.196515 \tabularnewline
18 & -0.041431 & -0.583 & 0.280282 \tabularnewline
19 & -0.003151 & -0.0443 & 0.482339 \tabularnewline
20 & -0.034472 & -0.4851 & 0.314086 \tabularnewline
21 & -0.132686 & -1.8671 & 0.031686 \tabularnewline
22 & -0.184787 & -2.6002 & 0.00501 \tabularnewline
23 & 0.251276 & 3.5358 & 0.000253 \tabularnewline
\hline
\end{tabular}
%Source: https://freestatistics.org/blog/index.php?pk=309168&T=2

[TABLE]
[ROW][C]Partial Autocorrelation Function[/C][/ROW]
[ROW][C]Time lag k[/C][C]PACF(k)[/C][C]T-STAT[/C][C]P-value[/C][/ROW]
[ROW][C]1[/C][C]-0.611942[/C][C]-8.6108[/C][C]0[/C][/ROW]
[ROW][C]2[/C][C]-0.400374[/C][C]-5.6338[/C][C]0[/C][/ROW]
[ROW][C]3[/C][C]-0.281661[/C][C]-3.9633[/C][C]5.2e-05[/C][/ROW]
[ROW][C]4[/C][C]-0.303991[/C][C]-4.2775[/C][C]1.5e-05[/C][/ROW]
[ROW][C]5[/C][C]-0.184197[/C][C]-2.5919[/C][C]0.005128[/C][/ROW]
[ROW][C]6[/C][C]-0.206136[/C][C]-2.9006[/C][C]0.002073[/C][/ROW]
[ROW][C]7[/C][C]-0.149457[/C][C]-2.103[/C][C]0.018362[/C][/ROW]
[ROW][C]8[/C][C]-0.174751[/C][C]-2.459[/C][C]0.007396[/C][/ROW]
[ROW][C]9[/C][C]-0.0697[/C][C]-0.9808[/C][C]0.163952[/C][/ROW]
[ROW][C]10[/C][C]-0.20573[/C][C]-2.8949[/C][C]0.002109[/C][/ROW]
[ROW][C]11[/C][C]0.245943[/C][C]3.4607[/C][C]0.00033[/C][/ROW]
[ROW][C]12[/C][C]-0.034671[/C][C]-0.4879[/C][C]0.313091[/C][/ROW]
[ROW][C]13[/C][C]-0.136366[/C][C]-1.9188[/C][C]0.028221[/C][/ROW]
[ROW][C]14[/C][C]-0.133629[/C][C]-1.8803[/C][C]0.030765[/C][/ROW]
[ROW][C]15[/C][C]-0.012169[/C][C]-0.1712[/C][C]0.432108[/C][/ROW]
[ROW][C]16[/C][C]-0.043234[/C][C]-0.6084[/C][C]0.271824[/C][/ROW]
[ROW][C]17[/C][C]-0.060834[/C][C]-0.856[/C][C]0.196515[/C][/ROW]
[ROW][C]18[/C][C]-0.041431[/C][C]-0.583[/C][C]0.280282[/C][/ROW]
[ROW][C]19[/C][C]-0.003151[/C][C]-0.0443[/C][C]0.482339[/C][/ROW]
[ROW][C]20[/C][C]-0.034472[/C][C]-0.4851[/C][C]0.314086[/C][/ROW]
[ROW][C]21[/C][C]-0.132686[/C][C]-1.8671[/C][C]0.031686[/C][/ROW]
[ROW][C]22[/C][C]-0.184787[/C][C]-2.6002[/C][C]0.00501[/C][/ROW]
[ROW][C]23[/C][C]0.251276[/C][C]3.5358[/C][C]0.000253[/C][/ROW]
[/TABLE]
Source: https://freestatistics.org/blog/index.php?pk=309168&T=2

Globally Unique Identifier (entire table): ba.freestatistics.org/blog/index.php?pk=309168&T=2

As an alternative you can also use a QR Code:  

The GUIDs for individual cells are displayed in the table below:

Partial Autocorrelation Function
Time lag kPACF(k)T-STATP-value
1-0.611942-8.61080
2-0.400374-5.63380
3-0.281661-3.96335.2e-05
4-0.303991-4.27751.5e-05
5-0.184197-2.59190.005128
6-0.206136-2.90060.002073
7-0.149457-2.1030.018362
8-0.174751-2.4590.007396
9-0.0697-0.98080.163952
10-0.20573-2.89490.002109
110.2459433.46070.00033
12-0.034671-0.48790.313091
13-0.136366-1.91880.028221
14-0.133629-1.88030.030765
15-0.012169-0.17120.432108
16-0.043234-0.60840.271824
17-0.060834-0.8560.196515
18-0.041431-0.5830.280282
19-0.003151-0.04430.482339
20-0.034472-0.48510.314086
21-0.132686-1.86710.031686
22-0.184787-2.60020.00501
230.2512763.53580.000253


Parameters (Session):
par1 = Default ; par2 = 1 ; par3 = 2 ; par4 = 1 ; par5 = 12 ; par6 = White Noise ; par7 = 0.95 ;
Parameters (R input):
par1 = Default ; par2 = 1 ; par3 = 2 ; par4 = 1 ; par5 = 12 ; par6 = White Noise ; par7 = 0.95 ; par8 = ;
R code (references can be found in the software module):
par8 <- ''
par7 <- '0.95'
par6 <- 'White Noise'
par5 <- '12'
par4 <- '1'
par3 <- '1'
par2 <- '1'
par1 <- 'Default'
if (par1 == 'Default') {
par1 = 10*log10(length(x))
} else {
par1 <- as.numeric(par1)
}
par2 <- as.numeric(par2)
par3 <- as.numeric(par3)
par4 <- as.numeric(par4)
par5 <- as.numeric(par5)
if (par6 == 'White Noise') par6 <- 'white' else par6 <- 'ma'
par7 <- as.numeric(par7)
if (par8 != '') par8 <- as.numeric(par8)
x <- na.omit(x)
ox <- x
if (par8 == '') {
if (par2 == 0) {
x <- log(x)
} else {
x <- (x ^ par2 - 1) / par2
}
} else {
x <- log(x,base=par8)
}
if (par3 > 0) x <- diff(x,lag=1,difference=par3)
if (par4 > 0) x <- diff(x,lag=par5,difference=par4)
bitmap(file='picts.png')
op <- par(mfrow=c(2,1))
plot(ox,type='l',main='Original Time Series',xlab='time',ylab='value')
if (par8=='') {
mytitle <- paste('Working Time Series (lambda=',par2,', d=',par3,', D=',par4,')',sep='')
mysub <- paste('(lambda=',par2,', d=',par3,', D=',par4,', CI=', par7, ', CI type=',par6,')',sep='')
} else {
mytitle <- paste('Working Time Series (base=',par8,', d=',par3,', D=',par4,')',sep='')
mysub <- paste('(base=',par8,', d=',par3,', D=',par4,', CI=', par7, ', CI type=',par6,')',sep='')
}
plot(x,type='l', main=mytitle,xlab='time',ylab='value')
par(op)
dev.off()
bitmap(file='pic1.png')
racf <- acf(x, par1, main='Autocorrelation', xlab='time lag', ylab='ACF', ci.type=par6, ci=par7, sub=mysub)
dev.off()
bitmap(file='pic2.png')
rpacf <- pacf(x,par1,main='Partial Autocorrelation',xlab='lags',ylab='PACF',sub=mysub)
dev.off()
(myacf <- c(racf$acf))
(mypacf <- c(rpacf$acf))
lengthx <- length(x)
sqrtn <- sqrt(lengthx)
load(file='createtable')
a<-table.start()
a<-table.row.start(a)
a<-table.element(a,'Autocorrelation Function',4,TRUE)
a<-table.row.end(a)
a<-table.row.start(a)
a<-table.element(a,'Time lag k',header=TRUE)
a<-table.element(a,'ACF(k)',header=TRUE)
a<-table.element(a,'T-STAT',header=TRUE)
a<-table.element(a,'P-value',header=TRUE)
a<-table.row.end(a)
for (i in 2:(par1+1)) {
a<-table.row.start(a)
a<-table.element(a,i-1,header=TRUE)
a<-table.element(a,round(myacf[i],6))
mytstat <- myacf[i]*sqrtn
a<-table.element(a,round(mytstat,4))
a<-table.element(a,round(1-pt(abs(mytstat),lengthx),6))
a<-table.row.end(a)
}
a<-table.end(a)
table.save(a,file='mytable.tab')
a<-table.start()
a<-table.row.start(a)
a<-table.element(a,'Partial Autocorrelation Function',4,TRUE)
a<-table.row.end(a)
a<-table.row.start(a)
a<-table.element(a,'Time lag k',header=TRUE)
a<-table.element(a,'PACF(k)',header=TRUE)
a<-table.element(a,'T-STAT',header=TRUE)
a<-table.element(a,'P-value',header=TRUE)
a<-table.row.end(a)
for (i in 1:par1) {
a<-table.row.start(a)
a<-table.element(a,i,header=TRUE)
a<-table.element(a,round(mypacf[i],6))
mytstat <- mypacf[i]*sqrtn
a<-table.element(a,round(mytstat,4))
a<-table.element(a,round(1-pt(abs(mytstat),lengthx),6))
a<-table.row.end(a)
}
a<-table.end(a)
table.save(a,file='mytable1.tab')