Free Statistics

of Irreproducible Research!

Author's title

Author*The author of this computation has been verified*
R Software Modulerwasp_autocorrelation.wasp
Title produced by software(Partial) Autocorrelation Function
Date of computationTue, 12 Dec 2017 16:30:32 +0100
Cite this page as followsStatistical Computations at FreeStatistics.org, Office for Research Development and Education, URL https://freestatistics.org/blog/index.php?v=date/2017/Dec/12/t15130927145g659n77adyhk50.htm/, Retrieved Wed, 15 May 2024 11:58:35 +0000
Statistical Computations at FreeStatistics.org, Office for Research Development and Education, URL https://freestatistics.org/blog/index.php?pk=309137, Retrieved Wed, 15 May 2024 11:58:35 +0000
QR Codes:

Original text written by user:
IsPrivate?No (this computation is public)
User-defined keywords
Estimated Impact92
Family? (F = Feedback message, R = changed R code, M = changed R Module, P = changed Parameters, D = changed Data)
-       [(Partial) Autocorrelation Function] [] [2017-12-12 15:30:32] [867b6df3e80c046baffd373216517d1f] [Current]
Feedback Forum

Post a new message
Dataseries X:
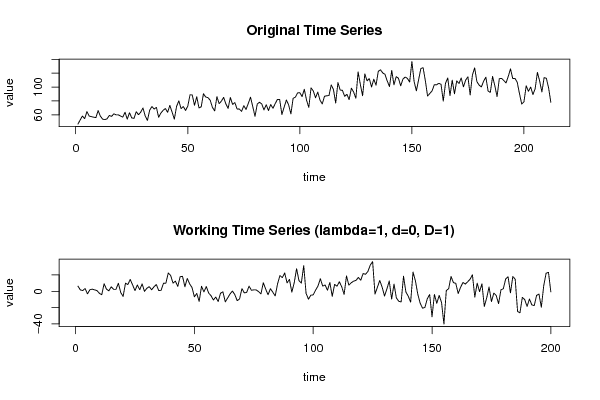
46.8
52.8
58.3
54.5
64.7
58.3
57.5
56.7
56
66.2
58.2
53.9
53.1
54.4
59.2
57.8
61.5
60.1
60.1
58.4
56.8
63.8
53.9
63.1
55.7
54.9
64.6
60.2
63.9
69.9
58.5
52
66.7
72
68.4
70.8
56.5
62.6
66.5
69.2
63.7
73.6
64.1
53.8
72.2
80.2
69.1
72
66.3
72.5
88.9
88.6
73.7
86
70
71.6
90.5
85.7
84.8
81.1
70.8
65.7
86.2
76.1
79.8
85.2
75.8
69.4
85
75
77.7
68.5
68.4
65
73.2
67.9
76.5
85.5
71.7
57.9
75.5
78.2
75.7
67.1
74.6
66.2
74.9
69.5
76.1
82.3
82.1
60.5
71.2
81.4
74.5
61.4
83.8
85.4
91.6
91.9
86.3
96.8
81
70.8
98.8
94.5
84.5
92.8
81.2
75.7
86.7
87.5
87.8
103.1
96.4
77.1
106.5
95.7
95.3
86.6
89.6
81.9
98.4
92.9
83.9
121.8
103.9
87.5
118.9
109
112.2
100.1
111.3
102.7
122.6
124.8
120.3
118.3
108.7
100.7
124
103.1
115
112.7
101.7
111.5
114.4
112.5
107.2
136.7
107.8
94.6
110.7
126.6
127.9
109.2
87.1
90.8
94.5
103.3
103.2
105.4
103.9
79.8
105.6
113
87.7
110
90.3
108.9
105.1
113
100.4
110.1
114.7
88.6
117.2
127.7
107.8
102.8
100.2
108.4
114.2
94.4
92.2
115.3
102
86.3
112
112.5
109.5
105.9
115.3
126.2
112.2
112.5
106.9
90.6
75.6
78.8
101.8
93.9
100
89.2
97.7
121.1
108.8
92.9
113.6
112.6
98.8
78


Summary of computational transaction
Raw Input view raw input (R code)
Raw Outputview raw output of R engine
Computing time1 seconds
R ServerBig Analytics Cloud Computing Center

\begin{tabular}{lllllllll}
\hline
Summary of computational transaction \tabularnewline
Raw Input view raw input (R code)  \tabularnewline
Raw Outputview raw output of R engine  \tabularnewline
Computing time1 seconds \tabularnewline
R ServerBig Analytics Cloud Computing Center \tabularnewline
\hline
\end{tabular}
%Source: https://freestatistics.org/blog/index.php?pk=309137&T=0

[TABLE]
[ROW]
Summary of computational transaction[/C][/ROW] [ROW]Raw Input[/C] view raw input (R code) [/C][/ROW] [ROW]Raw Output[/C]view raw output of R engine [/C][/ROW] [ROW]Computing time[/C]1 seconds[/C][/ROW] [ROW]R Server[/C]Big Analytics Cloud Computing Center[/C][/ROW] [/TABLE] Source: https://freestatistics.org/blog/index.php?pk=309137&T=0

Globally Unique Identifier (entire table): ba.freestatistics.org/blog/index.php?pk=309137&T=0

As an alternative you can also use a QR Code:  

The GUIDs for individual cells are displayed in the table below:

Summary of computational transaction
Raw Input view raw input (R code)
Raw Outputview raw output of R engine
Computing time1 seconds
R ServerBig Analytics Cloud Computing Center


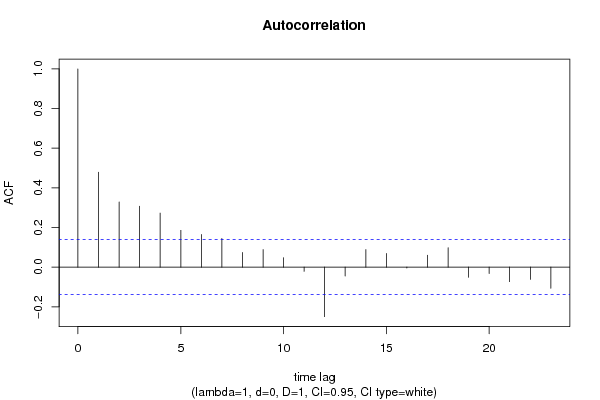
Autocorrelation Function
Time lag kACF(k)T-STATP-value
10.4785436.76760
20.3287784.64963e-06
30.3074694.34831.1e-05
40.2727083.85677.7e-05
50.1854032.6220.004707
60.1647352.32970.01041
70.1443132.04090.021287
80.073661.04170.149401
90.0883781.24990.106407
100.0475030.67180.251244
11-0.021241-0.30040.382095
12-0.249819-3.5330.000255
13-0.044577-0.63040.26457
140.0882941.24870.106625
150.068580.96990.166641
16-0.003993-0.05650.477513
170.0603470.85340.197219
180.0975051.37890.084728
19-0.051353-0.72620.234271
20-0.032376-0.45790.323775
21-0.073069-1.03340.151343
22-0.061894-0.87530.191225
23-0.106591-1.50740.066639

\begin{tabular}{lllllllll}
\hline
Autocorrelation Function \tabularnewline
Time lag k & ACF(k) & T-STAT & P-value \tabularnewline
1 & 0.478543 & 6.7676 & 0 \tabularnewline
2 & 0.328778 & 4.6496 & 3e-06 \tabularnewline
3 & 0.307469 & 4.3483 & 1.1e-05 \tabularnewline
4 & 0.272708 & 3.8567 & 7.7e-05 \tabularnewline
5 & 0.185403 & 2.622 & 0.004707 \tabularnewline
6 & 0.164735 & 2.3297 & 0.01041 \tabularnewline
7 & 0.144313 & 2.0409 & 0.021287 \tabularnewline
8 & 0.07366 & 1.0417 & 0.149401 \tabularnewline
9 & 0.088378 & 1.2499 & 0.106407 \tabularnewline
10 & 0.047503 & 0.6718 & 0.251244 \tabularnewline
11 & -0.021241 & -0.3004 & 0.382095 \tabularnewline
12 & -0.249819 & -3.533 & 0.000255 \tabularnewline
13 & -0.044577 & -0.6304 & 0.26457 \tabularnewline
14 & 0.088294 & 1.2487 & 0.106625 \tabularnewline
15 & 0.06858 & 0.9699 & 0.166641 \tabularnewline
16 & -0.003993 & -0.0565 & 0.477513 \tabularnewline
17 & 0.060347 & 0.8534 & 0.197219 \tabularnewline
18 & 0.097505 & 1.3789 & 0.084728 \tabularnewline
19 & -0.051353 & -0.7262 & 0.234271 \tabularnewline
20 & -0.032376 & -0.4579 & 0.323775 \tabularnewline
21 & -0.073069 & -1.0334 & 0.151343 \tabularnewline
22 & -0.061894 & -0.8753 & 0.191225 \tabularnewline
23 & -0.106591 & -1.5074 & 0.066639 \tabularnewline
\hline
\end{tabular}
%Source: https://freestatistics.org/blog/index.php?pk=309137&T=1

[TABLE]
[ROW][C]Autocorrelation Function[/C][/ROW]
[ROW][C]Time lag k[/C][C]ACF(k)[/C][C]T-STAT[/C][C]P-value[/C][/ROW]
[ROW][C]1[/C][C]0.478543[/C][C]6.7676[/C][C]0[/C][/ROW]
[ROW][C]2[/C][C]0.328778[/C][C]4.6496[/C][C]3e-06[/C][/ROW]
[ROW][C]3[/C][C]0.307469[/C][C]4.3483[/C][C]1.1e-05[/C][/ROW]
[ROW][C]4[/C][C]0.272708[/C][C]3.8567[/C][C]7.7e-05[/C][/ROW]
[ROW][C]5[/C][C]0.185403[/C][C]2.622[/C][C]0.004707[/C][/ROW]
[ROW][C]6[/C][C]0.164735[/C][C]2.3297[/C][C]0.01041[/C][/ROW]
[ROW][C]7[/C][C]0.144313[/C][C]2.0409[/C][C]0.021287[/C][/ROW]
[ROW][C]8[/C][C]0.07366[/C][C]1.0417[/C][C]0.149401[/C][/ROW]
[ROW][C]9[/C][C]0.088378[/C][C]1.2499[/C][C]0.106407[/C][/ROW]
[ROW][C]10[/C][C]0.047503[/C][C]0.6718[/C][C]0.251244[/C][/ROW]
[ROW][C]11[/C][C]-0.021241[/C][C]-0.3004[/C][C]0.382095[/C][/ROW]
[ROW][C]12[/C][C]-0.249819[/C][C]-3.533[/C][C]0.000255[/C][/ROW]
[ROW][C]13[/C][C]-0.044577[/C][C]-0.6304[/C][C]0.26457[/C][/ROW]
[ROW][C]14[/C][C]0.088294[/C][C]1.2487[/C][C]0.106625[/C][/ROW]
[ROW][C]15[/C][C]0.06858[/C][C]0.9699[/C][C]0.166641[/C][/ROW]
[ROW][C]16[/C][C]-0.003993[/C][C]-0.0565[/C][C]0.477513[/C][/ROW]
[ROW][C]17[/C][C]0.060347[/C][C]0.8534[/C][C]0.197219[/C][/ROW]
[ROW][C]18[/C][C]0.097505[/C][C]1.3789[/C][C]0.084728[/C][/ROW]
[ROW][C]19[/C][C]-0.051353[/C][C]-0.7262[/C][C]0.234271[/C][/ROW]
[ROW][C]20[/C][C]-0.032376[/C][C]-0.4579[/C][C]0.323775[/C][/ROW]
[ROW][C]21[/C][C]-0.073069[/C][C]-1.0334[/C][C]0.151343[/C][/ROW]
[ROW][C]22[/C][C]-0.061894[/C][C]-0.8753[/C][C]0.191225[/C][/ROW]
[ROW][C]23[/C][C]-0.106591[/C][C]-1.5074[/C][C]0.066639[/C][/ROW]
[/TABLE]
Source: https://freestatistics.org/blog/index.php?pk=309137&T=1

Globally Unique Identifier (entire table): ba.freestatistics.org/blog/index.php?pk=309137&T=1

As an alternative you can also use a QR Code:  

The GUIDs for individual cells are displayed in the table below:

Autocorrelation Function
Time lag kACF(k)T-STATP-value
10.4785436.76760
20.3287784.64963e-06
30.3074694.34831.1e-05
40.2727083.85677.7e-05
50.1854032.6220.004707
60.1647352.32970.01041
70.1443132.04090.021287
80.073661.04170.149401
90.0883781.24990.106407
100.0475030.67180.251244
11-0.021241-0.30040.382095
12-0.249819-3.5330.000255
13-0.044577-0.63040.26457
140.0882941.24870.106625
150.068580.96990.166641
16-0.003993-0.05650.477513
170.0603470.85340.197219
180.0975051.37890.084728
19-0.051353-0.72620.234271
20-0.032376-0.45790.323775
21-0.073069-1.03340.151343
22-0.061894-0.87530.191225
23-0.106591-1.50740.066639


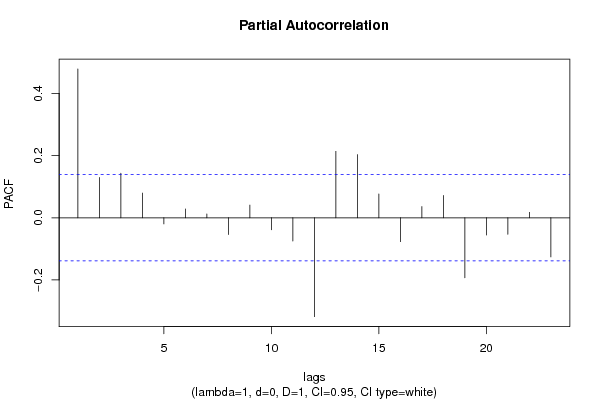
Partial Autocorrelation Function
Time lag kPACF(k)T-STATP-value
10.4785436.76760
20.129411.83010.034359
30.1432132.02530.022081
40.079251.12080.131868
5-0.019575-0.27680.391097
60.0281180.39770.345655
70.0121040.17120.432131
8-0.054064-0.76460.222711
90.0407160.57580.282695
10-0.038751-0.5480.292145
11-0.074559-1.05440.146479
12-0.317968-4.49676e-06
130.2136233.02110.001424
140.2031132.87250.002256
150.0763771.08010.14069
16-0.076785-1.08590.139415
170.0358050.50640.306581
180.0717711.0150.155668
19-0.192742-2.72580.003492
20-0.055232-0.78110.217834
21-0.053197-0.75230.226373
220.0174570.24690.402628
23-0.125821-1.77940.038348

\begin{tabular}{lllllllll}
\hline
Partial Autocorrelation Function \tabularnewline
Time lag k & PACF(k) & T-STAT & P-value \tabularnewline
1 & 0.478543 & 6.7676 & 0 \tabularnewline
2 & 0.12941 & 1.8301 & 0.034359 \tabularnewline
3 & 0.143213 & 2.0253 & 0.022081 \tabularnewline
4 & 0.07925 & 1.1208 & 0.131868 \tabularnewline
5 & -0.019575 & -0.2768 & 0.391097 \tabularnewline
6 & 0.028118 & 0.3977 & 0.345655 \tabularnewline
7 & 0.012104 & 0.1712 & 0.432131 \tabularnewline
8 & -0.054064 & -0.7646 & 0.222711 \tabularnewline
9 & 0.040716 & 0.5758 & 0.282695 \tabularnewline
10 & -0.038751 & -0.548 & 0.292145 \tabularnewline
11 & -0.074559 & -1.0544 & 0.146479 \tabularnewline
12 & -0.317968 & -4.4967 & 6e-06 \tabularnewline
13 & 0.213623 & 3.0211 & 0.001424 \tabularnewline
14 & 0.203113 & 2.8725 & 0.002256 \tabularnewline
15 & 0.076377 & 1.0801 & 0.14069 \tabularnewline
16 & -0.076785 & -1.0859 & 0.139415 \tabularnewline
17 & 0.035805 & 0.5064 & 0.306581 \tabularnewline
18 & 0.071771 & 1.015 & 0.155668 \tabularnewline
19 & -0.192742 & -2.7258 & 0.003492 \tabularnewline
20 & -0.055232 & -0.7811 & 0.217834 \tabularnewline
21 & -0.053197 & -0.7523 & 0.226373 \tabularnewline
22 & 0.017457 & 0.2469 & 0.402628 \tabularnewline
23 & -0.125821 & -1.7794 & 0.038348 \tabularnewline
\hline
\end{tabular}
%Source: https://freestatistics.org/blog/index.php?pk=309137&T=2

[TABLE]
[ROW][C]Partial Autocorrelation Function[/C][/ROW]
[ROW][C]Time lag k[/C][C]PACF(k)[/C][C]T-STAT[/C][C]P-value[/C][/ROW]
[ROW][C]1[/C][C]0.478543[/C][C]6.7676[/C][C]0[/C][/ROW]
[ROW][C]2[/C][C]0.12941[/C][C]1.8301[/C][C]0.034359[/C][/ROW]
[ROW][C]3[/C][C]0.143213[/C][C]2.0253[/C][C]0.022081[/C][/ROW]
[ROW][C]4[/C][C]0.07925[/C][C]1.1208[/C][C]0.131868[/C][/ROW]
[ROW][C]5[/C][C]-0.019575[/C][C]-0.2768[/C][C]0.391097[/C][/ROW]
[ROW][C]6[/C][C]0.028118[/C][C]0.3977[/C][C]0.345655[/C][/ROW]
[ROW][C]7[/C][C]0.012104[/C][C]0.1712[/C][C]0.432131[/C][/ROW]
[ROW][C]8[/C][C]-0.054064[/C][C]-0.7646[/C][C]0.222711[/C][/ROW]
[ROW][C]9[/C][C]0.040716[/C][C]0.5758[/C][C]0.282695[/C][/ROW]
[ROW][C]10[/C][C]-0.038751[/C][C]-0.548[/C][C]0.292145[/C][/ROW]
[ROW][C]11[/C][C]-0.074559[/C][C]-1.0544[/C][C]0.146479[/C][/ROW]
[ROW][C]12[/C][C]-0.317968[/C][C]-4.4967[/C][C]6e-06[/C][/ROW]
[ROW][C]13[/C][C]0.213623[/C][C]3.0211[/C][C]0.001424[/C][/ROW]
[ROW][C]14[/C][C]0.203113[/C][C]2.8725[/C][C]0.002256[/C][/ROW]
[ROW][C]15[/C][C]0.076377[/C][C]1.0801[/C][C]0.14069[/C][/ROW]
[ROW][C]16[/C][C]-0.076785[/C][C]-1.0859[/C][C]0.139415[/C][/ROW]
[ROW][C]17[/C][C]0.035805[/C][C]0.5064[/C][C]0.306581[/C][/ROW]
[ROW][C]18[/C][C]0.071771[/C][C]1.015[/C][C]0.155668[/C][/ROW]
[ROW][C]19[/C][C]-0.192742[/C][C]-2.7258[/C][C]0.003492[/C][/ROW]
[ROW][C]20[/C][C]-0.055232[/C][C]-0.7811[/C][C]0.217834[/C][/ROW]
[ROW][C]21[/C][C]-0.053197[/C][C]-0.7523[/C][C]0.226373[/C][/ROW]
[ROW][C]22[/C][C]0.017457[/C][C]0.2469[/C][C]0.402628[/C][/ROW]
[ROW][C]23[/C][C]-0.125821[/C][C]-1.7794[/C][C]0.038348[/C][/ROW]
[/TABLE]
Source: https://freestatistics.org/blog/index.php?pk=309137&T=2

Globally Unique Identifier (entire table): ba.freestatistics.org/blog/index.php?pk=309137&T=2

As an alternative you can also use a QR Code:  

The GUIDs for individual cells are displayed in the table below:

Partial Autocorrelation Function
Time lag kPACF(k)T-STATP-value
10.4785436.76760
20.129411.83010.034359
30.1432132.02530.022081
40.079251.12080.131868
5-0.019575-0.27680.391097
60.0281180.39770.345655
70.0121040.17120.432131
8-0.054064-0.76460.222711
90.0407160.57580.282695
10-0.038751-0.5480.292145
11-0.074559-1.05440.146479
12-0.317968-4.49676e-06
130.2136233.02110.001424
140.2031132.87250.002256
150.0763771.08010.14069
16-0.076785-1.08590.139415
170.0358050.50640.306581
180.0717711.0150.155668
19-0.192742-2.72580.003492
20-0.055232-0.78110.217834
21-0.053197-0.75230.226373
220.0174570.24690.402628
23-0.125821-1.77940.038348


Parameters (Session):
par1 = Default ; par2 = 1 ; par3 = 0 ; par4 = 1 ; par5 = 12 ; par6 = White Noise ; par7 = 0.95 ;
Parameters (R input):
par1 = Default ; par2 = 1 ; par3 = 0 ; par4 = 1 ; par5 = 12 ; par6 = White Noise ; par7 = 0.95 ; par8 = ;
R code (references can be found in the software module):
par8 <- ''
par7 <- '0.95'
par6 <- 'White Noise'
par5 <- '12'
par4 <- '0'
par3 <- '0'
par2 <- '1'
par1 <- 'Default'
if (par1 == 'Default') {
par1 = 10*log10(length(x))
} else {
par1 <- as.numeric(par1)
}
par2 <- as.numeric(par2)
par3 <- as.numeric(par3)
par4 <- as.numeric(par4)
par5 <- as.numeric(par5)
if (par6 == 'White Noise') par6 <- 'white' else par6 <- 'ma'
par7 <- as.numeric(par7)
if (par8 != '') par8 <- as.numeric(par8)
x <- na.omit(x)
ox <- x
if (par8 == '') {
if (par2 == 0) {
x <- log(x)
} else {
x <- (x ^ par2 - 1) / par2
}
} else {
x <- log(x,base=par8)
}
if (par3 > 0) x <- diff(x,lag=1,difference=par3)
if (par4 > 0) x <- diff(x,lag=par5,difference=par4)
bitmap(file='picts.png')
op <- par(mfrow=c(2,1))
plot(ox,type='l',main='Original Time Series',xlab='time',ylab='value')
if (par8=='') {
mytitle <- paste('Working Time Series (lambda=',par2,', d=',par3,', D=',par4,')',sep='')
mysub <- paste('(lambda=',par2,', d=',par3,', D=',par4,', CI=', par7, ', CI type=',par6,')',sep='')
} else {
mytitle <- paste('Working Time Series (base=',par8,', d=',par3,', D=',par4,')',sep='')
mysub <- paste('(base=',par8,', d=',par3,', D=',par4,', CI=', par7, ', CI type=',par6,')',sep='')
}
plot(x,type='l', main=mytitle,xlab='time',ylab='value')
par(op)
dev.off()
bitmap(file='pic1.png')
racf <- acf(x, par1, main='Autocorrelation', xlab='time lag', ylab='ACF', ci.type=par6, ci=par7, sub=mysub)
dev.off()
bitmap(file='pic2.png')
rpacf <- pacf(x,par1,main='Partial Autocorrelation',xlab='lags',ylab='PACF',sub=mysub)
dev.off()
(myacf <- c(racf$acf))
(mypacf <- c(rpacf$acf))
lengthx <- length(x)
sqrtn <- sqrt(lengthx)
load(file='createtable')
a<-table.start()
a<-table.row.start(a)
a<-table.element(a,'Autocorrelation Function',4,TRUE)
a<-table.row.end(a)
a<-table.row.start(a)
a<-table.element(a,'Time lag k',header=TRUE)
a<-table.element(a,'ACF(k)',header=TRUE)
a<-table.element(a,'T-STAT',header=TRUE)
a<-table.element(a,'P-value',header=TRUE)
a<-table.row.end(a)
for (i in 2:(par1+1)) {
a<-table.row.start(a)
a<-table.element(a,i-1,header=TRUE)
a<-table.element(a,round(myacf[i],6))
mytstat <- myacf[i]*sqrtn
a<-table.element(a,round(mytstat,4))
a<-table.element(a,round(1-pt(abs(mytstat),lengthx),6))
a<-table.row.end(a)
}
a<-table.end(a)
table.save(a,file='mytable.tab')
a<-table.start()
a<-table.row.start(a)
a<-table.element(a,'Partial Autocorrelation Function',4,TRUE)
a<-table.row.end(a)
a<-table.row.start(a)
a<-table.element(a,'Time lag k',header=TRUE)
a<-table.element(a,'PACF(k)',header=TRUE)
a<-table.element(a,'T-STAT',header=TRUE)
a<-table.element(a,'P-value',header=TRUE)
a<-table.row.end(a)
for (i in 1:par1) {
a<-table.row.start(a)
a<-table.element(a,i,header=TRUE)
a<-table.element(a,round(mypacf[i],6))
mytstat <- mypacf[i]*sqrtn
a<-table.element(a,round(mytstat,4))
a<-table.element(a,round(1-pt(abs(mytstat),lengthx),6))
a<-table.row.end(a)
}
a<-table.end(a)
table.save(a,file='mytable1.tab')