Free Statistics

of Irreproducible Research!

Author's title

Author*The author of this computation has been verified*
R Software Modulerwasp_histogram.wasp
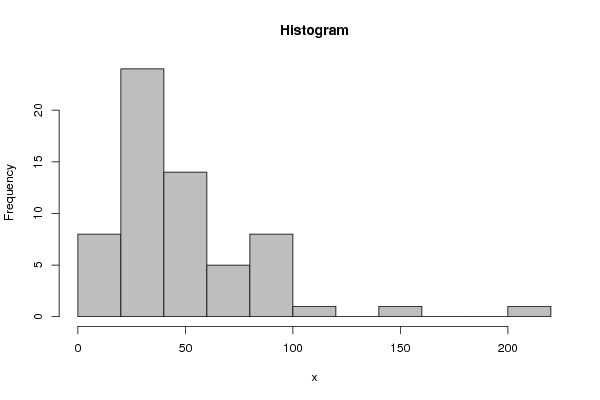
Title produced by softwareHistogram
Date of computationTue, 12 Dec 2017 15:01:09 +0100
Cite this page as followsStatistical Computations at FreeStatistics.org, Office for Research Development and Education, URL https://freestatistics.org/blog/index.php?v=date/2017/Dec/12/t1513087371bfbqaqisqnk1ddj.htm/, Retrieved Wed, 15 May 2024 11:05:26 +0000
Statistical Computations at FreeStatistics.org, Office for Research Development and Education, URL https://freestatistics.org/blog/index.php?pk=309100, Retrieved Wed, 15 May 2024 11:05:26 +0000
QR Codes:

Original text written by user:
IsPrivate?No (this computation is public)
User-defined keywords
Estimated Impact33
Family? (F = Feedback message, R = changed R code, M = changed R Module, P = changed Parameters, D = changed Data)
-       [Histogram] [] [2017-12-12 14:01:09] [37d4e299f63d60aeb1b8f01e350555e9] [Current]
Feedback Forum

Post a new message
Dataseries X:
83,20371659
45,65201629
65,01240687
62,19247014
54,5178543
83,05692579
37,22222763
28,84412386
32,50380497
88,65527404
113,7867398
29,30651614
46,426656
59,53071949
80,89475334
206,3016633
149,9336412
82,56536874
53,01616197
47,58900369
40,07437411
41,19168394
76,38966295
91,8030975
32,66738989
28,07460164
45,03314841
82,54569243
17,54637939
27,05302069
11,01196203
20,81688617
38,86059959
27,90688062
22,08388454
31,20551749
69,42864442
18,29777821
46,87529151
14,40981899
22,57770069
42,9436172
48,59296182
28,5651387
14,24413146
15,93654442
34,33261593
86,40476889
62,32284324
21,7353589
33,19425887
25,59871274
23,15841855
24,16879394
31,25835512
32,28648448
33,06085795
53,25777116
13,65646486
24,0800168
11,64161991
52,24899857


Summary of computational transaction
Raw Input view raw input (R code)
Raw Outputview raw output of R engine
Computing time1 seconds
R ServerBig Analytics Cloud Computing Center

\begin{tabular}{lllllllll}
\hline
Summary of computational transaction \tabularnewline
Raw Input view raw input (R code)  \tabularnewline
Raw Outputview raw output of R engine  \tabularnewline
Computing time1 seconds \tabularnewline
R ServerBig Analytics Cloud Computing Center \tabularnewline
\hline
\end{tabular}
%Source: https://freestatistics.org/blog/index.php?pk=309100&T=0

[TABLE]
[ROW]
Summary of computational transaction[/C][/ROW] [ROW]Raw Input[/C] view raw input (R code) [/C][/ROW] [ROW]Raw Output[/C]view raw output of R engine [/C][/ROW] [ROW]Computing time[/C]1 seconds[/C][/ROW] [ROW]R Server[/C]Big Analytics Cloud Computing Center[/C][/ROW] [/TABLE] Source: https://freestatistics.org/blog/index.php?pk=309100&T=0

Globally Unique Identifier (entire table): ba.freestatistics.org/blog/index.php?pk=309100&T=0

As an alternative you can also use a QR Code:  

The GUIDs for individual cells are displayed in the table below:

Summary of computational transaction
Raw Input view raw input (R code)
Raw Outputview raw output of R engine
Computing time1 seconds
R ServerBig Analytics Cloud Computing Center


Frequency Table (Histogram)
BinsMidpointAbs. FrequencyRel. FrequencyCumul. Rel. Freq.Density
[0,20[1080.1290320.1290320.006452
[20,40[30240.3870970.5161290.019355
[40,60[50140.2258060.7419350.01129
[60,80[7050.0806450.8225810.004032
[80,100[9080.1290320.9516130.006452
[100,120[11010.0161290.9677420.000806
[120,140[130000.9677420
[140,160[15010.0161290.9838710.000806
[160,180[170000.9838710
[180,200[190000.9838710
[200,220]21010.01612910.000806

\begin{tabular}{lllllllll}
\hline
Frequency Table (Histogram) \tabularnewline
Bins & Midpoint & Abs. Frequency & Rel. Frequency & Cumul. Rel. Freq. & Density \tabularnewline
[0,20[ & 10 & 8 & 0.129032 & 0.129032 & 0.006452 \tabularnewline
[20,40[ & 30 & 24 & 0.387097 & 0.516129 & 0.019355 \tabularnewline
[40,60[ & 50 & 14 & 0.225806 & 0.741935 & 0.01129 \tabularnewline
[60,80[ & 70 & 5 & 0.080645 & 0.822581 & 0.004032 \tabularnewline
[80,100[ & 90 & 8 & 0.129032 & 0.951613 & 0.006452 \tabularnewline
[100,120[ & 110 & 1 & 0.016129 & 0.967742 & 0.000806 \tabularnewline
[120,140[ & 130 & 0 & 0 & 0.967742 & 0 \tabularnewline
[140,160[ & 150 & 1 & 0.016129 & 0.983871 & 0.000806 \tabularnewline
[160,180[ & 170 & 0 & 0 & 0.983871 & 0 \tabularnewline
[180,200[ & 190 & 0 & 0 & 0.983871 & 0 \tabularnewline
[200,220] & 210 & 1 & 0.016129 & 1 & 0.000806 \tabularnewline
\hline
\end{tabular}
%Source: https://freestatistics.org/blog/index.php?pk=309100&T=1

[TABLE]
[ROW][C]Frequency Table (Histogram)[/C][/ROW]
[ROW][C]Bins[/C][C]Midpoint[/C][C]Abs. Frequency[/C][C]Rel. Frequency[/C][C]Cumul. Rel. Freq.[/C][C]Density[/C][/ROW]
[ROW][C][0,20[[/C][C]10[/C][C]8[/C][C]0.129032[/C][C]0.129032[/C][C]0.006452[/C][/ROW]
[ROW][C][20,40[[/C][C]30[/C][C]24[/C][C]0.387097[/C][C]0.516129[/C][C]0.019355[/C][/ROW]
[ROW][C][40,60[[/C][C]50[/C][C]14[/C][C]0.225806[/C][C]0.741935[/C][C]0.01129[/C][/ROW]
[ROW][C][60,80[[/C][C]70[/C][C]5[/C][C]0.080645[/C][C]0.822581[/C][C]0.004032[/C][/ROW]
[ROW][C][80,100[[/C][C]90[/C][C]8[/C][C]0.129032[/C][C]0.951613[/C][C]0.006452[/C][/ROW]
[ROW][C][100,120[[/C][C]110[/C][C]1[/C][C]0.016129[/C][C]0.967742[/C][C]0.000806[/C][/ROW]
[ROW][C][120,140[[/C][C]130[/C][C]0[/C][C]0[/C][C]0.967742[/C][C]0[/C][/ROW]
[ROW][C][140,160[[/C][C]150[/C][C]1[/C][C]0.016129[/C][C]0.983871[/C][C]0.000806[/C][/ROW]
[ROW][C][160,180[[/C][C]170[/C][C]0[/C][C]0[/C][C]0.983871[/C][C]0[/C][/ROW]
[ROW][C][180,200[[/C][C]190[/C][C]0[/C][C]0[/C][C]0.983871[/C][C]0[/C][/ROW]
[ROW][C][200,220][/C][C]210[/C][C]1[/C][C]0.016129[/C][C]1[/C][C]0.000806[/C][/ROW]
[/TABLE]
Source: https://freestatistics.org/blog/index.php?pk=309100&T=1

Globally Unique Identifier (entire table): ba.freestatistics.org/blog/index.php?pk=309100&T=1

As an alternative you can also use a QR Code:  

The GUIDs for individual cells are displayed in the table below:

Frequency Table (Histogram)
BinsMidpointAbs. FrequencyRel. FrequencyCumul. Rel. Freq.Density
[0,20[1080.1290320.1290320.006452
[20,40[30240.3870970.5161290.019355
[40,60[50140.2258060.7419350.01129
[60,80[7050.0806450.8225810.004032
[80,100[9080.1290320.9516130.006452
[100,120[11010.0161290.9677420.000806
[120,140[130000.9677420
[140,160[15010.0161290.9838710.000806
[160,180[170000.9838710
[180,200[190000.9838710
[200,220]21010.01612910.000806


Parameters (Session):
par2 = grey ; par3 = FALSE ; par4 = Unknown ;
Parameters (R input):
par1 = ; par2 = grey ; par3 = FALSE ; par4 = Unknown ;
R code (references can be found in the software module):
par1 <- as.numeric(par1)
if (par3 == 'TRUE') par3 <- TRUE
if (par3 == 'FALSE') par3 <- FALSE
if (par4 == 'Unknown') par1 <- as.numeric(par1)
if (par4 == 'Interval/Ratio') par1 <- as.numeric(par1)
if (par4 == '3-point Likert') par1 <- c(1:3 - 0.5, 3.5)
if (par4 == '4-point Likert') par1 <- c(1:4 - 0.5, 4.5)
if (par4 == '5-point Likert') par1 <- c(1:5 - 0.5, 5.5)
if (par4 == '6-point Likert') par1 <- c(1:6 - 0.5, 6.5)
if (par4 == '7-point Likert') par1 <- c(1:7 - 0.5, 7.5)
if (par4 == '8-point Likert') par1 <- c(1:8 - 0.5, 8.5)
if (par4 == '9-point Likert') par1 <- c(1:9 - 0.5, 9.5)
if (par4 == '10-point Likert') par1 <- c(1:10 - 0.5, 10.5)
bitmap(file='test1.png')
if(is.numeric(x[1])) {
if (is.na(par1)) {
myhist<-hist(x,col=par2,main=main,xlab=xlab,right=par3)
} else {
if (par1 < 0) par1 <- 3
if (par1 > 50) par1 <- 50
myhist<-hist(x,breaks=par1,col=par2,main=main,xlab=xlab,right=par3)
}
} else {
barplot(mytab <- sort(table(x),T),col=par2,main='Frequency Plot',xlab=xlab,ylab='Absolute Frequency')
}
dev.off()
if(is.numeric(x[1])) {
myhist
n <- length(x)
load(file='createtable')
a<-table.start()
a<-table.row.start(a)
a<-table.element(a,'Frequency Table (Histogram)',6,TRUE)
a<-table.row.end(a)
a<-table.row.start(a)
a<-table.element(a,'Bins',header=TRUE)
a<-table.element(a,'Midpoint',header=TRUE)
a<-table.element(a,'Abs. Frequency',header=TRUE)
a<-table.element(a,'Rel. Frequency',header=TRUE)
a<-table.element(a,'Cumul. Rel. Freq.',header=TRUE)
a<-table.element(a,'Density',header=TRUE)
a<-table.row.end(a)
crf <- 0
if (par3 == FALSE) mybracket <- '[' else mybracket <- ']'
mynumrows <- (length(myhist$breaks)-1)
for (i in 1:mynumrows) {
a<-table.row.start(a)
if (i == 1)
dum <- paste('[',myhist$breaks[i],sep='')
else
dum <- paste(mybracket,myhist$breaks[i],sep='')
dum <- paste(dum,myhist$breaks[i+1],sep=',')
if (i==mynumrows)
dum <- paste(dum,']',sep='')
else
dum <- paste(dum,mybracket,sep='')
a<-table.element(a,dum,header=TRUE)
a<-table.element(a,myhist$mids[i])
a<-table.element(a,myhist$counts[i])
rf <- myhist$counts[i]/n
crf <- crf + rf
a<-table.element(a,round(rf,6))
a<-table.element(a,round(crf,6))
a<-table.element(a,round(myhist$density[i],6))
a<-table.row.end(a)
}
a<-table.end(a)
table.save(a,file='mytable.tab')
} else {
mytab
reltab <- mytab / sum(mytab)
n <- length(mytab)
load(file='createtable')
a<-table.start()
a<-table.row.start(a)
a<-table.element(a,'Frequency Table (Categorical Data)',3,TRUE)
a<-table.row.end(a)
a<-table.row.start(a)
a<-table.element(a,'Category',header=TRUE)
a<-table.element(a,'Abs. Frequency',header=TRUE)
a<-table.element(a,'Rel. Frequency',header=TRUE)
a<-table.row.end(a)
for (i in 1:n) {
a<-table.row.start(a)
a<-table.element(a,labels(mytab)$x[i],header=TRUE)
a<-table.element(a,mytab[i])
a<-table.element(a,round(reltab[i],4))
a<-table.row.end(a)
}
a<-table.end(a)
table.save(a,file='mytable1.tab')
}