Free Statistics

of Irreproducible Research!

Author's title

Author*The author of this computation has been verified*
R Software Modulerwasp_autocorrelation.wasp
Title produced by software(Partial) Autocorrelation Function
Date of computationTue, 12 Dec 2017 14:38:54 +0100
Cite this page as followsStatistical Computations at FreeStatistics.org, Office for Research Development and Education, URL https://freestatistics.org/blog/index.php?v=date/2017/Dec/12/t1513086000x325c7enjcw4i8p.htm/, Retrieved Wed, 15 May 2024 18:05:57 +0000
Statistical Computations at FreeStatistics.org, Office for Research Development and Education, URL https://freestatistics.org/blog/index.php?pk=309085, Retrieved Wed, 15 May 2024 18:05:57 +0000
QR Codes:

Original text written by user:Textile, etc.
IsPrivate?No (this computation is public)
User-defined keywordsDataset 3: d=1, D=1
Estimated Impact69
Family? (F = Feedback message, R = changed R code, M = changed R Module, P = changed Parameters, D = changed Data)
-       [(Partial) Autocorrelation Function] [Partial Autocorre...] [2017-12-12 13:38:54] [79eb5143bcf363cf12f20cb866038ece] [Current]
Feedback Forum

Post a new message
Dataseries X:
122.2
136.1
145.5
116.7
137.1
125.5
112.4
106.3
145.7
151.5
144.6
116.4
137.7
138.8
149.5
125
133.4
134.4
124.8
110.6
142.4
149.6
134.6
103.3
136.5
137.1
140.7
131.4
126.2
125.3
126.6
107.7
144.5
154.2
131.4
105.7
136.2
133.3
130
129.3
113.1
117.7
116.3
97.3
140.6
141.2
120.8
106.2
121.5
122.6
137.2
118.9
107.2
127.4
111.8
100
138.3
128
121.2
105.9
112.5
123.1
129
115.5
105.7
122.3
106.4
101.1
131.6
119.5
127
106.9
115.9
122.7
137.2
108.5
115.2
129.4
112.3
104.3
140
139.9
134.9
105.1


Summary of computational transaction
Raw Input view raw input (R code)
Raw Outputview raw output of R engine
Computing time1 seconds
R ServerBig Analytics Cloud Computing Center

\begin{tabular}{lllllllll}
\hline
Summary of computational transaction \tabularnewline
Raw Input view raw input (R code)  \tabularnewline
Raw Outputview raw output of R engine  \tabularnewline
Computing time1 seconds \tabularnewline
R ServerBig Analytics Cloud Computing Center \tabularnewline
\hline
\end{tabular}
%Source: https://freestatistics.org/blog/index.php?pk=309085&T=0

[TABLE]
[ROW]
Summary of computational transaction[/C][/ROW] [ROW]Raw Input[/C] view raw input (R code) [/C][/ROW] [ROW]Raw Output[/C]view raw output of R engine [/C][/ROW] [ROW]Computing time[/C]1 seconds[/C][/ROW] [ROW]R Server[/C]Big Analytics Cloud Computing Center[/C][/ROW] [/TABLE] Source: https://freestatistics.org/blog/index.php?pk=309085&T=0

Globally Unique Identifier (entire table): ba.freestatistics.org/blog/index.php?pk=309085&T=0

As an alternative you can also use a QR Code:  

The GUIDs for individual cells are displayed in the table below:

Summary of computational transaction
Raw Input view raw input (R code)
Raw Outputview raw output of R engine
Computing time1 seconds
R ServerBig Analytics Cloud Computing Center


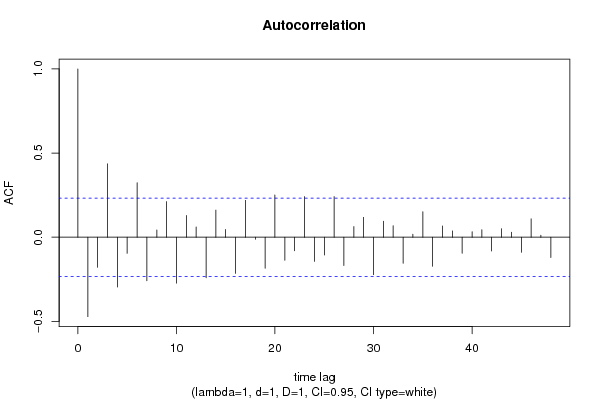
Autocorrelation Function
Time lag kACF(k)T-STATP-value
1-0.472271-3.97948.2e-05
2-0.178927-1.50770.068039
30.4357623.67180.000232
4-0.295825-2.49270.007507
5-0.096028-0.80910.210568
60.32382.72840.004008
7-0.259299-2.18490.016099
80.0429810.36220.359152
90.2112991.78040.039641
10-0.272961-2.30.012195
110.1287251.08470.140872
120.0606010.51060.305597
13-0.240737-2.02850.023132
140.1611451.35780.089408
150.0452890.38160.351946
16-0.214945-1.81120.037173
170.2191221.84640.034504
18-0.012308-0.10370.458847
19-0.184459-1.55430.062282
200.2513452.11790.018844
21-0.137005-1.15440.126098
22-0.080321-0.67680.250366
230.2410392.0310.022999
24-0.143566-1.20970.115201
25-0.106186-0.89470.186975
260.2411452.03190.022952
27-0.16868-1.42130.079801
280.0627240.52850.299392
290.1179860.99420.161758
30-0.222499-1.87480.032466
310.094590.7970.214045
320.0679680.57270.284325
33-0.154448-1.30140.098664
340.018050.15210.439773
350.1512581.27450.103317
36-0.172545-1.45390.075191
370.0669650.56430.28718
380.0374310.31540.376692
39-0.095222-0.80240.212512
400.0320680.27020.393892
410.0441270.37180.355566
42-0.08235-0.69390.245006
430.0497850.41950.338059
440.0291190.24540.403443
45-0.089251-0.7520.227257
460.1087770.91660.181235
470.0119930.10110.459896
48-0.120255-1.01330.157183

\begin{tabular}{lllllllll}
\hline
Autocorrelation Function \tabularnewline
Time lag k & ACF(k) & T-STAT & P-value \tabularnewline
1 & -0.472271 & -3.9794 & 8.2e-05 \tabularnewline
2 & -0.178927 & -1.5077 & 0.068039 \tabularnewline
3 & 0.435762 & 3.6718 & 0.000232 \tabularnewline
4 & -0.295825 & -2.4927 & 0.007507 \tabularnewline
5 & -0.096028 & -0.8091 & 0.210568 \tabularnewline
6 & 0.3238 & 2.7284 & 0.004008 \tabularnewline
7 & -0.259299 & -2.1849 & 0.016099 \tabularnewline
8 & 0.042981 & 0.3622 & 0.359152 \tabularnewline
9 & 0.211299 & 1.7804 & 0.039641 \tabularnewline
10 & -0.272961 & -2.3 & 0.012195 \tabularnewline
11 & 0.128725 & 1.0847 & 0.140872 \tabularnewline
12 & 0.060601 & 0.5106 & 0.305597 \tabularnewline
13 & -0.240737 & -2.0285 & 0.023132 \tabularnewline
14 & 0.161145 & 1.3578 & 0.089408 \tabularnewline
15 & 0.045289 & 0.3816 & 0.351946 \tabularnewline
16 & -0.214945 & -1.8112 & 0.037173 \tabularnewline
17 & 0.219122 & 1.8464 & 0.034504 \tabularnewline
18 & -0.012308 & -0.1037 & 0.458847 \tabularnewline
19 & -0.184459 & -1.5543 & 0.062282 \tabularnewline
20 & 0.251345 & 2.1179 & 0.018844 \tabularnewline
21 & -0.137005 & -1.1544 & 0.126098 \tabularnewline
22 & -0.080321 & -0.6768 & 0.250366 \tabularnewline
23 & 0.241039 & 2.031 & 0.022999 \tabularnewline
24 & -0.143566 & -1.2097 & 0.115201 \tabularnewline
25 & -0.106186 & -0.8947 & 0.186975 \tabularnewline
26 & 0.241145 & 2.0319 & 0.022952 \tabularnewline
27 & -0.16868 & -1.4213 & 0.079801 \tabularnewline
28 & 0.062724 & 0.5285 & 0.299392 \tabularnewline
29 & 0.117986 & 0.9942 & 0.161758 \tabularnewline
30 & -0.222499 & -1.8748 & 0.032466 \tabularnewline
31 & 0.09459 & 0.797 & 0.214045 \tabularnewline
32 & 0.067968 & 0.5727 & 0.284325 \tabularnewline
33 & -0.154448 & -1.3014 & 0.098664 \tabularnewline
34 & 0.01805 & 0.1521 & 0.439773 \tabularnewline
35 & 0.151258 & 1.2745 & 0.103317 \tabularnewline
36 & -0.172545 & -1.4539 & 0.075191 \tabularnewline
37 & 0.066965 & 0.5643 & 0.28718 \tabularnewline
38 & 0.037431 & 0.3154 & 0.376692 \tabularnewline
39 & -0.095222 & -0.8024 & 0.212512 \tabularnewline
40 & 0.032068 & 0.2702 & 0.393892 \tabularnewline
41 & 0.044127 & 0.3718 & 0.355566 \tabularnewline
42 & -0.08235 & -0.6939 & 0.245006 \tabularnewline
43 & 0.049785 & 0.4195 & 0.338059 \tabularnewline
44 & 0.029119 & 0.2454 & 0.403443 \tabularnewline
45 & -0.089251 & -0.752 & 0.227257 \tabularnewline
46 & 0.108777 & 0.9166 & 0.181235 \tabularnewline
47 & 0.011993 & 0.1011 & 0.459896 \tabularnewline
48 & -0.120255 & -1.0133 & 0.157183 \tabularnewline
\hline
\end{tabular}
%Source: https://freestatistics.org/blog/index.php?pk=309085&T=1

[TABLE]
[ROW][C]Autocorrelation Function[/C][/ROW]
[ROW][C]Time lag k[/C][C]ACF(k)[/C][C]T-STAT[/C][C]P-value[/C][/ROW]
[ROW][C]1[/C][C]-0.472271[/C][C]-3.9794[/C][C]8.2e-05[/C][/ROW]
[ROW][C]2[/C][C]-0.178927[/C][C]-1.5077[/C][C]0.068039[/C][/ROW]
[ROW][C]3[/C][C]0.435762[/C][C]3.6718[/C][C]0.000232[/C][/ROW]
[ROW][C]4[/C][C]-0.295825[/C][C]-2.4927[/C][C]0.007507[/C][/ROW]
[ROW][C]5[/C][C]-0.096028[/C][C]-0.8091[/C][C]0.210568[/C][/ROW]
[ROW][C]6[/C][C]0.3238[/C][C]2.7284[/C][C]0.004008[/C][/ROW]
[ROW][C]7[/C][C]-0.259299[/C][C]-2.1849[/C][C]0.016099[/C][/ROW]
[ROW][C]8[/C][C]0.042981[/C][C]0.3622[/C][C]0.359152[/C][/ROW]
[ROW][C]9[/C][C]0.211299[/C][C]1.7804[/C][C]0.039641[/C][/ROW]
[ROW][C]10[/C][C]-0.272961[/C][C]-2.3[/C][C]0.012195[/C][/ROW]
[ROW][C]11[/C][C]0.128725[/C][C]1.0847[/C][C]0.140872[/C][/ROW]
[ROW][C]12[/C][C]0.060601[/C][C]0.5106[/C][C]0.305597[/C][/ROW]
[ROW][C]13[/C][C]-0.240737[/C][C]-2.0285[/C][C]0.023132[/C][/ROW]
[ROW][C]14[/C][C]0.161145[/C][C]1.3578[/C][C]0.089408[/C][/ROW]
[ROW][C]15[/C][C]0.045289[/C][C]0.3816[/C][C]0.351946[/C][/ROW]
[ROW][C]16[/C][C]-0.214945[/C][C]-1.8112[/C][C]0.037173[/C][/ROW]
[ROW][C]17[/C][C]0.219122[/C][C]1.8464[/C][C]0.034504[/C][/ROW]
[ROW][C]18[/C][C]-0.012308[/C][C]-0.1037[/C][C]0.458847[/C][/ROW]
[ROW][C]19[/C][C]-0.184459[/C][C]-1.5543[/C][C]0.062282[/C][/ROW]
[ROW][C]20[/C][C]0.251345[/C][C]2.1179[/C][C]0.018844[/C][/ROW]
[ROW][C]21[/C][C]-0.137005[/C][C]-1.1544[/C][C]0.126098[/C][/ROW]
[ROW][C]22[/C][C]-0.080321[/C][C]-0.6768[/C][C]0.250366[/C][/ROW]
[ROW][C]23[/C][C]0.241039[/C][C]2.031[/C][C]0.022999[/C][/ROW]
[ROW][C]24[/C][C]-0.143566[/C][C]-1.2097[/C][C]0.115201[/C][/ROW]
[ROW][C]25[/C][C]-0.106186[/C][C]-0.8947[/C][C]0.186975[/C][/ROW]
[ROW][C]26[/C][C]0.241145[/C][C]2.0319[/C][C]0.022952[/C][/ROW]
[ROW][C]27[/C][C]-0.16868[/C][C]-1.4213[/C][C]0.079801[/C][/ROW]
[ROW][C]28[/C][C]0.062724[/C][C]0.5285[/C][C]0.299392[/C][/ROW]
[ROW][C]29[/C][C]0.117986[/C][C]0.9942[/C][C]0.161758[/C][/ROW]
[ROW][C]30[/C][C]-0.222499[/C][C]-1.8748[/C][C]0.032466[/C][/ROW]
[ROW][C]31[/C][C]0.09459[/C][C]0.797[/C][C]0.214045[/C][/ROW]
[ROW][C]32[/C][C]0.067968[/C][C]0.5727[/C][C]0.284325[/C][/ROW]
[ROW][C]33[/C][C]-0.154448[/C][C]-1.3014[/C][C]0.098664[/C][/ROW]
[ROW][C]34[/C][C]0.01805[/C][C]0.1521[/C][C]0.439773[/C][/ROW]
[ROW][C]35[/C][C]0.151258[/C][C]1.2745[/C][C]0.103317[/C][/ROW]
[ROW][C]36[/C][C]-0.172545[/C][C]-1.4539[/C][C]0.075191[/C][/ROW]
[ROW][C]37[/C][C]0.066965[/C][C]0.5643[/C][C]0.28718[/C][/ROW]
[ROW][C]38[/C][C]0.037431[/C][C]0.3154[/C][C]0.376692[/C][/ROW]
[ROW][C]39[/C][C]-0.095222[/C][C]-0.8024[/C][C]0.212512[/C][/ROW]
[ROW][C]40[/C][C]0.032068[/C][C]0.2702[/C][C]0.393892[/C][/ROW]
[ROW][C]41[/C][C]0.044127[/C][C]0.3718[/C][C]0.355566[/C][/ROW]
[ROW][C]42[/C][C]-0.08235[/C][C]-0.6939[/C][C]0.245006[/C][/ROW]
[ROW][C]43[/C][C]0.049785[/C][C]0.4195[/C][C]0.338059[/C][/ROW]
[ROW][C]44[/C][C]0.029119[/C][C]0.2454[/C][C]0.403443[/C][/ROW]
[ROW][C]45[/C][C]-0.089251[/C][C]-0.752[/C][C]0.227257[/C][/ROW]
[ROW][C]46[/C][C]0.108777[/C][C]0.9166[/C][C]0.181235[/C][/ROW]
[ROW][C]47[/C][C]0.011993[/C][C]0.1011[/C][C]0.459896[/C][/ROW]
[ROW][C]48[/C][C]-0.120255[/C][C]-1.0133[/C][C]0.157183[/C][/ROW]
[/TABLE]
Source: https://freestatistics.org/blog/index.php?pk=309085&T=1

Globally Unique Identifier (entire table): ba.freestatistics.org/blog/index.php?pk=309085&T=1

As an alternative you can also use a QR Code:  

The GUIDs for individual cells are displayed in the table below:

Autocorrelation Function
Time lag kACF(k)T-STATP-value
1-0.472271-3.97948.2e-05
2-0.178927-1.50770.068039
30.4357623.67180.000232
4-0.295825-2.49270.007507
5-0.096028-0.80910.210568
60.32382.72840.004008
7-0.259299-2.18490.016099
80.0429810.36220.359152
90.2112991.78040.039641
10-0.272961-2.30.012195
110.1287251.08470.140872
120.0606010.51060.305597
13-0.240737-2.02850.023132
140.1611451.35780.089408
150.0452890.38160.351946
16-0.214945-1.81120.037173
170.2191221.84640.034504
18-0.012308-0.10370.458847
19-0.184459-1.55430.062282
200.2513452.11790.018844
21-0.137005-1.15440.126098
22-0.080321-0.67680.250366
230.2410392.0310.022999
24-0.143566-1.20970.115201
25-0.106186-0.89470.186975
260.2411452.03190.022952
27-0.16868-1.42130.079801
280.0627240.52850.299392
290.1179860.99420.161758
30-0.222499-1.87480.032466
310.094590.7970.214045
320.0679680.57270.284325
33-0.154448-1.30140.098664
340.018050.15210.439773
350.1512581.27450.103317
36-0.172545-1.45390.075191
370.0669650.56430.28718
380.0374310.31540.376692
39-0.095222-0.80240.212512
400.0320680.27020.393892
410.0441270.37180.355566
42-0.08235-0.69390.245006
430.0497850.41950.338059
440.0291190.24540.403443
45-0.089251-0.7520.227257
460.1087770.91660.181235
470.0119930.10110.459896
48-0.120255-1.01330.157183


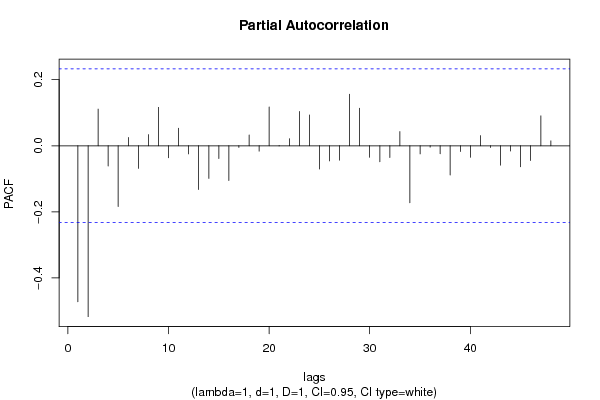
Partial Autocorrelation Function
Time lag kPACF(k)T-STATP-value
1-0.472271-3.97948.2e-05
2-0.517358-4.35932.2e-05
30.1110870.9360.176213
4-0.061324-0.51670.303477
5-0.183731-1.54810.063017
60.0253140.21330.415854
7-0.068524-0.57740.282749
80.033830.28510.388215
90.1163560.98040.165101
10-0.036283-0.30570.380353
110.0530170.44670.328215
12-0.024665-0.20780.417977
13-0.132496-1.11640.134001
14-0.098775-0.83230.204016
15-0.038348-0.32310.373773
16-0.105291-0.88720.188985
17-0.00498-0.0420.483322
180.0328040.27640.391518
19-0.016348-0.13770.445415
200.117590.99080.162566
21-0.000665-0.00560.497774
220.0215270.18140.42829
230.1037390.87410.192499
240.0930410.7840.217832
25-0.070357-0.59280.277586
26-0.045714-0.38520.350624
27-0.043525-0.36670.357448
280.1562811.31680.096062
290.1136520.95760.170745
30-0.03457-0.29130.385838
31-0.048466-0.40840.342112
32-0.035375-0.29810.383258
330.0427960.36060.359734
34-0.172518-1.45370.075223
35-0.024588-0.20720.418231
36-0.004139-0.03490.486137
37-0.024275-0.20450.419255
38-0.088735-0.74770.228557
39-0.017503-0.14750.441586
40-0.035036-0.29520.384345
410.0307430.2590.398175
42-0.005501-0.04640.481579
43-0.058728-0.49490.311116
44-0.015709-0.13240.447534
45-0.063653-0.53630.296698
46-0.044846-0.37790.353323
470.0906030.76340.223866
480.0148110.12480.450519

\begin{tabular}{lllllllll}
\hline
Partial Autocorrelation Function \tabularnewline
Time lag k & PACF(k) & T-STAT & P-value \tabularnewline
1 & -0.472271 & -3.9794 & 8.2e-05 \tabularnewline
2 & -0.517358 & -4.3593 & 2.2e-05 \tabularnewline
3 & 0.111087 & 0.936 & 0.176213 \tabularnewline
4 & -0.061324 & -0.5167 & 0.303477 \tabularnewline
5 & -0.183731 & -1.5481 & 0.063017 \tabularnewline
6 & 0.025314 & 0.2133 & 0.415854 \tabularnewline
7 & -0.068524 & -0.5774 & 0.282749 \tabularnewline
8 & 0.03383 & 0.2851 & 0.388215 \tabularnewline
9 & 0.116356 & 0.9804 & 0.165101 \tabularnewline
10 & -0.036283 & -0.3057 & 0.380353 \tabularnewline
11 & 0.053017 & 0.4467 & 0.328215 \tabularnewline
12 & -0.024665 & -0.2078 & 0.417977 \tabularnewline
13 & -0.132496 & -1.1164 & 0.134001 \tabularnewline
14 & -0.098775 & -0.8323 & 0.204016 \tabularnewline
15 & -0.038348 & -0.3231 & 0.373773 \tabularnewline
16 & -0.105291 & -0.8872 & 0.188985 \tabularnewline
17 & -0.00498 & -0.042 & 0.483322 \tabularnewline
18 & 0.032804 & 0.2764 & 0.391518 \tabularnewline
19 & -0.016348 & -0.1377 & 0.445415 \tabularnewline
20 & 0.11759 & 0.9908 & 0.162566 \tabularnewline
21 & -0.000665 & -0.0056 & 0.497774 \tabularnewline
22 & 0.021527 & 0.1814 & 0.42829 \tabularnewline
23 & 0.103739 & 0.8741 & 0.192499 \tabularnewline
24 & 0.093041 & 0.784 & 0.217832 \tabularnewline
25 & -0.070357 & -0.5928 & 0.277586 \tabularnewline
26 & -0.045714 & -0.3852 & 0.350624 \tabularnewline
27 & -0.043525 & -0.3667 & 0.357448 \tabularnewline
28 & 0.156281 & 1.3168 & 0.096062 \tabularnewline
29 & 0.113652 & 0.9576 & 0.170745 \tabularnewline
30 & -0.03457 & -0.2913 & 0.385838 \tabularnewline
31 & -0.048466 & -0.4084 & 0.342112 \tabularnewline
32 & -0.035375 & -0.2981 & 0.383258 \tabularnewline
33 & 0.042796 & 0.3606 & 0.359734 \tabularnewline
34 & -0.172518 & -1.4537 & 0.075223 \tabularnewline
35 & -0.024588 & -0.2072 & 0.418231 \tabularnewline
36 & -0.004139 & -0.0349 & 0.486137 \tabularnewline
37 & -0.024275 & -0.2045 & 0.419255 \tabularnewline
38 & -0.088735 & -0.7477 & 0.228557 \tabularnewline
39 & -0.017503 & -0.1475 & 0.441586 \tabularnewline
40 & -0.035036 & -0.2952 & 0.384345 \tabularnewline
41 & 0.030743 & 0.259 & 0.398175 \tabularnewline
42 & -0.005501 & -0.0464 & 0.481579 \tabularnewline
43 & -0.058728 & -0.4949 & 0.311116 \tabularnewline
44 & -0.015709 & -0.1324 & 0.447534 \tabularnewline
45 & -0.063653 & -0.5363 & 0.296698 \tabularnewline
46 & -0.044846 & -0.3779 & 0.353323 \tabularnewline
47 & 0.090603 & 0.7634 & 0.223866 \tabularnewline
48 & 0.014811 & 0.1248 & 0.450519 \tabularnewline
\hline
\end{tabular}
%Source: https://freestatistics.org/blog/index.php?pk=309085&T=2

[TABLE]
[ROW][C]Partial Autocorrelation Function[/C][/ROW]
[ROW][C]Time lag k[/C][C]PACF(k)[/C][C]T-STAT[/C][C]P-value[/C][/ROW]
[ROW][C]1[/C][C]-0.472271[/C][C]-3.9794[/C][C]8.2e-05[/C][/ROW]
[ROW][C]2[/C][C]-0.517358[/C][C]-4.3593[/C][C]2.2e-05[/C][/ROW]
[ROW][C]3[/C][C]0.111087[/C][C]0.936[/C][C]0.176213[/C][/ROW]
[ROW][C]4[/C][C]-0.061324[/C][C]-0.5167[/C][C]0.303477[/C][/ROW]
[ROW][C]5[/C][C]-0.183731[/C][C]-1.5481[/C][C]0.063017[/C][/ROW]
[ROW][C]6[/C][C]0.025314[/C][C]0.2133[/C][C]0.415854[/C][/ROW]
[ROW][C]7[/C][C]-0.068524[/C][C]-0.5774[/C][C]0.282749[/C][/ROW]
[ROW][C]8[/C][C]0.03383[/C][C]0.2851[/C][C]0.388215[/C][/ROW]
[ROW][C]9[/C][C]0.116356[/C][C]0.9804[/C][C]0.165101[/C][/ROW]
[ROW][C]10[/C][C]-0.036283[/C][C]-0.3057[/C][C]0.380353[/C][/ROW]
[ROW][C]11[/C][C]0.053017[/C][C]0.4467[/C][C]0.328215[/C][/ROW]
[ROW][C]12[/C][C]-0.024665[/C][C]-0.2078[/C][C]0.417977[/C][/ROW]
[ROW][C]13[/C][C]-0.132496[/C][C]-1.1164[/C][C]0.134001[/C][/ROW]
[ROW][C]14[/C][C]-0.098775[/C][C]-0.8323[/C][C]0.204016[/C][/ROW]
[ROW][C]15[/C][C]-0.038348[/C][C]-0.3231[/C][C]0.373773[/C][/ROW]
[ROW][C]16[/C][C]-0.105291[/C][C]-0.8872[/C][C]0.188985[/C][/ROW]
[ROW][C]17[/C][C]-0.00498[/C][C]-0.042[/C][C]0.483322[/C][/ROW]
[ROW][C]18[/C][C]0.032804[/C][C]0.2764[/C][C]0.391518[/C][/ROW]
[ROW][C]19[/C][C]-0.016348[/C][C]-0.1377[/C][C]0.445415[/C][/ROW]
[ROW][C]20[/C][C]0.11759[/C][C]0.9908[/C][C]0.162566[/C][/ROW]
[ROW][C]21[/C][C]-0.000665[/C][C]-0.0056[/C][C]0.497774[/C][/ROW]
[ROW][C]22[/C][C]0.021527[/C][C]0.1814[/C][C]0.42829[/C][/ROW]
[ROW][C]23[/C][C]0.103739[/C][C]0.8741[/C][C]0.192499[/C][/ROW]
[ROW][C]24[/C][C]0.093041[/C][C]0.784[/C][C]0.217832[/C][/ROW]
[ROW][C]25[/C][C]-0.070357[/C][C]-0.5928[/C][C]0.277586[/C][/ROW]
[ROW][C]26[/C][C]-0.045714[/C][C]-0.3852[/C][C]0.350624[/C][/ROW]
[ROW][C]27[/C][C]-0.043525[/C][C]-0.3667[/C][C]0.357448[/C][/ROW]
[ROW][C]28[/C][C]0.156281[/C][C]1.3168[/C][C]0.096062[/C][/ROW]
[ROW][C]29[/C][C]0.113652[/C][C]0.9576[/C][C]0.170745[/C][/ROW]
[ROW][C]30[/C][C]-0.03457[/C][C]-0.2913[/C][C]0.385838[/C][/ROW]
[ROW][C]31[/C][C]-0.048466[/C][C]-0.4084[/C][C]0.342112[/C][/ROW]
[ROW][C]32[/C][C]-0.035375[/C][C]-0.2981[/C][C]0.383258[/C][/ROW]
[ROW][C]33[/C][C]0.042796[/C][C]0.3606[/C][C]0.359734[/C][/ROW]
[ROW][C]34[/C][C]-0.172518[/C][C]-1.4537[/C][C]0.075223[/C][/ROW]
[ROW][C]35[/C][C]-0.024588[/C][C]-0.2072[/C][C]0.418231[/C][/ROW]
[ROW][C]36[/C][C]-0.004139[/C][C]-0.0349[/C][C]0.486137[/C][/ROW]
[ROW][C]37[/C][C]-0.024275[/C][C]-0.2045[/C][C]0.419255[/C][/ROW]
[ROW][C]38[/C][C]-0.088735[/C][C]-0.7477[/C][C]0.228557[/C][/ROW]
[ROW][C]39[/C][C]-0.017503[/C][C]-0.1475[/C][C]0.441586[/C][/ROW]
[ROW][C]40[/C][C]-0.035036[/C][C]-0.2952[/C][C]0.384345[/C][/ROW]
[ROW][C]41[/C][C]0.030743[/C][C]0.259[/C][C]0.398175[/C][/ROW]
[ROW][C]42[/C][C]-0.005501[/C][C]-0.0464[/C][C]0.481579[/C][/ROW]
[ROW][C]43[/C][C]-0.058728[/C][C]-0.4949[/C][C]0.311116[/C][/ROW]
[ROW][C]44[/C][C]-0.015709[/C][C]-0.1324[/C][C]0.447534[/C][/ROW]
[ROW][C]45[/C][C]-0.063653[/C][C]-0.5363[/C][C]0.296698[/C][/ROW]
[ROW][C]46[/C][C]-0.044846[/C][C]-0.3779[/C][C]0.353323[/C][/ROW]
[ROW][C]47[/C][C]0.090603[/C][C]0.7634[/C][C]0.223866[/C][/ROW]
[ROW][C]48[/C][C]0.014811[/C][C]0.1248[/C][C]0.450519[/C][/ROW]
[/TABLE]
Source: https://freestatistics.org/blog/index.php?pk=309085&T=2

Globally Unique Identifier (entire table): ba.freestatistics.org/blog/index.php?pk=309085&T=2

As an alternative you can also use a QR Code:  

The GUIDs for individual cells are displayed in the table below:

Partial Autocorrelation Function
Time lag kPACF(k)T-STATP-value
1-0.472271-3.97948.2e-05
2-0.517358-4.35932.2e-05
30.1110870.9360.176213
4-0.061324-0.51670.303477
5-0.183731-1.54810.063017
60.0253140.21330.415854
7-0.068524-0.57740.282749
80.033830.28510.388215
90.1163560.98040.165101
10-0.036283-0.30570.380353
110.0530170.44670.328215
12-0.024665-0.20780.417977
13-0.132496-1.11640.134001
14-0.098775-0.83230.204016
15-0.038348-0.32310.373773
16-0.105291-0.88720.188985
17-0.00498-0.0420.483322
180.0328040.27640.391518
19-0.016348-0.13770.445415
200.117590.99080.162566
21-0.000665-0.00560.497774
220.0215270.18140.42829
230.1037390.87410.192499
240.0930410.7840.217832
25-0.070357-0.59280.277586
26-0.045714-0.38520.350624
27-0.043525-0.36670.357448
280.1562811.31680.096062
290.1136520.95760.170745
30-0.03457-0.29130.385838
31-0.048466-0.40840.342112
32-0.035375-0.29810.383258
330.0427960.36060.359734
34-0.172518-1.45370.075223
35-0.024588-0.20720.418231
36-0.004139-0.03490.486137
37-0.024275-0.20450.419255
38-0.088735-0.74770.228557
39-0.017503-0.14750.441586
40-0.035036-0.29520.384345
410.0307430.2590.398175
42-0.005501-0.04640.481579
43-0.058728-0.49490.311116
44-0.015709-0.13240.447534
45-0.063653-0.53630.296698
46-0.044846-0.37790.353323
470.0906030.76340.223866
480.0148110.12480.450519


Parameters (Session):
par1 = 48 ; par2 = 1 ; par3 = 1 ; par4 = 1 ; par5 = 12 ; par6 = White Noise ; par7 = 0.95 ;
Parameters (R input):
par1 = 48 ; par2 = 1 ; par3 = 1 ; par4 = 1 ; par5 = 12 ; par6 = White Noise ; par7 = 0.95 ; par8 = ;
R code (references can be found in the software module):
if (par1 == 'Default') {
par1 = 10*log10(length(x))
} else {
par1 <- as.numeric(par1)
}
par2 <- as.numeric(par2)
par3 <- as.numeric(par3)
par4 <- as.numeric(par4)
par5 <- as.numeric(par5)
if (par6 == 'White Noise') par6 <- 'white' else par6 <- 'ma'
par7 <- as.numeric(par7)
if (par8 != '') par8 <- as.numeric(par8)
x <- na.omit(x)
ox <- x
if (par8 == '') {
if (par2 == 0) {
x <- log(x)
} else {
x <- (x ^ par2 - 1) / par2
}
} else {
x <- log(x,base=par8)
}
if (par3 > 0) x <- diff(x,lag=1,difference=par3)
if (par4 > 0) x <- diff(x,lag=par5,difference=par4)
bitmap(file='picts.png')
op <- par(mfrow=c(2,1))
plot(ox,type='l',main='Original Time Series',xlab='time',ylab='value')
if (par8=='') {
mytitle <- paste('Working Time Series (lambda=',par2,', d=',par3,', D=',par4,')',sep='')
mysub <- paste('(lambda=',par2,', d=',par3,', D=',par4,', CI=', par7, ', CI type=',par6,')',sep='')
} else {
mytitle <- paste('Working Time Series (base=',par8,', d=',par3,', D=',par4,')',sep='')
mysub <- paste('(base=',par8,', d=',par3,', D=',par4,', CI=', par7, ', CI type=',par6,')',sep='')
}
plot(x,type='l', main=mytitle,xlab='time',ylab='value')
par(op)
dev.off()
bitmap(file='pic1.png')
racf <- acf(x, par1, main='Autocorrelation', xlab='time lag', ylab='ACF', ci.type=par6, ci=par7, sub=mysub)
dev.off()
bitmap(file='pic2.png')
rpacf <- pacf(x,par1,main='Partial Autocorrelation',xlab='lags',ylab='PACF',sub=mysub)
dev.off()
(myacf <- c(racf$acf))
(mypacf <- c(rpacf$acf))
lengthx <- length(x)
sqrtn <- sqrt(lengthx)
load(file='createtable')
a<-table.start()
a<-table.row.start(a)
a<-table.element(a,'Autocorrelation Function',4,TRUE)
a<-table.row.end(a)
a<-table.row.start(a)
a<-table.element(a,'Time lag k',header=TRUE)
a<-table.element(a,'ACF(k)',header=TRUE)
a<-table.element(a,'T-STAT',header=TRUE)
a<-table.element(a,'P-value',header=TRUE)
a<-table.row.end(a)
for (i in 2:(par1+1)) {
a<-table.row.start(a)
a<-table.element(a,i-1,header=TRUE)
a<-table.element(a,round(myacf[i],6))
mytstat <- myacf[i]*sqrtn
a<-table.element(a,round(mytstat,4))
a<-table.element(a,round(1-pt(abs(mytstat),lengthx),6))
a<-table.row.end(a)
}
a<-table.end(a)
table.save(a,file='mytable.tab')
a<-table.start()
a<-table.row.start(a)
a<-table.element(a,'Partial Autocorrelation Function',4,TRUE)
a<-table.row.end(a)
a<-table.row.start(a)
a<-table.element(a,'Time lag k',header=TRUE)
a<-table.element(a,'PACF(k)',header=TRUE)
a<-table.element(a,'T-STAT',header=TRUE)
a<-table.element(a,'P-value',header=TRUE)
a<-table.row.end(a)
for (i in 1:par1) {
a<-table.row.start(a)
a<-table.element(a,i,header=TRUE)
a<-table.element(a,round(mypacf[i],6))
mytstat <- mypacf[i]*sqrtn
a<-table.element(a,round(mytstat,4))
a<-table.element(a,round(1-pt(abs(mytstat),lengthx),6))
a<-table.row.end(a)
}
a<-table.end(a)
table.save(a,file='mytable1.tab')