Free Statistics

of Irreproducible Research!

Author's title

Author*The author of this computation has been verified*
R Software Modulerwasp_autocorrelation.wasp
Title produced by software(Partial) Autocorrelation Function
Date of computationTue, 12 Dec 2017 14:34:59 +0100
Cite this page as followsStatistical Computations at FreeStatistics.org, Office for Research Development and Education, URL https://freestatistics.org/blog/index.php?v=date/2017/Dec/12/t1513085825zwajqnbp5pqtv9s.htm/, Retrieved Wed, 15 May 2024 02:54:28 +0000
Statistical Computations at FreeStatistics.org, Office for Research Development and Education, URL https://freestatistics.org/blog/index.php?pk=309081, Retrieved Wed, 15 May 2024 02:54:28 +0000
QR Codes:

Original text written by user:Textile, etc.
IsPrivate?No (this computation is public)
User-defined keywordsDataset 3: d=0, D=1
Estimated Impact88
Family? (F = Feedback message, R = changed R code, M = changed R Module, P = changed Parameters, D = changed Data)
-       [(Partial) Autocorrelation Function] [Partial Autocorre...] [2017-12-12 13:34:59] [79eb5143bcf363cf12f20cb866038ece] [Current]
Feedback Forum

Post a new message
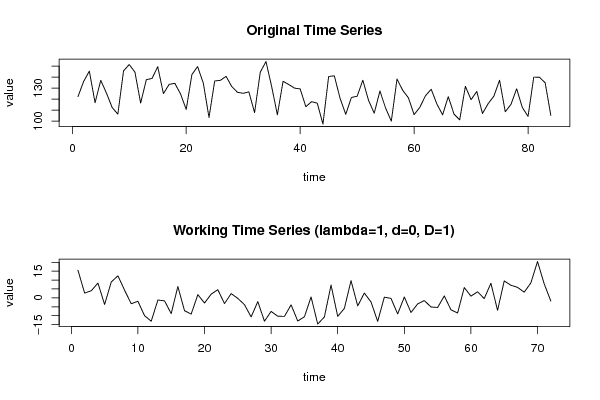
Dataseries X:
122,2
136,1
145,5
116,7
137,1
125,5
112,4
106,3
145,7
151,5
144,6
116,4
137,7
138,8
149,5
125
133,4
134,4
124,8
110,6
142,4
149,6
134,6
103,3
136,5
137,1
140,7
131,4
126,2
125,3
126,6
107,7
144,5
154,2
131,4
105,7
136,2
133,3
130
129,3
113,1
117,7
116,3
97,3
140,6
141,2
120,8
106,2
121,5
122,6
137,2
118,9
107,2
127,4
111,8
100
138,3
128
121,2
105,9
112,5
123,1
129
115,5
105,7
122,3
106,4
101,1
131,6
119,5
127
106,9
115,9
122,7
137,2
108,5
115,2
129,4
112,3
104,3
140
139,9
134,9
105,1


Summary of computational transaction
Raw Input view raw input (R code)
Raw Outputview raw output of R engine
Computing time2 seconds
R ServerBig Analytics Cloud Computing Center

\begin{tabular}{lllllllll}
\hline
Summary of computational transaction \tabularnewline
Raw Input view raw input (R code)  \tabularnewline
Raw Outputview raw output of R engine  \tabularnewline
Computing time2 seconds \tabularnewline
R ServerBig Analytics Cloud Computing Center \tabularnewline
\hline
\end{tabular}
%Source: https://freestatistics.org/blog/index.php?pk=309081&T=0

[TABLE]
[ROW]
Summary of computational transaction[/C][/ROW] [ROW]Raw Input[/C] view raw input (R code) [/C][/ROW] [ROW]Raw Output[/C]view raw output of R engine [/C][/ROW] [ROW]Computing time[/C]2 seconds[/C][/ROW] [ROW]R Server[/C]Big Analytics Cloud Computing Center[/C][/ROW] [/TABLE] Source: https://freestatistics.org/blog/index.php?pk=309081&T=0

Globally Unique Identifier (entire table): ba.freestatistics.org/blog/index.php?pk=309081&T=0

As an alternative you can also use a QR Code:  

The GUIDs for individual cells are displayed in the table below:

Summary of computational transaction
Raw Input view raw input (R code)
Raw Outputview raw output of R engine
Computing time2 seconds
R ServerBig Analytics Cloud Computing Center


Autocorrelation Function
Time lag kACF(k)T-STATP-value
10.2782292.36090.010472
20.2595442.20230.015423
30.4833544.10145.3e-05
40.0898150.76210.224244
50.1521931.29140.100348
60.2935122.49050.007531
7-0.024335-0.20650.418495
80.0480360.40760.34239
90.0909850.7720.22131
10-0.159492-1.35330.090091
11-0.002119-0.0180.492851
12-0.007033-0.05970.476288
13-0.145352-1.23330.110729
140.0495360.42030.337749
150.0512190.43460.332574
16-0.073808-0.62630.266557
170.1543231.30950.097268
180.0890020.75520.226295
19-0.005821-0.04940.480371
200.1723731.46260.073959
21-0.016089-0.13650.445897
22-0.028757-0.2440.403957
230.1024480.86930.193786
24-0.122708-1.04120.150631
25-0.138878-1.17840.121255
260.0052810.04480.48219
27-0.154616-1.3120.096851
28-0.11828-1.00360.159458
29-0.120686-1.02410.154619
30-0.309148-2.62320.005313
31-0.178544-1.5150.067076
32-0.179365-1.5220.0662
33-0.302119-2.56360.006224
34-0.171931-1.45890.074473
35-0.079257-0.67250.251702
36-0.242595-2.05850.021582
37-0.103207-0.87570.192043
38-0.074358-0.6310.265035
39-0.174051-1.47690.072035
40-0.06834-0.57990.281901
41-0.027159-0.23050.409198
42-0.113783-0.96550.168768
43-0.028333-0.24040.405346
44-0.043659-0.37050.356065
45-0.077257-0.65560.257101
460.0557630.47320.318763
47-0.01761-0.14940.440817
48-0.104771-0.8890.188479

\begin{tabular}{lllllllll}
\hline
Autocorrelation Function \tabularnewline
Time lag k & ACF(k) & T-STAT & P-value \tabularnewline
1 & 0.278229 & 2.3609 & 0.010472 \tabularnewline
2 & 0.259544 & 2.2023 & 0.015423 \tabularnewline
3 & 0.483354 & 4.1014 & 5.3e-05 \tabularnewline
4 & 0.089815 & 0.7621 & 0.224244 \tabularnewline
5 & 0.152193 & 1.2914 & 0.100348 \tabularnewline
6 & 0.293512 & 2.4905 & 0.007531 \tabularnewline
7 & -0.024335 & -0.2065 & 0.418495 \tabularnewline
8 & 0.048036 & 0.4076 & 0.34239 \tabularnewline
9 & 0.090985 & 0.772 & 0.22131 \tabularnewline
10 & -0.159492 & -1.3533 & 0.090091 \tabularnewline
11 & -0.002119 & -0.018 & 0.492851 \tabularnewline
12 & -0.007033 & -0.0597 & 0.476288 \tabularnewline
13 & -0.145352 & -1.2333 & 0.110729 \tabularnewline
14 & 0.049536 & 0.4203 & 0.337749 \tabularnewline
15 & 0.051219 & 0.4346 & 0.332574 \tabularnewline
16 & -0.073808 & -0.6263 & 0.266557 \tabularnewline
17 & 0.154323 & 1.3095 & 0.097268 \tabularnewline
18 & 0.089002 & 0.7552 & 0.226295 \tabularnewline
19 & -0.005821 & -0.0494 & 0.480371 \tabularnewline
20 & 0.172373 & 1.4626 & 0.073959 \tabularnewline
21 & -0.016089 & -0.1365 & 0.445897 \tabularnewline
22 & -0.028757 & -0.244 & 0.403957 \tabularnewline
23 & 0.102448 & 0.8693 & 0.193786 \tabularnewline
24 & -0.122708 & -1.0412 & 0.150631 \tabularnewline
25 & -0.138878 & -1.1784 & 0.121255 \tabularnewline
26 & 0.005281 & 0.0448 & 0.48219 \tabularnewline
27 & -0.154616 & -1.312 & 0.096851 \tabularnewline
28 & -0.11828 & -1.0036 & 0.159458 \tabularnewline
29 & -0.120686 & -1.0241 & 0.154619 \tabularnewline
30 & -0.309148 & -2.6232 & 0.005313 \tabularnewline
31 & -0.178544 & -1.515 & 0.067076 \tabularnewline
32 & -0.179365 & -1.522 & 0.0662 \tabularnewline
33 & -0.302119 & -2.5636 & 0.006224 \tabularnewline
34 & -0.171931 & -1.4589 & 0.074473 \tabularnewline
35 & -0.079257 & -0.6725 & 0.251702 \tabularnewline
36 & -0.242595 & -2.0585 & 0.021582 \tabularnewline
37 & -0.103207 & -0.8757 & 0.192043 \tabularnewline
38 & -0.074358 & -0.631 & 0.265035 \tabularnewline
39 & -0.174051 & -1.4769 & 0.072035 \tabularnewline
40 & -0.06834 & -0.5799 & 0.281901 \tabularnewline
41 & -0.027159 & -0.2305 & 0.409198 \tabularnewline
42 & -0.113783 & -0.9655 & 0.168768 \tabularnewline
43 & -0.028333 & -0.2404 & 0.405346 \tabularnewline
44 & -0.043659 & -0.3705 & 0.356065 \tabularnewline
45 & -0.077257 & -0.6556 & 0.257101 \tabularnewline
46 & 0.055763 & 0.4732 & 0.318763 \tabularnewline
47 & -0.01761 & -0.1494 & 0.440817 \tabularnewline
48 & -0.104771 & -0.889 & 0.188479 \tabularnewline
\hline
\end{tabular}
%Source: https://freestatistics.org/blog/index.php?pk=309081&T=1

[TABLE]
[ROW][C]Autocorrelation Function[/C][/ROW]
[ROW][C]Time lag k[/C][C]ACF(k)[/C][C]T-STAT[/C][C]P-value[/C][/ROW]
[ROW][C]1[/C][C]0.278229[/C][C]2.3609[/C][C]0.010472[/C][/ROW]
[ROW][C]2[/C][C]0.259544[/C][C]2.2023[/C][C]0.015423[/C][/ROW]
[ROW][C]3[/C][C]0.483354[/C][C]4.1014[/C][C]5.3e-05[/C][/ROW]
[ROW][C]4[/C][C]0.089815[/C][C]0.7621[/C][C]0.224244[/C][/ROW]
[ROW][C]5[/C][C]0.152193[/C][C]1.2914[/C][C]0.100348[/C][/ROW]
[ROW][C]6[/C][C]0.293512[/C][C]2.4905[/C][C]0.007531[/C][/ROW]
[ROW][C]7[/C][C]-0.024335[/C][C]-0.2065[/C][C]0.418495[/C][/ROW]
[ROW][C]8[/C][C]0.048036[/C][C]0.4076[/C][C]0.34239[/C][/ROW]
[ROW][C]9[/C][C]0.090985[/C][C]0.772[/C][C]0.22131[/C][/ROW]
[ROW][C]10[/C][C]-0.159492[/C][C]-1.3533[/C][C]0.090091[/C][/ROW]
[ROW][C]11[/C][C]-0.002119[/C][C]-0.018[/C][C]0.492851[/C][/ROW]
[ROW][C]12[/C][C]-0.007033[/C][C]-0.0597[/C][C]0.476288[/C][/ROW]
[ROW][C]13[/C][C]-0.145352[/C][C]-1.2333[/C][C]0.110729[/C][/ROW]
[ROW][C]14[/C][C]0.049536[/C][C]0.4203[/C][C]0.337749[/C][/ROW]
[ROW][C]15[/C][C]0.051219[/C][C]0.4346[/C][C]0.332574[/C][/ROW]
[ROW][C]16[/C][C]-0.073808[/C][C]-0.6263[/C][C]0.266557[/C][/ROW]
[ROW][C]17[/C][C]0.154323[/C][C]1.3095[/C][C]0.097268[/C][/ROW]
[ROW][C]18[/C][C]0.089002[/C][C]0.7552[/C][C]0.226295[/C][/ROW]
[ROW][C]19[/C][C]-0.005821[/C][C]-0.0494[/C][C]0.480371[/C][/ROW]
[ROW][C]20[/C][C]0.172373[/C][C]1.4626[/C][C]0.073959[/C][/ROW]
[ROW][C]21[/C][C]-0.016089[/C][C]-0.1365[/C][C]0.445897[/C][/ROW]
[ROW][C]22[/C][C]-0.028757[/C][C]-0.244[/C][C]0.403957[/C][/ROW]
[ROW][C]23[/C][C]0.102448[/C][C]0.8693[/C][C]0.193786[/C][/ROW]
[ROW][C]24[/C][C]-0.122708[/C][C]-1.0412[/C][C]0.150631[/C][/ROW]
[ROW][C]25[/C][C]-0.138878[/C][C]-1.1784[/C][C]0.121255[/C][/ROW]
[ROW][C]26[/C][C]0.005281[/C][C]0.0448[/C][C]0.48219[/C][/ROW]
[ROW][C]27[/C][C]-0.154616[/C][C]-1.312[/C][C]0.096851[/C][/ROW]
[ROW][C]28[/C][C]-0.11828[/C][C]-1.0036[/C][C]0.159458[/C][/ROW]
[ROW][C]29[/C][C]-0.120686[/C][C]-1.0241[/C][C]0.154619[/C][/ROW]
[ROW][C]30[/C][C]-0.309148[/C][C]-2.6232[/C][C]0.005313[/C][/ROW]
[ROW][C]31[/C][C]-0.178544[/C][C]-1.515[/C][C]0.067076[/C][/ROW]
[ROW][C]32[/C][C]-0.179365[/C][C]-1.522[/C][C]0.0662[/C][/ROW]
[ROW][C]33[/C][C]-0.302119[/C][C]-2.5636[/C][C]0.006224[/C][/ROW]
[ROW][C]34[/C][C]-0.171931[/C][C]-1.4589[/C][C]0.074473[/C][/ROW]
[ROW][C]35[/C][C]-0.079257[/C][C]-0.6725[/C][C]0.251702[/C][/ROW]
[ROW][C]36[/C][C]-0.242595[/C][C]-2.0585[/C][C]0.021582[/C][/ROW]
[ROW][C]37[/C][C]-0.103207[/C][C]-0.8757[/C][C]0.192043[/C][/ROW]
[ROW][C]38[/C][C]-0.074358[/C][C]-0.631[/C][C]0.265035[/C][/ROW]
[ROW][C]39[/C][C]-0.174051[/C][C]-1.4769[/C][C]0.072035[/C][/ROW]
[ROW][C]40[/C][C]-0.06834[/C][C]-0.5799[/C][C]0.281901[/C][/ROW]
[ROW][C]41[/C][C]-0.027159[/C][C]-0.2305[/C][C]0.409198[/C][/ROW]
[ROW][C]42[/C][C]-0.113783[/C][C]-0.9655[/C][C]0.168768[/C][/ROW]
[ROW][C]43[/C][C]-0.028333[/C][C]-0.2404[/C][C]0.405346[/C][/ROW]
[ROW][C]44[/C][C]-0.043659[/C][C]-0.3705[/C][C]0.356065[/C][/ROW]
[ROW][C]45[/C][C]-0.077257[/C][C]-0.6556[/C][C]0.257101[/C][/ROW]
[ROW][C]46[/C][C]0.055763[/C][C]0.4732[/C][C]0.318763[/C][/ROW]
[ROW][C]47[/C][C]-0.01761[/C][C]-0.1494[/C][C]0.440817[/C][/ROW]
[ROW][C]48[/C][C]-0.104771[/C][C]-0.889[/C][C]0.188479[/C][/ROW]
[/TABLE]
Source: https://freestatistics.org/blog/index.php?pk=309081&T=1

Globally Unique Identifier (entire table): ba.freestatistics.org/blog/index.php?pk=309081&T=1

As an alternative you can also use a QR Code:  

The GUIDs for individual cells are displayed in the table below:

Autocorrelation Function
Time lag kACF(k)T-STATP-value
10.2782292.36090.010472
20.2595442.20230.015423
30.4833544.10145.3e-05
40.0898150.76210.224244
50.1521931.29140.100348
60.2935122.49050.007531
7-0.024335-0.20650.418495
80.0480360.40760.34239
90.0909850.7720.22131
10-0.159492-1.35330.090091
11-0.002119-0.0180.492851
12-0.007033-0.05970.476288
13-0.145352-1.23330.110729
140.0495360.42030.337749
150.0512190.43460.332574
16-0.073808-0.62630.266557
170.1543231.30950.097268
180.0890020.75520.226295
19-0.005821-0.04940.480371
200.1723731.46260.073959
21-0.016089-0.13650.445897
22-0.028757-0.2440.403957
230.1024480.86930.193786
24-0.122708-1.04120.150631
25-0.138878-1.17840.121255
260.0052810.04480.48219
27-0.154616-1.3120.096851
28-0.11828-1.00360.159458
29-0.120686-1.02410.154619
30-0.309148-2.62320.005313
31-0.178544-1.5150.067076
32-0.179365-1.5220.0662
33-0.302119-2.56360.006224
34-0.171931-1.45890.074473
35-0.079257-0.67250.251702
36-0.242595-2.05850.021582
37-0.103207-0.87570.192043
38-0.074358-0.6310.265035
39-0.174051-1.47690.072035
40-0.06834-0.57990.281901
41-0.027159-0.23050.409198
42-0.113783-0.96550.168768
43-0.028333-0.24040.405346
44-0.043659-0.37050.356065
45-0.077257-0.65560.257101
460.0557630.47320.318763
47-0.01761-0.14940.440817
48-0.104771-0.8890.188479


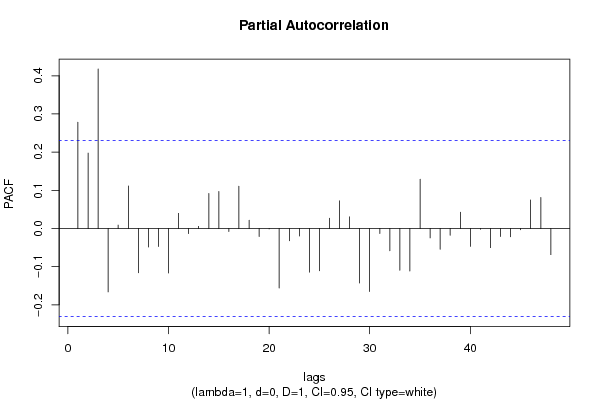
Partial Autocorrelation Function
Time lag kPACF(k)T-STATP-value
10.2782292.36090.010472
20.1974151.67510.049124
30.417843.54550.000347
4-0.166055-1.4090.081566
50.0088810.07540.470069
60.1111740.94330.17433
7-0.116223-0.98620.163672
8-0.048451-0.41110.341104
9-0.047278-0.40120.344741
10-0.116636-0.98970.16282
110.0395370.33550.369118
12-0.013453-0.11420.454718
130.0054320.04610.481683
140.0917140.77820.219495
150.0969690.82280.206667
16-0.007913-0.06710.473326
170.1106060.93850.175557
180.0214580.18210.428016
19-0.02122-0.18010.428805
20-0.001116-0.00950.496235
21-0.156013-1.32380.094877
22-0.03241-0.2750.392047
23-0.019728-0.16740.433764
24-0.114409-0.97080.16745
25-0.110875-0.94080.174975
260.0269250.22850.409965
270.0723790.61420.270523
280.0303680.25770.398693
29-0.142799-1.21170.114797
30-0.165084-1.40080.082787
31-0.013256-0.11250.455378
32-0.058526-0.49660.310489
33-0.109373-0.92810.178239
34-0.111466-0.94580.173701
350.128991.09450.138689
36-0.024704-0.20960.417278
37-0.054361-0.46130.322997
38-0.017776-0.15080.440265
390.0424590.36030.359848
40-0.046966-0.39850.345714
41-0.002192-0.01860.492606
42-0.050285-0.42670.335441
43-0.020929-0.17760.429774
44-0.021632-0.18360.42744
45-0.003316-0.02810.488816
460.0745730.63280.264443
470.0810850.6880.246823
48-0.068598-0.58210.281167

\begin{tabular}{lllllllll}
\hline
Partial Autocorrelation Function \tabularnewline
Time lag k & PACF(k) & T-STAT & P-value \tabularnewline
1 & 0.278229 & 2.3609 & 0.010472 \tabularnewline
2 & 0.197415 & 1.6751 & 0.049124 \tabularnewline
3 & 0.41784 & 3.5455 & 0.000347 \tabularnewline
4 & -0.166055 & -1.409 & 0.081566 \tabularnewline
5 & 0.008881 & 0.0754 & 0.470069 \tabularnewline
6 & 0.111174 & 0.9433 & 0.17433 \tabularnewline
7 & -0.116223 & -0.9862 & 0.163672 \tabularnewline
8 & -0.048451 & -0.4111 & 0.341104 \tabularnewline
9 & -0.047278 & -0.4012 & 0.344741 \tabularnewline
10 & -0.116636 & -0.9897 & 0.16282 \tabularnewline
11 & 0.039537 & 0.3355 & 0.369118 \tabularnewline
12 & -0.013453 & -0.1142 & 0.454718 \tabularnewline
13 & 0.005432 & 0.0461 & 0.481683 \tabularnewline
14 & 0.091714 & 0.7782 & 0.219495 \tabularnewline
15 & 0.096969 & 0.8228 & 0.206667 \tabularnewline
16 & -0.007913 & -0.0671 & 0.473326 \tabularnewline
17 & 0.110606 & 0.9385 & 0.175557 \tabularnewline
18 & 0.021458 & 0.1821 & 0.428016 \tabularnewline
19 & -0.02122 & -0.1801 & 0.428805 \tabularnewline
20 & -0.001116 & -0.0095 & 0.496235 \tabularnewline
21 & -0.156013 & -1.3238 & 0.094877 \tabularnewline
22 & -0.03241 & -0.275 & 0.392047 \tabularnewline
23 & -0.019728 & -0.1674 & 0.433764 \tabularnewline
24 & -0.114409 & -0.9708 & 0.16745 \tabularnewline
25 & -0.110875 & -0.9408 & 0.174975 \tabularnewline
26 & 0.026925 & 0.2285 & 0.409965 \tabularnewline
27 & 0.072379 & 0.6142 & 0.270523 \tabularnewline
28 & 0.030368 & 0.2577 & 0.398693 \tabularnewline
29 & -0.142799 & -1.2117 & 0.114797 \tabularnewline
30 & -0.165084 & -1.4008 & 0.082787 \tabularnewline
31 & -0.013256 & -0.1125 & 0.455378 \tabularnewline
32 & -0.058526 & -0.4966 & 0.310489 \tabularnewline
33 & -0.109373 & -0.9281 & 0.178239 \tabularnewline
34 & -0.111466 & -0.9458 & 0.173701 \tabularnewline
35 & 0.12899 & 1.0945 & 0.138689 \tabularnewline
36 & -0.024704 & -0.2096 & 0.417278 \tabularnewline
37 & -0.054361 & -0.4613 & 0.322997 \tabularnewline
38 & -0.017776 & -0.1508 & 0.440265 \tabularnewline
39 & 0.042459 & 0.3603 & 0.359848 \tabularnewline
40 & -0.046966 & -0.3985 & 0.345714 \tabularnewline
41 & -0.002192 & -0.0186 & 0.492606 \tabularnewline
42 & -0.050285 & -0.4267 & 0.335441 \tabularnewline
43 & -0.020929 & -0.1776 & 0.429774 \tabularnewline
44 & -0.021632 & -0.1836 & 0.42744 \tabularnewline
45 & -0.003316 & -0.0281 & 0.488816 \tabularnewline
46 & 0.074573 & 0.6328 & 0.264443 \tabularnewline
47 & 0.081085 & 0.688 & 0.246823 \tabularnewline
48 & -0.068598 & -0.5821 & 0.281167 \tabularnewline
\hline
\end{tabular}
%Source: https://freestatistics.org/blog/index.php?pk=309081&T=2

[TABLE]
[ROW][C]Partial Autocorrelation Function[/C][/ROW]
[ROW][C]Time lag k[/C][C]PACF(k)[/C][C]T-STAT[/C][C]P-value[/C][/ROW]
[ROW][C]1[/C][C]0.278229[/C][C]2.3609[/C][C]0.010472[/C][/ROW]
[ROW][C]2[/C][C]0.197415[/C][C]1.6751[/C][C]0.049124[/C][/ROW]
[ROW][C]3[/C][C]0.41784[/C][C]3.5455[/C][C]0.000347[/C][/ROW]
[ROW][C]4[/C][C]-0.166055[/C][C]-1.409[/C][C]0.081566[/C][/ROW]
[ROW][C]5[/C][C]0.008881[/C][C]0.0754[/C][C]0.470069[/C][/ROW]
[ROW][C]6[/C][C]0.111174[/C][C]0.9433[/C][C]0.17433[/C][/ROW]
[ROW][C]7[/C][C]-0.116223[/C][C]-0.9862[/C][C]0.163672[/C][/ROW]
[ROW][C]8[/C][C]-0.048451[/C][C]-0.4111[/C][C]0.341104[/C][/ROW]
[ROW][C]9[/C][C]-0.047278[/C][C]-0.4012[/C][C]0.344741[/C][/ROW]
[ROW][C]10[/C][C]-0.116636[/C][C]-0.9897[/C][C]0.16282[/C][/ROW]
[ROW][C]11[/C][C]0.039537[/C][C]0.3355[/C][C]0.369118[/C][/ROW]
[ROW][C]12[/C][C]-0.013453[/C][C]-0.1142[/C][C]0.454718[/C][/ROW]
[ROW][C]13[/C][C]0.005432[/C][C]0.0461[/C][C]0.481683[/C][/ROW]
[ROW][C]14[/C][C]0.091714[/C][C]0.7782[/C][C]0.219495[/C][/ROW]
[ROW][C]15[/C][C]0.096969[/C][C]0.8228[/C][C]0.206667[/C][/ROW]
[ROW][C]16[/C][C]-0.007913[/C][C]-0.0671[/C][C]0.473326[/C][/ROW]
[ROW][C]17[/C][C]0.110606[/C][C]0.9385[/C][C]0.175557[/C][/ROW]
[ROW][C]18[/C][C]0.021458[/C][C]0.1821[/C][C]0.428016[/C][/ROW]
[ROW][C]19[/C][C]-0.02122[/C][C]-0.1801[/C][C]0.428805[/C][/ROW]
[ROW][C]20[/C][C]-0.001116[/C][C]-0.0095[/C][C]0.496235[/C][/ROW]
[ROW][C]21[/C][C]-0.156013[/C][C]-1.3238[/C][C]0.094877[/C][/ROW]
[ROW][C]22[/C][C]-0.03241[/C][C]-0.275[/C][C]0.392047[/C][/ROW]
[ROW][C]23[/C][C]-0.019728[/C][C]-0.1674[/C][C]0.433764[/C][/ROW]
[ROW][C]24[/C][C]-0.114409[/C][C]-0.9708[/C][C]0.16745[/C][/ROW]
[ROW][C]25[/C][C]-0.110875[/C][C]-0.9408[/C][C]0.174975[/C][/ROW]
[ROW][C]26[/C][C]0.026925[/C][C]0.2285[/C][C]0.409965[/C][/ROW]
[ROW][C]27[/C][C]0.072379[/C][C]0.6142[/C][C]0.270523[/C][/ROW]
[ROW][C]28[/C][C]0.030368[/C][C]0.2577[/C][C]0.398693[/C][/ROW]
[ROW][C]29[/C][C]-0.142799[/C][C]-1.2117[/C][C]0.114797[/C][/ROW]
[ROW][C]30[/C][C]-0.165084[/C][C]-1.4008[/C][C]0.082787[/C][/ROW]
[ROW][C]31[/C][C]-0.013256[/C][C]-0.1125[/C][C]0.455378[/C][/ROW]
[ROW][C]32[/C][C]-0.058526[/C][C]-0.4966[/C][C]0.310489[/C][/ROW]
[ROW][C]33[/C][C]-0.109373[/C][C]-0.9281[/C][C]0.178239[/C][/ROW]
[ROW][C]34[/C][C]-0.111466[/C][C]-0.9458[/C][C]0.173701[/C][/ROW]
[ROW][C]35[/C][C]0.12899[/C][C]1.0945[/C][C]0.138689[/C][/ROW]
[ROW][C]36[/C][C]-0.024704[/C][C]-0.2096[/C][C]0.417278[/C][/ROW]
[ROW][C]37[/C][C]-0.054361[/C][C]-0.4613[/C][C]0.322997[/C][/ROW]
[ROW][C]38[/C][C]-0.017776[/C][C]-0.1508[/C][C]0.440265[/C][/ROW]
[ROW][C]39[/C][C]0.042459[/C][C]0.3603[/C][C]0.359848[/C][/ROW]
[ROW][C]40[/C][C]-0.046966[/C][C]-0.3985[/C][C]0.345714[/C][/ROW]
[ROW][C]41[/C][C]-0.002192[/C][C]-0.0186[/C][C]0.492606[/C][/ROW]
[ROW][C]42[/C][C]-0.050285[/C][C]-0.4267[/C][C]0.335441[/C][/ROW]
[ROW][C]43[/C][C]-0.020929[/C][C]-0.1776[/C][C]0.429774[/C][/ROW]
[ROW][C]44[/C][C]-0.021632[/C][C]-0.1836[/C][C]0.42744[/C][/ROW]
[ROW][C]45[/C][C]-0.003316[/C][C]-0.0281[/C][C]0.488816[/C][/ROW]
[ROW][C]46[/C][C]0.074573[/C][C]0.6328[/C][C]0.264443[/C][/ROW]
[ROW][C]47[/C][C]0.081085[/C][C]0.688[/C][C]0.246823[/C][/ROW]
[ROW][C]48[/C][C]-0.068598[/C][C]-0.5821[/C][C]0.281167[/C][/ROW]
[/TABLE]
Source: https://freestatistics.org/blog/index.php?pk=309081&T=2

Globally Unique Identifier (entire table): ba.freestatistics.org/blog/index.php?pk=309081&T=2

As an alternative you can also use a QR Code:  

The GUIDs for individual cells are displayed in the table below:

Partial Autocorrelation Function
Time lag kPACF(k)T-STATP-value
10.2782292.36090.010472
20.1974151.67510.049124
30.417843.54550.000347
4-0.166055-1.4090.081566
50.0088810.07540.470069
60.1111740.94330.17433
7-0.116223-0.98620.163672
8-0.048451-0.41110.341104
9-0.047278-0.40120.344741
10-0.116636-0.98970.16282
110.0395370.33550.369118
12-0.013453-0.11420.454718
130.0054320.04610.481683
140.0917140.77820.219495
150.0969690.82280.206667
16-0.007913-0.06710.473326
170.1106060.93850.175557
180.0214580.18210.428016
19-0.02122-0.18010.428805
20-0.001116-0.00950.496235
21-0.156013-1.32380.094877
22-0.03241-0.2750.392047
23-0.019728-0.16740.433764
24-0.114409-0.97080.16745
25-0.110875-0.94080.174975
260.0269250.22850.409965
270.0723790.61420.270523
280.0303680.25770.398693
29-0.142799-1.21170.114797
30-0.165084-1.40080.082787
31-0.013256-0.11250.455378
32-0.058526-0.49660.310489
33-0.109373-0.92810.178239
34-0.111466-0.94580.173701
350.128991.09450.138689
36-0.024704-0.20960.417278
37-0.054361-0.46130.322997
38-0.017776-0.15080.440265
390.0424590.36030.359848
40-0.046966-0.39850.345714
41-0.002192-0.01860.492606
42-0.050285-0.42670.335441
43-0.020929-0.17760.429774
44-0.021632-0.18360.42744
45-0.003316-0.02810.488816
460.0745730.63280.264443
470.0810850.6880.246823
48-0.068598-0.58210.281167


Parameters (Session):
par1 = 48 ; par2 = 1 ; par3 = 0 ; par4 = 1 ; par5 = 12 ; par6 = White Noise ; par7 = 0.95 ;
Parameters (R input):
par1 = 48 ; par2 = 1 ; par3 = 0 ; par4 = 1 ; par5 = 12 ; par6 = White Noise ; par7 = 0.95 ; par8 = ;
R code (references can be found in the software module):
if (par1 == 'Default') {
par1 = 10*log10(length(x))
} else {
par1 <- as.numeric(par1)
}
par2 <- as.numeric(par2)
par3 <- as.numeric(par3)
par4 <- as.numeric(par4)
par5 <- as.numeric(par5)
if (par6 == 'White Noise') par6 <- 'white' else par6 <- 'ma'
par7 <- as.numeric(par7)
if (par8 != '') par8 <- as.numeric(par8)
x <- na.omit(x)
ox <- x
if (par8 == '') {
if (par2 == 0) {
x <- log(x)
} else {
x <- (x ^ par2 - 1) / par2
}
} else {
x <- log(x,base=par8)
}
if (par3 > 0) x <- diff(x,lag=1,difference=par3)
if (par4 > 0) x <- diff(x,lag=par5,difference=par4)
bitmap(file='picts.png')
op <- par(mfrow=c(2,1))
plot(ox,type='l',main='Original Time Series',xlab='time',ylab='value')
if (par8=='') {
mytitle <- paste('Working Time Series (lambda=',par2,', d=',par3,', D=',par4,')',sep='')
mysub <- paste('(lambda=',par2,', d=',par3,', D=',par4,', CI=', par7, ', CI type=',par6,')',sep='')
} else {
mytitle <- paste('Working Time Series (base=',par8,', d=',par3,', D=',par4,')',sep='')
mysub <- paste('(base=',par8,', d=',par3,', D=',par4,', CI=', par7, ', CI type=',par6,')',sep='')
}
plot(x,type='l', main=mytitle,xlab='time',ylab='value')
par(op)
dev.off()
bitmap(file='pic1.png')
racf <- acf(x, par1, main='Autocorrelation', xlab='time lag', ylab='ACF', ci.type=par6, ci=par7, sub=mysub)
dev.off()
bitmap(file='pic2.png')
rpacf <- pacf(x,par1,main='Partial Autocorrelation',xlab='lags',ylab='PACF',sub=mysub)
dev.off()
(myacf <- c(racf$acf))
(mypacf <- c(rpacf$acf))
lengthx <- length(x)
sqrtn <- sqrt(lengthx)
load(file='createtable')
a<-table.start()
a<-table.row.start(a)
a<-table.element(a,'Autocorrelation Function',4,TRUE)
a<-table.row.end(a)
a<-table.row.start(a)
a<-table.element(a,'Time lag k',header=TRUE)
a<-table.element(a,'ACF(k)',header=TRUE)
a<-table.element(a,'T-STAT',header=TRUE)
a<-table.element(a,'P-value',header=TRUE)
a<-table.row.end(a)
for (i in 2:(par1+1)) {
a<-table.row.start(a)
a<-table.element(a,i-1,header=TRUE)
a<-table.element(a,round(myacf[i],6))
mytstat <- myacf[i]*sqrtn
a<-table.element(a,round(mytstat,4))
a<-table.element(a,round(1-pt(abs(mytstat),lengthx),6))
a<-table.row.end(a)
}
a<-table.end(a)
table.save(a,file='mytable.tab')
a<-table.start()
a<-table.row.start(a)
a<-table.element(a,'Partial Autocorrelation Function',4,TRUE)
a<-table.row.end(a)
a<-table.row.start(a)
a<-table.element(a,'Time lag k',header=TRUE)
a<-table.element(a,'PACF(k)',header=TRUE)
a<-table.element(a,'T-STAT',header=TRUE)
a<-table.element(a,'P-value',header=TRUE)
a<-table.row.end(a)
for (i in 1:par1) {
a<-table.row.start(a)
a<-table.element(a,i,header=TRUE)
a<-table.element(a,round(mypacf[i],6))
mytstat <- mypacf[i]*sqrtn
a<-table.element(a,round(mytstat,4))
a<-table.element(a,round(1-pt(abs(mytstat),lengthx),6))
a<-table.row.end(a)
}
a<-table.end(a)
table.save(a,file='mytable1.tab')