Free Statistics

of Irreproducible Research!

Author's title

Author*The author of this computation has been verified*
R Software Modulerwasp_autocorrelation.wasp
Title produced by software(Partial) Autocorrelation Function
Date of computationTue, 12 Dec 2017 14:31:06 +0100
Cite this page as followsStatistical Computations at FreeStatistics.org, Office for Research Development and Education, URL https://freestatistics.org/blog/index.php?v=date/2017/Dec/12/t1513085487hvrvtqp8vxg9c4r.htm/, Retrieved Wed, 15 May 2024 17:07:41 +0000
Statistical Computations at FreeStatistics.org, Office for Research Development and Education, URL https://freestatistics.org/blog/index.php?pk=309076, Retrieved Wed, 15 May 2024 17:07:41 +0000
QR Codes:

Original text written by user:
IsPrivate?No (this computation is public)
User-defined keywordsLBE
Estimated Impact73
Family? (F = Feedback message, R = changed R code, M = changed R Module, P = changed Parameters, D = changed Data)
-       [(Partial) Autocorrelation Function] [Time series Parti...] [2017-12-12 13:31:06] [3c189a0c4f7caff37e2cfca896353419] [Current]
Feedback Forum

Post a new message
Dataseries X:
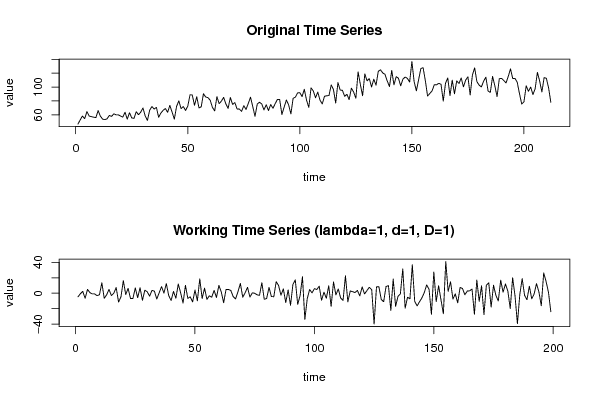
46.8
52.8
58.3
54.5
64.7
58.3
57.5
56.7
56
66.2
58.2
53.9
53.1
54.4
59.2
57.8
61.5
60.1
60.1
58.4
56.8
63.8
53.9
63.1
55.7
54.9
64.6
60.2
63.9
69.9
58.5
52
66.7
72
68.4
70.8
56.5
62.6
66.5
69.2
63.7
73.6
64.1
53.8
72.2
80.2
69.1
72
66.3
72.5
88.9
88.6
73.7
86
70
71.6
90.5
85.7
84.8
81.1
70.8
65.7
86.2
76.1
79.8
85.2
75.8
69.4
85
75
77.7
68.5
68.4
65
73.2
67.9
76.5
85.5
71.7
57.9
75.5
78.2
75.7
67.1
74.6
66.2
74.9
69.5
76.1
82.3
82.1
60.5
71.2
81.4
74.5
61.4
83.8
85.4
91.6
91.9
86.3
96.8
81
70.8
98.8
94.5
84.5
92.8
81.2
75.7
86.7
87.5
87.8
103.1
96.4
77.1
106.5
95.7
95.3
86.6
89.6
81.9
98.4
92.9
83.9
121.8
103.9
87.5
118.9
109
112.2
100.1
111.3
102.7
122.6
124.8
120.3
118.3
108.7
100.7
124
103.1
115
112.7
101.7
111.5
114.4
112.5
107.2
136.7
107.8
94.6
110.7
126.6
127.9
109.2
87.1
90.8
94.5
103.3
103.2
105.4
103.9
79.8
105.6
113
87.7
110
90.3
108.9
105.1
113
100.4
110.1
114.7
88.6
117.2
127.7
107.8
102.8
100.2
108.4
114.2
94.4
92.2
115.3
102
86.3
112
112.5
109.5
105.9
115.3
126.2
112.2
112.5
106.9
90.6
75.6
78.8
101.8
93.9
100
89.2
97.7
121.1
108.8
92.9
113.6
112.6
98.8
78


Summary of computational transaction
Raw Input view raw input (R code)
Raw Outputview raw output of R engine
Computing time1 seconds
R ServerBig Analytics Cloud Computing Center

\begin{tabular}{lllllllll}
\hline
Summary of computational transaction \tabularnewline
Raw Input view raw input (R code)  \tabularnewline
Raw Outputview raw output of R engine  \tabularnewline
Computing time1 seconds \tabularnewline
R ServerBig Analytics Cloud Computing Center \tabularnewline
\hline
\end{tabular}
%Source: https://freestatistics.org/blog/index.php?pk=309076&T=0

[TABLE]
[ROW]
Summary of computational transaction[/C][/ROW] [ROW]Raw Input[/C] view raw input (R code) [/C][/ROW] [ROW]Raw Output[/C]view raw output of R engine [/C][/ROW] [ROW]Computing time[/C]1 seconds[/C][/ROW] [ROW]R Server[/C]Big Analytics Cloud Computing Center[/C][/ROW] [/TABLE] Source: https://freestatistics.org/blog/index.php?pk=309076&T=0

Globally Unique Identifier (entire table): ba.freestatistics.org/blog/index.php?pk=309076&T=0

As an alternative you can also use a QR Code:  

The GUIDs for individual cells are displayed in the table below:

Summary of computational transaction
Raw Input view raw input (R code)
Raw Outputview raw output of R engine
Computing time1 seconds
R ServerBig Analytics Cloud Computing Center


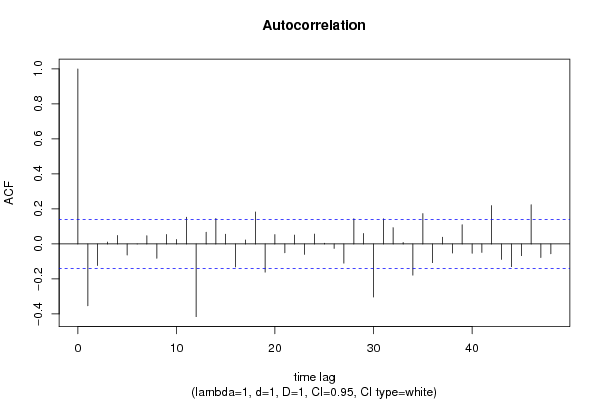
Autocorrelation Function
Time lag kACF(k)T-STATP-value
1-0.353213-4.98271e-06
2-0.123308-1.73950.041749
30.0107760.1520.439663
40.0480940.67850.249136
5-0.062662-0.8840.188892
6-0.000553-0.00780.49689
70.0468040.66020.25493
8-0.081729-1.15290.12516
90.0546150.77040.220975
100.0258840.36510.357698
110.1526392.15320.016252
12-0.415182-5.85690
130.067430.95120.171325
140.1459712.05920.02039
150.0558440.78780.215884
16-0.13097-1.84760.033075
170.0227150.32040.374487
180.1823782.57280.005409
19-0.160752-2.26770.012211
200.0537260.75790.224704
21-0.049736-0.70160.241868
220.0507510.71590.237437
23-0.059539-0.83990.200985
240.0563120.79440.213961
250.0038110.05380.478592
26-0.025123-0.35440.361706
27-0.109639-1.54670.061768
280.1440982.03280.021703
290.0597860.84340.200014
30-0.302618-4.2691.5e-05
310.1436762.02680.022008
320.093311.31630.094794
330.0088790.12530.450223
34-0.17802-2.51130.006412
350.1736652.44980.007578
36-0.106494-1.50230.067305
370.0387770.5470.292491
38-0.051515-0.72670.234128
390.110261.55540.06072
40-0.053059-0.74850.227523
41-0.04806-0.6780.249288
420.2192383.09270.001134
43-0.087852-1.23930.108345
44-0.129271-1.82360.034857
45-0.066473-0.93770.174764
460.2244493.16620.000894
47-0.077634-1.09520.137383
48-0.056319-0.79450.213931

\begin{tabular}{lllllllll}
\hline
Autocorrelation Function \tabularnewline
Time lag k & ACF(k) & T-STAT & P-value \tabularnewline
1 & -0.353213 & -4.9827 & 1e-06 \tabularnewline
2 & -0.123308 & -1.7395 & 0.041749 \tabularnewline
3 & 0.010776 & 0.152 & 0.439663 \tabularnewline
4 & 0.048094 & 0.6785 & 0.249136 \tabularnewline
5 & -0.062662 & -0.884 & 0.188892 \tabularnewline
6 & -0.000553 & -0.0078 & 0.49689 \tabularnewline
7 & 0.046804 & 0.6602 & 0.25493 \tabularnewline
8 & -0.081729 & -1.1529 & 0.12516 \tabularnewline
9 & 0.054615 & 0.7704 & 0.220975 \tabularnewline
10 & 0.025884 & 0.3651 & 0.357698 \tabularnewline
11 & 0.152639 & 2.1532 & 0.016252 \tabularnewline
12 & -0.415182 & -5.8569 & 0 \tabularnewline
13 & 0.06743 & 0.9512 & 0.171325 \tabularnewline
14 & 0.145971 & 2.0592 & 0.02039 \tabularnewline
15 & 0.055844 & 0.7878 & 0.215884 \tabularnewline
16 & -0.13097 & -1.8476 & 0.033075 \tabularnewline
17 & 0.022715 & 0.3204 & 0.374487 \tabularnewline
18 & 0.182378 & 2.5728 & 0.005409 \tabularnewline
19 & -0.160752 & -2.2677 & 0.012211 \tabularnewline
20 & 0.053726 & 0.7579 & 0.224704 \tabularnewline
21 & -0.049736 & -0.7016 & 0.241868 \tabularnewline
22 & 0.050751 & 0.7159 & 0.237437 \tabularnewline
23 & -0.059539 & -0.8399 & 0.200985 \tabularnewline
24 & 0.056312 & 0.7944 & 0.213961 \tabularnewline
25 & 0.003811 & 0.0538 & 0.478592 \tabularnewline
26 & -0.025123 & -0.3544 & 0.361706 \tabularnewline
27 & -0.109639 & -1.5467 & 0.061768 \tabularnewline
28 & 0.144098 & 2.0328 & 0.021703 \tabularnewline
29 & 0.059786 & 0.8434 & 0.200014 \tabularnewline
30 & -0.302618 & -4.269 & 1.5e-05 \tabularnewline
31 & 0.143676 & 2.0268 & 0.022008 \tabularnewline
32 & 0.09331 & 1.3163 & 0.094794 \tabularnewline
33 & 0.008879 & 0.1253 & 0.450223 \tabularnewline
34 & -0.17802 & -2.5113 & 0.006412 \tabularnewline
35 & 0.173665 & 2.4498 & 0.007578 \tabularnewline
36 & -0.106494 & -1.5023 & 0.067305 \tabularnewline
37 & 0.038777 & 0.547 & 0.292491 \tabularnewline
38 & -0.051515 & -0.7267 & 0.234128 \tabularnewline
39 & 0.11026 & 1.5554 & 0.06072 \tabularnewline
40 & -0.053059 & -0.7485 & 0.227523 \tabularnewline
41 & -0.04806 & -0.678 & 0.249288 \tabularnewline
42 & 0.219238 & 3.0927 & 0.001134 \tabularnewline
43 & -0.087852 & -1.2393 & 0.108345 \tabularnewline
44 & -0.129271 & -1.8236 & 0.034857 \tabularnewline
45 & -0.066473 & -0.9377 & 0.174764 \tabularnewline
46 & 0.224449 & 3.1662 & 0.000894 \tabularnewline
47 & -0.077634 & -1.0952 & 0.137383 \tabularnewline
48 & -0.056319 & -0.7945 & 0.213931 \tabularnewline
\hline
\end{tabular}
%Source: https://freestatistics.org/blog/index.php?pk=309076&T=1

[TABLE]
[ROW][C]Autocorrelation Function[/C][/ROW]
[ROW][C]Time lag k[/C][C]ACF(k)[/C][C]T-STAT[/C][C]P-value[/C][/ROW]
[ROW][C]1[/C][C]-0.353213[/C][C]-4.9827[/C][C]1e-06[/C][/ROW]
[ROW][C]2[/C][C]-0.123308[/C][C]-1.7395[/C][C]0.041749[/C][/ROW]
[ROW][C]3[/C][C]0.010776[/C][C]0.152[/C][C]0.439663[/C][/ROW]
[ROW][C]4[/C][C]0.048094[/C][C]0.6785[/C][C]0.249136[/C][/ROW]
[ROW][C]5[/C][C]-0.062662[/C][C]-0.884[/C][C]0.188892[/C][/ROW]
[ROW][C]6[/C][C]-0.000553[/C][C]-0.0078[/C][C]0.49689[/C][/ROW]
[ROW][C]7[/C][C]0.046804[/C][C]0.6602[/C][C]0.25493[/C][/ROW]
[ROW][C]8[/C][C]-0.081729[/C][C]-1.1529[/C][C]0.12516[/C][/ROW]
[ROW][C]9[/C][C]0.054615[/C][C]0.7704[/C][C]0.220975[/C][/ROW]
[ROW][C]10[/C][C]0.025884[/C][C]0.3651[/C][C]0.357698[/C][/ROW]
[ROW][C]11[/C][C]0.152639[/C][C]2.1532[/C][C]0.016252[/C][/ROW]
[ROW][C]12[/C][C]-0.415182[/C][C]-5.8569[/C][C]0[/C][/ROW]
[ROW][C]13[/C][C]0.06743[/C][C]0.9512[/C][C]0.171325[/C][/ROW]
[ROW][C]14[/C][C]0.145971[/C][C]2.0592[/C][C]0.02039[/C][/ROW]
[ROW][C]15[/C][C]0.055844[/C][C]0.7878[/C][C]0.215884[/C][/ROW]
[ROW][C]16[/C][C]-0.13097[/C][C]-1.8476[/C][C]0.033075[/C][/ROW]
[ROW][C]17[/C][C]0.022715[/C][C]0.3204[/C][C]0.374487[/C][/ROW]
[ROW][C]18[/C][C]0.182378[/C][C]2.5728[/C][C]0.005409[/C][/ROW]
[ROW][C]19[/C][C]-0.160752[/C][C]-2.2677[/C][C]0.012211[/C][/ROW]
[ROW][C]20[/C][C]0.053726[/C][C]0.7579[/C][C]0.224704[/C][/ROW]
[ROW][C]21[/C][C]-0.049736[/C][C]-0.7016[/C][C]0.241868[/C][/ROW]
[ROW][C]22[/C][C]0.050751[/C][C]0.7159[/C][C]0.237437[/C][/ROW]
[ROW][C]23[/C][C]-0.059539[/C][C]-0.8399[/C][C]0.200985[/C][/ROW]
[ROW][C]24[/C][C]0.056312[/C][C]0.7944[/C][C]0.213961[/C][/ROW]
[ROW][C]25[/C][C]0.003811[/C][C]0.0538[/C][C]0.478592[/C][/ROW]
[ROW][C]26[/C][C]-0.025123[/C][C]-0.3544[/C][C]0.361706[/C][/ROW]
[ROW][C]27[/C][C]-0.109639[/C][C]-1.5467[/C][C]0.061768[/C][/ROW]
[ROW][C]28[/C][C]0.144098[/C][C]2.0328[/C][C]0.021703[/C][/ROW]
[ROW][C]29[/C][C]0.059786[/C][C]0.8434[/C][C]0.200014[/C][/ROW]
[ROW][C]30[/C][C]-0.302618[/C][C]-4.269[/C][C]1.5e-05[/C][/ROW]
[ROW][C]31[/C][C]0.143676[/C][C]2.0268[/C][C]0.022008[/C][/ROW]
[ROW][C]32[/C][C]0.09331[/C][C]1.3163[/C][C]0.094794[/C][/ROW]
[ROW][C]33[/C][C]0.008879[/C][C]0.1253[/C][C]0.450223[/C][/ROW]
[ROW][C]34[/C][C]-0.17802[/C][C]-2.5113[/C][C]0.006412[/C][/ROW]
[ROW][C]35[/C][C]0.173665[/C][C]2.4498[/C][C]0.007578[/C][/ROW]
[ROW][C]36[/C][C]-0.106494[/C][C]-1.5023[/C][C]0.067305[/C][/ROW]
[ROW][C]37[/C][C]0.038777[/C][C]0.547[/C][C]0.292491[/C][/ROW]
[ROW][C]38[/C][C]-0.051515[/C][C]-0.7267[/C][C]0.234128[/C][/ROW]
[ROW][C]39[/C][C]0.11026[/C][C]1.5554[/C][C]0.06072[/C][/ROW]
[ROW][C]40[/C][C]-0.053059[/C][C]-0.7485[/C][C]0.227523[/C][/ROW]
[ROW][C]41[/C][C]-0.04806[/C][C]-0.678[/C][C]0.249288[/C][/ROW]
[ROW][C]42[/C][C]0.219238[/C][C]3.0927[/C][C]0.001134[/C][/ROW]
[ROW][C]43[/C][C]-0.087852[/C][C]-1.2393[/C][C]0.108345[/C][/ROW]
[ROW][C]44[/C][C]-0.129271[/C][C]-1.8236[/C][C]0.034857[/C][/ROW]
[ROW][C]45[/C][C]-0.066473[/C][C]-0.9377[/C][C]0.174764[/C][/ROW]
[ROW][C]46[/C][C]0.224449[/C][C]3.1662[/C][C]0.000894[/C][/ROW]
[ROW][C]47[/C][C]-0.077634[/C][C]-1.0952[/C][C]0.137383[/C][/ROW]
[ROW][C]48[/C][C]-0.056319[/C][C]-0.7945[/C][C]0.213931[/C][/ROW]
[/TABLE]
Source: https://freestatistics.org/blog/index.php?pk=309076&T=1

Globally Unique Identifier (entire table): ba.freestatistics.org/blog/index.php?pk=309076&T=1

As an alternative you can also use a QR Code:  

The GUIDs for individual cells are displayed in the table below:

Autocorrelation Function
Time lag kACF(k)T-STATP-value
1-0.353213-4.98271e-06
2-0.123308-1.73950.041749
30.0107760.1520.439663
40.0480940.67850.249136
5-0.062662-0.8840.188892
6-0.000553-0.00780.49689
70.0468040.66020.25493
8-0.081729-1.15290.12516
90.0546150.77040.220975
100.0258840.36510.357698
110.1526392.15320.016252
12-0.415182-5.85690
130.067430.95120.171325
140.1459712.05920.02039
150.0558440.78780.215884
16-0.13097-1.84760.033075
170.0227150.32040.374487
180.1823782.57280.005409
19-0.160752-2.26770.012211
200.0537260.75790.224704
21-0.049736-0.70160.241868
220.0507510.71590.237437
23-0.059539-0.83990.200985
240.0563120.79440.213961
250.0038110.05380.478592
26-0.025123-0.35440.361706
27-0.109639-1.54670.061768
280.1440982.03280.021703
290.0597860.84340.200014
30-0.302618-4.2691.5e-05
310.1436762.02680.022008
320.093311.31630.094794
330.0088790.12530.450223
34-0.17802-2.51130.006412
350.1736652.44980.007578
36-0.106494-1.50230.067305
370.0387770.5470.292491
38-0.051515-0.72670.234128
390.110261.55540.06072
40-0.053059-0.74850.227523
41-0.04806-0.6780.249288
420.2192383.09270.001134
43-0.087852-1.23930.108345
44-0.129271-1.82360.034857
45-0.066473-0.93770.174764
460.2244493.16620.000894
47-0.077634-1.09520.137383
48-0.056319-0.79450.213931


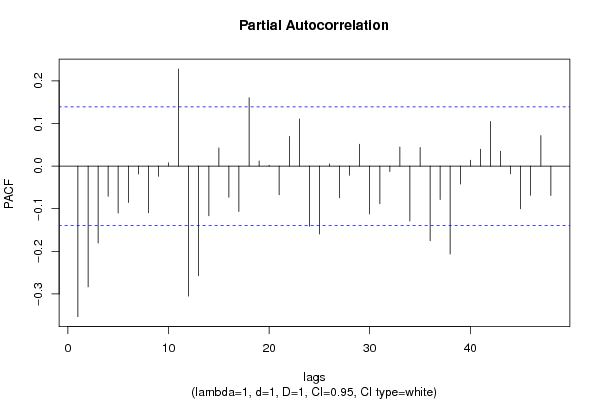
Partial Autocorrelation Function
Time lag kPACF(k)T-STATP-value
1-0.353213-4.98271e-06
2-0.283428-3.99824.5e-05
3-0.180428-2.54530.005839
4-0.070928-1.00060.159128
5-0.11007-1.55270.061039
6-0.085378-1.20440.114932
7-0.018609-0.26250.396599
8-0.109492-1.54460.062019
9-0.024033-0.3390.367474
100.0075870.1070.457439
110.2278473.21420.000763
12-0.305003-4.30261.3e-05
13-0.25747-3.63210.000179
14-0.116374-1.64170.05112
150.0425290.60.27461
16-0.073174-1.03230.151603
17-0.106788-1.50640.066772
180.1604752.26380.012333
190.0120860.17050.432398
200.0021090.02970.488149
21-0.067289-0.94920.171827
220.0696120.9820.163646
230.1103861.55720.060507
24-0.140997-1.9890.024035
25-0.159414-2.24880.01281
260.0047530.0670.473307
27-0.074167-1.04630.148357
28-0.021413-0.30210.381456
290.0513010.72370.235054
30-0.11212-1.58160.057659
31-0.088406-1.24710.106909
32-0.012589-0.17760.429613
330.0449190.63370.263516
34-0.128906-1.81840.03525
350.0434820.61340.270162
36-0.175327-2.47330.007113
37-0.078598-1.10880.134435
38-0.206278-2.90990.002013
39-0.04206-0.59330.276817
400.013840.19520.422701
410.0393620.55530.289667
420.1044811.47390.071046
430.0348170.49120.31193
44-0.017873-0.25210.400599
45-0.100232-1.41390.07947
46-0.068463-0.96580.167662
470.0715351.00910.157068
48-0.069031-0.97380.165669

\begin{tabular}{lllllllll}
\hline
Partial Autocorrelation Function \tabularnewline
Time lag k & PACF(k) & T-STAT & P-value \tabularnewline
1 & -0.353213 & -4.9827 & 1e-06 \tabularnewline
2 & -0.283428 & -3.9982 & 4.5e-05 \tabularnewline
3 & -0.180428 & -2.5453 & 0.005839 \tabularnewline
4 & -0.070928 & -1.0006 & 0.159128 \tabularnewline
5 & -0.11007 & -1.5527 & 0.061039 \tabularnewline
6 & -0.085378 & -1.2044 & 0.114932 \tabularnewline
7 & -0.018609 & -0.2625 & 0.396599 \tabularnewline
8 & -0.109492 & -1.5446 & 0.062019 \tabularnewline
9 & -0.024033 & -0.339 & 0.367474 \tabularnewline
10 & 0.007587 & 0.107 & 0.457439 \tabularnewline
11 & 0.227847 & 3.2142 & 0.000763 \tabularnewline
12 & -0.305003 & -4.3026 & 1.3e-05 \tabularnewline
13 & -0.25747 & -3.6321 & 0.000179 \tabularnewline
14 & -0.116374 & -1.6417 & 0.05112 \tabularnewline
15 & 0.042529 & 0.6 & 0.27461 \tabularnewline
16 & -0.073174 & -1.0323 & 0.151603 \tabularnewline
17 & -0.106788 & -1.5064 & 0.066772 \tabularnewline
18 & 0.160475 & 2.2638 & 0.012333 \tabularnewline
19 & 0.012086 & 0.1705 & 0.432398 \tabularnewline
20 & 0.002109 & 0.0297 & 0.488149 \tabularnewline
21 & -0.067289 & -0.9492 & 0.171827 \tabularnewline
22 & 0.069612 & 0.982 & 0.163646 \tabularnewline
23 & 0.110386 & 1.5572 & 0.060507 \tabularnewline
24 & -0.140997 & -1.989 & 0.024035 \tabularnewline
25 & -0.159414 & -2.2488 & 0.01281 \tabularnewline
26 & 0.004753 & 0.067 & 0.473307 \tabularnewline
27 & -0.074167 & -1.0463 & 0.148357 \tabularnewline
28 & -0.021413 & -0.3021 & 0.381456 \tabularnewline
29 & 0.051301 & 0.7237 & 0.235054 \tabularnewline
30 & -0.11212 & -1.5816 & 0.057659 \tabularnewline
31 & -0.088406 & -1.2471 & 0.106909 \tabularnewline
32 & -0.012589 & -0.1776 & 0.429613 \tabularnewline
33 & 0.044919 & 0.6337 & 0.263516 \tabularnewline
34 & -0.128906 & -1.8184 & 0.03525 \tabularnewline
35 & 0.043482 & 0.6134 & 0.270162 \tabularnewline
36 & -0.175327 & -2.4733 & 0.007113 \tabularnewline
37 & -0.078598 & -1.1088 & 0.134435 \tabularnewline
38 & -0.206278 & -2.9099 & 0.002013 \tabularnewline
39 & -0.04206 & -0.5933 & 0.276817 \tabularnewline
40 & 0.01384 & 0.1952 & 0.422701 \tabularnewline
41 & 0.039362 & 0.5553 & 0.289667 \tabularnewline
42 & 0.104481 & 1.4739 & 0.071046 \tabularnewline
43 & 0.034817 & 0.4912 & 0.31193 \tabularnewline
44 & -0.017873 & -0.2521 & 0.400599 \tabularnewline
45 & -0.100232 & -1.4139 & 0.07947 \tabularnewline
46 & -0.068463 & -0.9658 & 0.167662 \tabularnewline
47 & 0.071535 & 1.0091 & 0.157068 \tabularnewline
48 & -0.069031 & -0.9738 & 0.165669 \tabularnewline
\hline
\end{tabular}
%Source: https://freestatistics.org/blog/index.php?pk=309076&T=2

[TABLE]
[ROW][C]Partial Autocorrelation Function[/C][/ROW]
[ROW][C]Time lag k[/C][C]PACF(k)[/C][C]T-STAT[/C][C]P-value[/C][/ROW]
[ROW][C]1[/C][C]-0.353213[/C][C]-4.9827[/C][C]1e-06[/C][/ROW]
[ROW][C]2[/C][C]-0.283428[/C][C]-3.9982[/C][C]4.5e-05[/C][/ROW]
[ROW][C]3[/C][C]-0.180428[/C][C]-2.5453[/C][C]0.005839[/C][/ROW]
[ROW][C]4[/C][C]-0.070928[/C][C]-1.0006[/C][C]0.159128[/C][/ROW]
[ROW][C]5[/C][C]-0.11007[/C][C]-1.5527[/C][C]0.061039[/C][/ROW]
[ROW][C]6[/C][C]-0.085378[/C][C]-1.2044[/C][C]0.114932[/C][/ROW]
[ROW][C]7[/C][C]-0.018609[/C][C]-0.2625[/C][C]0.396599[/C][/ROW]
[ROW][C]8[/C][C]-0.109492[/C][C]-1.5446[/C][C]0.062019[/C][/ROW]
[ROW][C]9[/C][C]-0.024033[/C][C]-0.339[/C][C]0.367474[/C][/ROW]
[ROW][C]10[/C][C]0.007587[/C][C]0.107[/C][C]0.457439[/C][/ROW]
[ROW][C]11[/C][C]0.227847[/C][C]3.2142[/C][C]0.000763[/C][/ROW]
[ROW][C]12[/C][C]-0.305003[/C][C]-4.3026[/C][C]1.3e-05[/C][/ROW]
[ROW][C]13[/C][C]-0.25747[/C][C]-3.6321[/C][C]0.000179[/C][/ROW]
[ROW][C]14[/C][C]-0.116374[/C][C]-1.6417[/C][C]0.05112[/C][/ROW]
[ROW][C]15[/C][C]0.042529[/C][C]0.6[/C][C]0.27461[/C][/ROW]
[ROW][C]16[/C][C]-0.073174[/C][C]-1.0323[/C][C]0.151603[/C][/ROW]
[ROW][C]17[/C][C]-0.106788[/C][C]-1.5064[/C][C]0.066772[/C][/ROW]
[ROW][C]18[/C][C]0.160475[/C][C]2.2638[/C][C]0.012333[/C][/ROW]
[ROW][C]19[/C][C]0.012086[/C][C]0.1705[/C][C]0.432398[/C][/ROW]
[ROW][C]20[/C][C]0.002109[/C][C]0.0297[/C][C]0.488149[/C][/ROW]
[ROW][C]21[/C][C]-0.067289[/C][C]-0.9492[/C][C]0.171827[/C][/ROW]
[ROW][C]22[/C][C]0.069612[/C][C]0.982[/C][C]0.163646[/C][/ROW]
[ROW][C]23[/C][C]0.110386[/C][C]1.5572[/C][C]0.060507[/C][/ROW]
[ROW][C]24[/C][C]-0.140997[/C][C]-1.989[/C][C]0.024035[/C][/ROW]
[ROW][C]25[/C][C]-0.159414[/C][C]-2.2488[/C][C]0.01281[/C][/ROW]
[ROW][C]26[/C][C]0.004753[/C][C]0.067[/C][C]0.473307[/C][/ROW]
[ROW][C]27[/C][C]-0.074167[/C][C]-1.0463[/C][C]0.148357[/C][/ROW]
[ROW][C]28[/C][C]-0.021413[/C][C]-0.3021[/C][C]0.381456[/C][/ROW]
[ROW][C]29[/C][C]0.051301[/C][C]0.7237[/C][C]0.235054[/C][/ROW]
[ROW][C]30[/C][C]-0.11212[/C][C]-1.5816[/C][C]0.057659[/C][/ROW]
[ROW][C]31[/C][C]-0.088406[/C][C]-1.2471[/C][C]0.106909[/C][/ROW]
[ROW][C]32[/C][C]-0.012589[/C][C]-0.1776[/C][C]0.429613[/C][/ROW]
[ROW][C]33[/C][C]0.044919[/C][C]0.6337[/C][C]0.263516[/C][/ROW]
[ROW][C]34[/C][C]-0.128906[/C][C]-1.8184[/C][C]0.03525[/C][/ROW]
[ROW][C]35[/C][C]0.043482[/C][C]0.6134[/C][C]0.270162[/C][/ROW]
[ROW][C]36[/C][C]-0.175327[/C][C]-2.4733[/C][C]0.007113[/C][/ROW]
[ROW][C]37[/C][C]-0.078598[/C][C]-1.1088[/C][C]0.134435[/C][/ROW]
[ROW][C]38[/C][C]-0.206278[/C][C]-2.9099[/C][C]0.002013[/C][/ROW]
[ROW][C]39[/C][C]-0.04206[/C][C]-0.5933[/C][C]0.276817[/C][/ROW]
[ROW][C]40[/C][C]0.01384[/C][C]0.1952[/C][C]0.422701[/C][/ROW]
[ROW][C]41[/C][C]0.039362[/C][C]0.5553[/C][C]0.289667[/C][/ROW]
[ROW][C]42[/C][C]0.104481[/C][C]1.4739[/C][C]0.071046[/C][/ROW]
[ROW][C]43[/C][C]0.034817[/C][C]0.4912[/C][C]0.31193[/C][/ROW]
[ROW][C]44[/C][C]-0.017873[/C][C]-0.2521[/C][C]0.400599[/C][/ROW]
[ROW][C]45[/C][C]-0.100232[/C][C]-1.4139[/C][C]0.07947[/C][/ROW]
[ROW][C]46[/C][C]-0.068463[/C][C]-0.9658[/C][C]0.167662[/C][/ROW]
[ROW][C]47[/C][C]0.071535[/C][C]1.0091[/C][C]0.157068[/C][/ROW]
[ROW][C]48[/C][C]-0.069031[/C][C]-0.9738[/C][C]0.165669[/C][/ROW]
[/TABLE]
Source: https://freestatistics.org/blog/index.php?pk=309076&T=2

Globally Unique Identifier (entire table): ba.freestatistics.org/blog/index.php?pk=309076&T=2

As an alternative you can also use a QR Code:  

The GUIDs for individual cells are displayed in the table below:

Partial Autocorrelation Function
Time lag kPACF(k)T-STATP-value
1-0.353213-4.98271e-06
2-0.283428-3.99824.5e-05
3-0.180428-2.54530.005839
4-0.070928-1.00060.159128
5-0.11007-1.55270.061039
6-0.085378-1.20440.114932
7-0.018609-0.26250.396599
8-0.109492-1.54460.062019
9-0.024033-0.3390.367474
100.0075870.1070.457439
110.2278473.21420.000763
12-0.305003-4.30261.3e-05
13-0.25747-3.63210.000179
14-0.116374-1.64170.05112
150.0425290.60.27461
16-0.073174-1.03230.151603
17-0.106788-1.50640.066772
180.1604752.26380.012333
190.0120860.17050.432398
200.0021090.02970.488149
21-0.067289-0.94920.171827
220.0696120.9820.163646
230.1103861.55720.060507
24-0.140997-1.9890.024035
25-0.159414-2.24880.01281
260.0047530.0670.473307
27-0.074167-1.04630.148357
28-0.021413-0.30210.381456
290.0513010.72370.235054
30-0.11212-1.58160.057659
31-0.088406-1.24710.106909
32-0.012589-0.17760.429613
330.0449190.63370.263516
34-0.128906-1.81840.03525
350.0434820.61340.270162
36-0.175327-2.47330.007113
37-0.078598-1.10880.134435
38-0.206278-2.90990.002013
39-0.04206-0.59330.276817
400.013840.19520.422701
410.0393620.55530.289667
420.1044811.47390.071046
430.0348170.49120.31193
44-0.017873-0.25210.400599
45-0.100232-1.41390.07947
46-0.068463-0.96580.167662
470.0715351.00910.157068
48-0.069031-0.97380.165669


Parameters (Session):
par1 = 1 ; par2 = 1 ; par3 = 1 ; par4 = 12 ;
Parameters (R input):
par1 = 48 ; par2 = 1 ; par3 = 1 ; par4 = 1 ; par5 = 12 ; par6 = White Noise ; par7 = 0.95 ; par8 = ;
R code (references can be found in the software module):
par8 <- ''
par7 <- '0.95'
par6 <- 'White Noise'
par5 <- '12'
par4 <- '1'
par3 <- '1'
par2 <- '1'
par1 <- '1'
if (par1 == 'Default') {
par1 = 10*log10(length(x))
} else {
par1 <- as.numeric(par1)
}
par2 <- as.numeric(par2)
par3 <- as.numeric(par3)
par4 <- as.numeric(par4)
par5 <- as.numeric(par5)
if (par6 == 'White Noise') par6 <- 'white' else par6 <- 'ma'
par7 <- as.numeric(par7)
if (par8 != '') par8 <- as.numeric(par8)
x <- na.omit(x)
ox <- x
if (par8 == '') {
if (par2 == 0) {
x <- log(x)
} else {
x <- (x ^ par2 - 1) / par2
}
} else {
x <- log(x,base=par8)
}
if (par3 > 0) x <- diff(x,lag=1,difference=par3)
if (par4 > 0) x <- diff(x,lag=par5,difference=par4)
bitmap(file='picts.png')
op <- par(mfrow=c(2,1))
plot(ox,type='l',main='Original Time Series',xlab='time',ylab='value')
if (par8=='') {
mytitle <- paste('Working Time Series (lambda=',par2,', d=',par3,', D=',par4,')',sep='')
mysub <- paste('(lambda=',par2,', d=',par3,', D=',par4,', CI=', par7, ', CI type=',par6,')',sep='')
} else {
mytitle <- paste('Working Time Series (base=',par8,', d=',par3,', D=',par4,')',sep='')
mysub <- paste('(base=',par8,', d=',par3,', D=',par4,', CI=', par7, ', CI type=',par6,')',sep='')
}
plot(x,type='l', main=mytitle,xlab='time',ylab='value')
par(op)
dev.off()
bitmap(file='pic1.png')
racf <- acf(x, par1, main='Autocorrelation', xlab='time lag', ylab='ACF', ci.type=par6, ci=par7, sub=mysub)
dev.off()
bitmap(file='pic2.png')
rpacf <- pacf(x,par1,main='Partial Autocorrelation',xlab='lags',ylab='PACF',sub=mysub)
dev.off()
(myacf <- c(racf$acf))
(mypacf <- c(rpacf$acf))
lengthx <- length(x)
sqrtn <- sqrt(lengthx)
load(file='createtable')
a<-table.start()
a<-table.row.start(a)
a<-table.element(a,'Autocorrelation Function',4,TRUE)
a<-table.row.end(a)
a<-table.row.start(a)
a<-table.element(a,'Time lag k',header=TRUE)
a<-table.element(a,'ACF(k)',header=TRUE)
a<-table.element(a,'T-STAT',header=TRUE)
a<-table.element(a,'P-value',header=TRUE)
a<-table.row.end(a)
for (i in 2:(par1+1)) {
a<-table.row.start(a)
a<-table.element(a,i-1,header=TRUE)
a<-table.element(a,round(myacf[i],6))
mytstat <- myacf[i]*sqrtn
a<-table.element(a,round(mytstat,4))
a<-table.element(a,round(1-pt(abs(mytstat),lengthx),6))
a<-table.row.end(a)
}
a<-table.end(a)
table.save(a,file='mytable.tab')
a<-table.start()
a<-table.row.start(a)
a<-table.element(a,'Partial Autocorrelation Function',4,TRUE)
a<-table.row.end(a)
a<-table.row.start(a)
a<-table.element(a,'Time lag k',header=TRUE)
a<-table.element(a,'PACF(k)',header=TRUE)
a<-table.element(a,'T-STAT',header=TRUE)
a<-table.element(a,'P-value',header=TRUE)
a<-table.row.end(a)
for (i in 1:par1) {
a<-table.row.start(a)
a<-table.element(a,i,header=TRUE)
a<-table.element(a,round(mypacf[i],6))
mytstat <- mypacf[i]*sqrtn
a<-table.element(a,round(mytstat,4))
a<-table.element(a,round(1-pt(abs(mytstat),lengthx),6))
a<-table.row.end(a)
}
a<-table.end(a)
table.save(a,file='mytable1.tab')