Free Statistics

of Irreproducible Research!

Author's title

Author*The author of this computation has been verified*
R Software Modulerwasp_autocorrelation.wasp
Title produced by software(Partial) Autocorrelation Function
Date of computationTue, 12 Dec 2017 14:29:20 +0100
Cite this page as followsStatistical Computations at FreeStatistics.org, Office for Research Development and Education, URL https://freestatistics.org/blog/index.php?v=date/2017/Dec/12/t1513085377joahkd1tt6fqzha.htm/, Retrieved Wed, 15 May 2024 15:52:50 +0000
Statistical Computations at FreeStatistics.org, Office for Research Development and Education, URL https://freestatistics.org/blog/index.php?pk=309075, Retrieved Wed, 15 May 2024 15:52:50 +0000
QR Codes:

Original text written by user:
IsPrivate?No (this computation is public)
User-defined keywordsLBE
Estimated Impact69
Family? (F = Feedback message, R = changed R code, M = changed R Module, P = changed Parameters, D = changed Data)
-       [(Partial) Autocorrelation Function] [Partial correlati...] [2017-12-12 13:29:20] [3c189a0c4f7caff37e2cfca896353419] [Current]
Feedback Forum

Post a new message
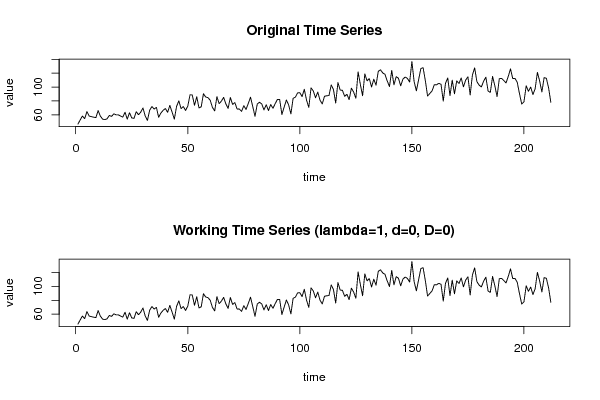
Dataseries X:
46.8
52.8
58.3
54.5
64.7
58.3
57.5
56.7
56
66.2
58.2
53.9
53.1
54.4
59.2
57.8
61.5
60.1
60.1
58.4
56.8
63.8
53.9
63.1
55.7
54.9
64.6
60.2
63.9
69.9
58.5
52
66.7
72
68.4
70.8
56.5
62.6
66.5
69.2
63.7
73.6
64.1
53.8
72.2
80.2
69.1
72
66.3
72.5
88.9
88.6
73.7
86
70
71.6
90.5
85.7
84.8
81.1
70.8
65.7
86.2
76.1
79.8
85.2
75.8
69.4
85
75
77.7
68.5
68.4
65
73.2
67.9
76.5
85.5
71.7
57.9
75.5
78.2
75.7
67.1
74.6
66.2
74.9
69.5
76.1
82.3
82.1
60.5
71.2
81.4
74.5
61.4
83.8
85.4
91.6
91.9
86.3
96.8
81
70.8
98.8
94.5
84.5
92.8
81.2
75.7
86.7
87.5
87.8
103.1
96.4
77.1
106.5
95.7
95.3
86.6
89.6
81.9
98.4
92.9
83.9
121.8
103.9
87.5
118.9
109
112.2
100.1
111.3
102.7
122.6
124.8
120.3
118.3
108.7
100.7
124
103.1
115
112.7
101.7
111.5
114.4
112.5
107.2
136.7
107.8
94.6
110.7
126.6
127.9
109.2
87.1
90.8
94.5
103.3
103.2
105.4
103.9
79.8
105.6
113
87.7
110
90.3
108.9
105.1
113
100.4
110.1
114.7
88.6
117.2
127.7
107.8
102.8
100.2
108.4
114.2
94.4
92.2
115.3
102
86.3
112
112.5
109.5
105.9
115.3
126.2
112.2
112.5
106.9
90.6
75.6
78.8
101.8
93.9
100
89.2
97.7
121.1
108.8
92.9
113.6
112.6
98.8
78


Summary of computational transaction
Raw Input view raw input (R code)
Raw Outputview raw output of R engine
Computing time1 seconds
R ServerBig Analytics Cloud Computing Center

\begin{tabular}{lllllllll}
\hline
Summary of computational transaction \tabularnewline
Raw Input view raw input (R code)  \tabularnewline
Raw Outputview raw output of R engine  \tabularnewline
Computing time1 seconds \tabularnewline
R ServerBig Analytics Cloud Computing Center \tabularnewline
\hline
\end{tabular}
%Source: https://freestatistics.org/blog/index.php?pk=309075&T=0

[TABLE]
[ROW]
Summary of computational transaction[/C][/ROW] [ROW]Raw Input[/C] view raw input (R code) [/C][/ROW] [ROW]Raw Output[/C]view raw output of R engine [/C][/ROW] [ROW]Computing time[/C]1 seconds[/C][/ROW] [ROW]R Server[/C]Big Analytics Cloud Computing Center[/C][/ROW] [/TABLE] Source: https://freestatistics.org/blog/index.php?pk=309075&T=0

Globally Unique Identifier (entire table): ba.freestatistics.org/blog/index.php?pk=309075&T=0

As an alternative you can also use a QR Code:  

The GUIDs for individual cells are displayed in the table below:

Summary of computational transaction
Raw Input view raw input (R code)
Raw Outputview raw output of R engine
Computing time1 seconds
R ServerBig Analytics Cloud Computing Center


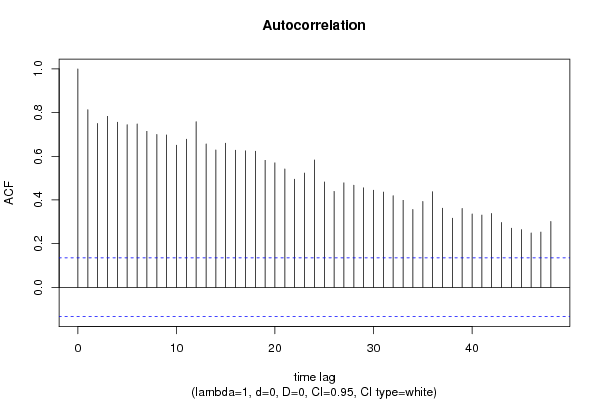
Autocorrelation Function
Time lag kACF(k)T-STATP-value
10.81294211.83660
20.74984510.91790
30.78270711.39640
40.75588411.00580
50.7446310.8420
60.74792910.890
70.7140410.39660
80.6994510.18410
90.69715710.15080
100.6507879.47560
110.6782219.87510
120.75799811.03660
130.6562949.55580
140.628819.15560
150.6595779.60360
160.6278279.14130
170.6246529.09510
180.6229169.06980
190.5812598.46330
200.5698498.29710
210.5415557.88520
220.4950647.20820
230.5228377.61260
240.5829478.48780
250.4824337.02430
260.4390916.39330
270.4781356.96180
280.4672126.80270
290.4553276.62970
300.4444216.47090
310.4358966.34670
320.4193856.10630
330.3979815.79470
340.3565795.19190
350.3926185.71660
360.437386.36840
370.361865.26880
380.3164724.60794e-06
390.3610515.2570
400.3352884.88191e-06
410.3303954.81061e-06
420.3376374.91611e-06
430.2970334.32491.2e-05
440.270323.93595.6e-05
450.2641753.84647.9e-05
460.2489173.62430.000181
470.2527863.68060.000148
480.3013414.38769e-06

\begin{tabular}{lllllllll}
\hline
Autocorrelation Function \tabularnewline
Time lag k & ACF(k) & T-STAT & P-value \tabularnewline
1 & 0.812942 & 11.8366 & 0 \tabularnewline
2 & 0.749845 & 10.9179 & 0 \tabularnewline
3 & 0.782707 & 11.3964 & 0 \tabularnewline
4 & 0.755884 & 11.0058 & 0 \tabularnewline
5 & 0.74463 & 10.842 & 0 \tabularnewline
6 & 0.747929 & 10.89 & 0 \tabularnewline
7 & 0.71404 & 10.3966 & 0 \tabularnewline
8 & 0.69945 & 10.1841 & 0 \tabularnewline
9 & 0.697157 & 10.1508 & 0 \tabularnewline
10 & 0.650787 & 9.4756 & 0 \tabularnewline
11 & 0.678221 & 9.8751 & 0 \tabularnewline
12 & 0.757998 & 11.0366 & 0 \tabularnewline
13 & 0.656294 & 9.5558 & 0 \tabularnewline
14 & 0.62881 & 9.1556 & 0 \tabularnewline
15 & 0.659577 & 9.6036 & 0 \tabularnewline
16 & 0.627827 & 9.1413 & 0 \tabularnewline
17 & 0.624652 & 9.0951 & 0 \tabularnewline
18 & 0.622916 & 9.0698 & 0 \tabularnewline
19 & 0.581259 & 8.4633 & 0 \tabularnewline
20 & 0.569849 & 8.2971 & 0 \tabularnewline
21 & 0.541555 & 7.8852 & 0 \tabularnewline
22 & 0.495064 & 7.2082 & 0 \tabularnewline
23 & 0.522837 & 7.6126 & 0 \tabularnewline
24 & 0.582947 & 8.4878 & 0 \tabularnewline
25 & 0.482433 & 7.0243 & 0 \tabularnewline
26 & 0.439091 & 6.3933 & 0 \tabularnewline
27 & 0.478135 & 6.9618 & 0 \tabularnewline
28 & 0.467212 & 6.8027 & 0 \tabularnewline
29 & 0.455327 & 6.6297 & 0 \tabularnewline
30 & 0.444421 & 6.4709 & 0 \tabularnewline
31 & 0.435896 & 6.3467 & 0 \tabularnewline
32 & 0.419385 & 6.1063 & 0 \tabularnewline
33 & 0.397981 & 5.7947 & 0 \tabularnewline
34 & 0.356579 & 5.1919 & 0 \tabularnewline
35 & 0.392618 & 5.7166 & 0 \tabularnewline
36 & 0.43738 & 6.3684 & 0 \tabularnewline
37 & 0.36186 & 5.2688 & 0 \tabularnewline
38 & 0.316472 & 4.6079 & 4e-06 \tabularnewline
39 & 0.361051 & 5.257 & 0 \tabularnewline
40 & 0.335288 & 4.8819 & 1e-06 \tabularnewline
41 & 0.330395 & 4.8106 & 1e-06 \tabularnewline
42 & 0.337637 & 4.9161 & 1e-06 \tabularnewline
43 & 0.297033 & 4.3249 & 1.2e-05 \tabularnewline
44 & 0.27032 & 3.9359 & 5.6e-05 \tabularnewline
45 & 0.264175 & 3.8464 & 7.9e-05 \tabularnewline
46 & 0.248917 & 3.6243 & 0.000181 \tabularnewline
47 & 0.252786 & 3.6806 & 0.000148 \tabularnewline
48 & 0.301341 & 4.3876 & 9e-06 \tabularnewline
\hline
\end{tabular}
%Source: https://freestatistics.org/blog/index.php?pk=309075&T=1

[TABLE]
[ROW][C]Autocorrelation Function[/C][/ROW]
[ROW][C]Time lag k[/C][C]ACF(k)[/C][C]T-STAT[/C][C]P-value[/C][/ROW]
[ROW][C]1[/C][C]0.812942[/C][C]11.8366[/C][C]0[/C][/ROW]
[ROW][C]2[/C][C]0.749845[/C][C]10.9179[/C][C]0[/C][/ROW]
[ROW][C]3[/C][C]0.782707[/C][C]11.3964[/C][C]0[/C][/ROW]
[ROW][C]4[/C][C]0.755884[/C][C]11.0058[/C][C]0[/C][/ROW]
[ROW][C]5[/C][C]0.74463[/C][C]10.842[/C][C]0[/C][/ROW]
[ROW][C]6[/C][C]0.747929[/C][C]10.89[/C][C]0[/C][/ROW]
[ROW][C]7[/C][C]0.71404[/C][C]10.3966[/C][C]0[/C][/ROW]
[ROW][C]8[/C][C]0.69945[/C][C]10.1841[/C][C]0[/C][/ROW]
[ROW][C]9[/C][C]0.697157[/C][C]10.1508[/C][C]0[/C][/ROW]
[ROW][C]10[/C][C]0.650787[/C][C]9.4756[/C][C]0[/C][/ROW]
[ROW][C]11[/C][C]0.678221[/C][C]9.8751[/C][C]0[/C][/ROW]
[ROW][C]12[/C][C]0.757998[/C][C]11.0366[/C][C]0[/C][/ROW]
[ROW][C]13[/C][C]0.656294[/C][C]9.5558[/C][C]0[/C][/ROW]
[ROW][C]14[/C][C]0.62881[/C][C]9.1556[/C][C]0[/C][/ROW]
[ROW][C]15[/C][C]0.659577[/C][C]9.6036[/C][C]0[/C][/ROW]
[ROW][C]16[/C][C]0.627827[/C][C]9.1413[/C][C]0[/C][/ROW]
[ROW][C]17[/C][C]0.624652[/C][C]9.0951[/C][C]0[/C][/ROW]
[ROW][C]18[/C][C]0.622916[/C][C]9.0698[/C][C]0[/C][/ROW]
[ROW][C]19[/C][C]0.581259[/C][C]8.4633[/C][C]0[/C][/ROW]
[ROW][C]20[/C][C]0.569849[/C][C]8.2971[/C][C]0[/C][/ROW]
[ROW][C]21[/C][C]0.541555[/C][C]7.8852[/C][C]0[/C][/ROW]
[ROW][C]22[/C][C]0.495064[/C][C]7.2082[/C][C]0[/C][/ROW]
[ROW][C]23[/C][C]0.522837[/C][C]7.6126[/C][C]0[/C][/ROW]
[ROW][C]24[/C][C]0.582947[/C][C]8.4878[/C][C]0[/C][/ROW]
[ROW][C]25[/C][C]0.482433[/C][C]7.0243[/C][C]0[/C][/ROW]
[ROW][C]26[/C][C]0.439091[/C][C]6.3933[/C][C]0[/C][/ROW]
[ROW][C]27[/C][C]0.478135[/C][C]6.9618[/C][C]0[/C][/ROW]
[ROW][C]28[/C][C]0.467212[/C][C]6.8027[/C][C]0[/C][/ROW]
[ROW][C]29[/C][C]0.455327[/C][C]6.6297[/C][C]0[/C][/ROW]
[ROW][C]30[/C][C]0.444421[/C][C]6.4709[/C][C]0[/C][/ROW]
[ROW][C]31[/C][C]0.435896[/C][C]6.3467[/C][C]0[/C][/ROW]
[ROW][C]32[/C][C]0.419385[/C][C]6.1063[/C][C]0[/C][/ROW]
[ROW][C]33[/C][C]0.397981[/C][C]5.7947[/C][C]0[/C][/ROW]
[ROW][C]34[/C][C]0.356579[/C][C]5.1919[/C][C]0[/C][/ROW]
[ROW][C]35[/C][C]0.392618[/C][C]5.7166[/C][C]0[/C][/ROW]
[ROW][C]36[/C][C]0.43738[/C][C]6.3684[/C][C]0[/C][/ROW]
[ROW][C]37[/C][C]0.36186[/C][C]5.2688[/C][C]0[/C][/ROW]
[ROW][C]38[/C][C]0.316472[/C][C]4.6079[/C][C]4e-06[/C][/ROW]
[ROW][C]39[/C][C]0.361051[/C][C]5.257[/C][C]0[/C][/ROW]
[ROW][C]40[/C][C]0.335288[/C][C]4.8819[/C][C]1e-06[/C][/ROW]
[ROW][C]41[/C][C]0.330395[/C][C]4.8106[/C][C]1e-06[/C][/ROW]
[ROW][C]42[/C][C]0.337637[/C][C]4.9161[/C][C]1e-06[/C][/ROW]
[ROW][C]43[/C][C]0.297033[/C][C]4.3249[/C][C]1.2e-05[/C][/ROW]
[ROW][C]44[/C][C]0.27032[/C][C]3.9359[/C][C]5.6e-05[/C][/ROW]
[ROW][C]45[/C][C]0.264175[/C][C]3.8464[/C][C]7.9e-05[/C][/ROW]
[ROW][C]46[/C][C]0.248917[/C][C]3.6243[/C][C]0.000181[/C][/ROW]
[ROW][C]47[/C][C]0.252786[/C][C]3.6806[/C][C]0.000148[/C][/ROW]
[ROW][C]48[/C][C]0.301341[/C][C]4.3876[/C][C]9e-06[/C][/ROW]
[/TABLE]
Source: https://freestatistics.org/blog/index.php?pk=309075&T=1

Globally Unique Identifier (entire table): ba.freestatistics.org/blog/index.php?pk=309075&T=1

As an alternative you can also use a QR Code:  

The GUIDs for individual cells are displayed in the table below:

Autocorrelation Function
Time lag kACF(k)T-STATP-value
10.81294211.83660
20.74984510.91790
30.78270711.39640
40.75588411.00580
50.7446310.8420
60.74792910.890
70.7140410.39660
80.6994510.18410
90.69715710.15080
100.6507879.47560
110.6782219.87510
120.75799811.03660
130.6562949.55580
140.628819.15560
150.6595779.60360
160.6278279.14130
170.6246529.09510
180.6229169.06980
190.5812598.46330
200.5698498.29710
210.5415557.88520
220.4950647.20820
230.5228377.61260
240.5829478.48780
250.4824337.02430
260.4390916.39330
270.4781356.96180
280.4672126.80270
290.4553276.62970
300.4444216.47090
310.4358966.34670
320.4193856.10630
330.3979815.79470
340.3565795.19190
350.3926185.71660
360.437386.36840
370.361865.26880
380.3164724.60794e-06
390.3610515.2570
400.3352884.88191e-06
410.3303954.81061e-06
420.3376374.91611e-06
430.2970334.32491.2e-05
440.270323.93595.6e-05
450.2641753.84647.9e-05
460.2489173.62430.000181
470.2527863.68060.000148
480.3013414.38769e-06


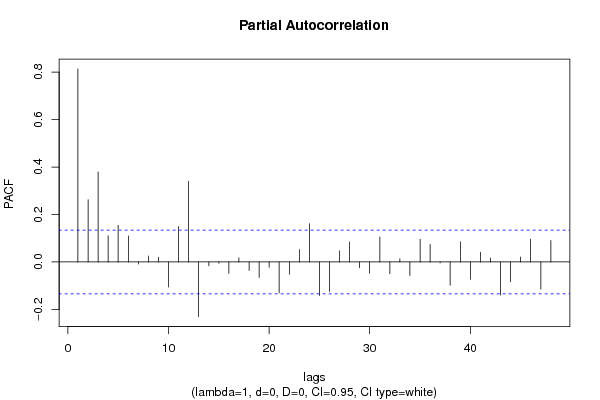
Partial Autocorrelation Function
Time lag kPACF(k)T-STATP-value
10.81294211.83660
20.2623533.81998.8e-05
30.3792895.52250
40.1105691.60990.054453
50.1540622.24320.01296
60.1097351.59780.055793
7-0.008216-0.11960.452447
80.024950.36330.358381
90.0194070.28260.388893
10-0.105433-1.53510.063121
110.1497352.18020.015173
120.3403374.95541e-06
13-0.230237-3.35230.000474
14-0.015715-0.22880.409617
15-0.005333-0.07760.469091
16-0.048144-0.7010.242039
170.0177130.25790.398363
18-0.035302-0.5140.303894
19-0.065017-0.94670.172445
20-0.022118-0.3220.373869
21-0.130237-1.89630.029641
22-0.051192-0.74540.228437
230.0521810.75980.224121
240.1607032.33990.01011
25-0.141076-2.05410.020596
26-0.124653-1.8150.03547
270.0468770.68250.24782
280.0844061.2290.110224
29-0.02424-0.35290.36224
30-0.047278-0.68840.245983
310.1051391.53080.06365
32-0.049279-0.71750.236922
330.0130330.18980.42484
34-0.05646-0.82210.205982
350.0956611.39280.082563
360.0735281.07060.142786
37-0.003821-0.05560.477842
38-0.098276-1.43090.076962
390.0848681.23570.108969
40-0.07307-1.06390.144288
410.0412950.60130.274155
420.0165250.24060.405048
43-0.139264-2.02770.02192
44-0.083301-1.21290.113264
450.0204890.29830.382874
460.0959951.39770.08183
47-0.114437-1.66620.048572
480.09071.32060.094027

\begin{tabular}{lllllllll}
\hline
Partial Autocorrelation Function \tabularnewline
Time lag k & PACF(k) & T-STAT & P-value \tabularnewline
1 & 0.812942 & 11.8366 & 0 \tabularnewline
2 & 0.262353 & 3.8199 & 8.8e-05 \tabularnewline
3 & 0.379289 & 5.5225 & 0 \tabularnewline
4 & 0.110569 & 1.6099 & 0.054453 \tabularnewline
5 & 0.154062 & 2.2432 & 0.01296 \tabularnewline
6 & 0.109735 & 1.5978 & 0.055793 \tabularnewline
7 & -0.008216 & -0.1196 & 0.452447 \tabularnewline
8 & 0.02495 & 0.3633 & 0.358381 \tabularnewline
9 & 0.019407 & 0.2826 & 0.388893 \tabularnewline
10 & -0.105433 & -1.5351 & 0.063121 \tabularnewline
11 & 0.149735 & 2.1802 & 0.015173 \tabularnewline
12 & 0.340337 & 4.9554 & 1e-06 \tabularnewline
13 & -0.230237 & -3.3523 & 0.000474 \tabularnewline
14 & -0.015715 & -0.2288 & 0.409617 \tabularnewline
15 & -0.005333 & -0.0776 & 0.469091 \tabularnewline
16 & -0.048144 & -0.701 & 0.242039 \tabularnewline
17 & 0.017713 & 0.2579 & 0.398363 \tabularnewline
18 & -0.035302 & -0.514 & 0.303894 \tabularnewline
19 & -0.065017 & -0.9467 & 0.172445 \tabularnewline
20 & -0.022118 & -0.322 & 0.373869 \tabularnewline
21 & -0.130237 & -1.8963 & 0.029641 \tabularnewline
22 & -0.051192 & -0.7454 & 0.228437 \tabularnewline
23 & 0.052181 & 0.7598 & 0.224121 \tabularnewline
24 & 0.160703 & 2.3399 & 0.01011 \tabularnewline
25 & -0.141076 & -2.0541 & 0.020596 \tabularnewline
26 & -0.124653 & -1.815 & 0.03547 \tabularnewline
27 & 0.046877 & 0.6825 & 0.24782 \tabularnewline
28 & 0.084406 & 1.229 & 0.110224 \tabularnewline
29 & -0.02424 & -0.3529 & 0.36224 \tabularnewline
30 & -0.047278 & -0.6884 & 0.245983 \tabularnewline
31 & 0.105139 & 1.5308 & 0.06365 \tabularnewline
32 & -0.049279 & -0.7175 & 0.236922 \tabularnewline
33 & 0.013033 & 0.1898 & 0.42484 \tabularnewline
34 & -0.05646 & -0.8221 & 0.205982 \tabularnewline
35 & 0.095661 & 1.3928 & 0.082563 \tabularnewline
36 & 0.073528 & 1.0706 & 0.142786 \tabularnewline
37 & -0.003821 & -0.0556 & 0.477842 \tabularnewline
38 & -0.098276 & -1.4309 & 0.076962 \tabularnewline
39 & 0.084868 & 1.2357 & 0.108969 \tabularnewline
40 & -0.07307 & -1.0639 & 0.144288 \tabularnewline
41 & 0.041295 & 0.6013 & 0.274155 \tabularnewline
42 & 0.016525 & 0.2406 & 0.405048 \tabularnewline
43 & -0.139264 & -2.0277 & 0.02192 \tabularnewline
44 & -0.083301 & -1.2129 & 0.113264 \tabularnewline
45 & 0.020489 & 0.2983 & 0.382874 \tabularnewline
46 & 0.095995 & 1.3977 & 0.08183 \tabularnewline
47 & -0.114437 & -1.6662 & 0.048572 \tabularnewline
48 & 0.0907 & 1.3206 & 0.094027 \tabularnewline
\hline
\end{tabular}
%Source: https://freestatistics.org/blog/index.php?pk=309075&T=2

[TABLE]
[ROW][C]Partial Autocorrelation Function[/C][/ROW]
[ROW][C]Time lag k[/C][C]PACF(k)[/C][C]T-STAT[/C][C]P-value[/C][/ROW]
[ROW][C]1[/C][C]0.812942[/C][C]11.8366[/C][C]0[/C][/ROW]
[ROW][C]2[/C][C]0.262353[/C][C]3.8199[/C][C]8.8e-05[/C][/ROW]
[ROW][C]3[/C][C]0.379289[/C][C]5.5225[/C][C]0[/C][/ROW]
[ROW][C]4[/C][C]0.110569[/C][C]1.6099[/C][C]0.054453[/C][/ROW]
[ROW][C]5[/C][C]0.154062[/C][C]2.2432[/C][C]0.01296[/C][/ROW]
[ROW][C]6[/C][C]0.109735[/C][C]1.5978[/C][C]0.055793[/C][/ROW]
[ROW][C]7[/C][C]-0.008216[/C][C]-0.1196[/C][C]0.452447[/C][/ROW]
[ROW][C]8[/C][C]0.02495[/C][C]0.3633[/C][C]0.358381[/C][/ROW]
[ROW][C]9[/C][C]0.019407[/C][C]0.2826[/C][C]0.388893[/C][/ROW]
[ROW][C]10[/C][C]-0.105433[/C][C]-1.5351[/C][C]0.063121[/C][/ROW]
[ROW][C]11[/C][C]0.149735[/C][C]2.1802[/C][C]0.015173[/C][/ROW]
[ROW][C]12[/C][C]0.340337[/C][C]4.9554[/C][C]1e-06[/C][/ROW]
[ROW][C]13[/C][C]-0.230237[/C][C]-3.3523[/C][C]0.000474[/C][/ROW]
[ROW][C]14[/C][C]-0.015715[/C][C]-0.2288[/C][C]0.409617[/C][/ROW]
[ROW][C]15[/C][C]-0.005333[/C][C]-0.0776[/C][C]0.469091[/C][/ROW]
[ROW][C]16[/C][C]-0.048144[/C][C]-0.701[/C][C]0.242039[/C][/ROW]
[ROW][C]17[/C][C]0.017713[/C][C]0.2579[/C][C]0.398363[/C][/ROW]
[ROW][C]18[/C][C]-0.035302[/C][C]-0.514[/C][C]0.303894[/C][/ROW]
[ROW][C]19[/C][C]-0.065017[/C][C]-0.9467[/C][C]0.172445[/C][/ROW]
[ROW][C]20[/C][C]-0.022118[/C][C]-0.322[/C][C]0.373869[/C][/ROW]
[ROW][C]21[/C][C]-0.130237[/C][C]-1.8963[/C][C]0.029641[/C][/ROW]
[ROW][C]22[/C][C]-0.051192[/C][C]-0.7454[/C][C]0.228437[/C][/ROW]
[ROW][C]23[/C][C]0.052181[/C][C]0.7598[/C][C]0.224121[/C][/ROW]
[ROW][C]24[/C][C]0.160703[/C][C]2.3399[/C][C]0.01011[/C][/ROW]
[ROW][C]25[/C][C]-0.141076[/C][C]-2.0541[/C][C]0.020596[/C][/ROW]
[ROW][C]26[/C][C]-0.124653[/C][C]-1.815[/C][C]0.03547[/C][/ROW]
[ROW][C]27[/C][C]0.046877[/C][C]0.6825[/C][C]0.24782[/C][/ROW]
[ROW][C]28[/C][C]0.084406[/C][C]1.229[/C][C]0.110224[/C][/ROW]
[ROW][C]29[/C][C]-0.02424[/C][C]-0.3529[/C][C]0.36224[/C][/ROW]
[ROW][C]30[/C][C]-0.047278[/C][C]-0.6884[/C][C]0.245983[/C][/ROW]
[ROW][C]31[/C][C]0.105139[/C][C]1.5308[/C][C]0.06365[/C][/ROW]
[ROW][C]32[/C][C]-0.049279[/C][C]-0.7175[/C][C]0.236922[/C][/ROW]
[ROW][C]33[/C][C]0.013033[/C][C]0.1898[/C][C]0.42484[/C][/ROW]
[ROW][C]34[/C][C]-0.05646[/C][C]-0.8221[/C][C]0.205982[/C][/ROW]
[ROW][C]35[/C][C]0.095661[/C][C]1.3928[/C][C]0.082563[/C][/ROW]
[ROW][C]36[/C][C]0.073528[/C][C]1.0706[/C][C]0.142786[/C][/ROW]
[ROW][C]37[/C][C]-0.003821[/C][C]-0.0556[/C][C]0.477842[/C][/ROW]
[ROW][C]38[/C][C]-0.098276[/C][C]-1.4309[/C][C]0.076962[/C][/ROW]
[ROW][C]39[/C][C]0.084868[/C][C]1.2357[/C][C]0.108969[/C][/ROW]
[ROW][C]40[/C][C]-0.07307[/C][C]-1.0639[/C][C]0.144288[/C][/ROW]
[ROW][C]41[/C][C]0.041295[/C][C]0.6013[/C][C]0.274155[/C][/ROW]
[ROW][C]42[/C][C]0.016525[/C][C]0.2406[/C][C]0.405048[/C][/ROW]
[ROW][C]43[/C][C]-0.139264[/C][C]-2.0277[/C][C]0.02192[/C][/ROW]
[ROW][C]44[/C][C]-0.083301[/C][C]-1.2129[/C][C]0.113264[/C][/ROW]
[ROW][C]45[/C][C]0.020489[/C][C]0.2983[/C][C]0.382874[/C][/ROW]
[ROW][C]46[/C][C]0.095995[/C][C]1.3977[/C][C]0.08183[/C][/ROW]
[ROW][C]47[/C][C]-0.114437[/C][C]-1.6662[/C][C]0.048572[/C][/ROW]
[ROW][C]48[/C][C]0.0907[/C][C]1.3206[/C][C]0.094027[/C][/ROW]
[/TABLE]
Source: https://freestatistics.org/blog/index.php?pk=309075&T=2

Globally Unique Identifier (entire table): ba.freestatistics.org/blog/index.php?pk=309075&T=2

As an alternative you can also use a QR Code:  

The GUIDs for individual cells are displayed in the table below:

Partial Autocorrelation Function
Time lag kPACF(k)T-STATP-value
10.81294211.83660
20.2623533.81998.8e-05
30.3792895.52250
40.1105691.60990.054453
50.1540622.24320.01296
60.1097351.59780.055793
7-0.008216-0.11960.452447
80.024950.36330.358381
90.0194070.28260.388893
10-0.105433-1.53510.063121
110.1497352.18020.015173
120.3403374.95541e-06
13-0.230237-3.35230.000474
14-0.015715-0.22880.409617
15-0.005333-0.07760.469091
16-0.048144-0.7010.242039
170.0177130.25790.398363
18-0.035302-0.5140.303894
19-0.065017-0.94670.172445
20-0.022118-0.3220.373869
21-0.130237-1.89630.029641
22-0.051192-0.74540.228437
230.0521810.75980.224121
240.1607032.33990.01011
25-0.141076-2.05410.020596
26-0.124653-1.8150.03547
270.0468770.68250.24782
280.0844061.2290.110224
29-0.02424-0.35290.36224
30-0.047278-0.68840.245983
310.1051391.53080.06365
32-0.049279-0.71750.236922
330.0130330.18980.42484
34-0.05646-0.82210.205982
350.0956611.39280.082563
360.0735281.07060.142786
37-0.003821-0.05560.477842
38-0.098276-1.43090.076962
390.0848681.23570.108969
40-0.07307-1.06390.144288
410.0412950.60130.274155
420.0165250.24060.405048
43-0.139264-2.02770.02192
44-0.083301-1.21290.113264
450.0204890.29830.382874
460.0959951.39770.08183
47-0.114437-1.66620.048572
480.09071.32060.094027


Parameters (Session):
par1 = 1 ; par2 = 1 ; par3 = 1 ; par4 = 12 ;
Parameters (R input):
par1 = 48 ; par2 = 1 ; par3 = 0 ; par4 = 0 ; par5 = 12 ; par6 = White Noise ; par7 = 0.95 ; par8 = ;
R code (references can be found in the software module):
par8 <- ''
par7 <- ''
par6 <- 'White Noise'
par5 <- '12'
par4 <- '0'
par3 <- '0'
par2 <- '1'
par1 <- '48'
if (par1 == 'Default') {
par1 = 10*log10(length(x))
} else {
par1 <- as.numeric(par1)
}
par2 <- as.numeric(par2)
par3 <- as.numeric(par3)
par4 <- as.numeric(par4)
par5 <- as.numeric(par5)
if (par6 == 'White Noise') par6 <- 'white' else par6 <- 'ma'
par7 <- as.numeric(par7)
if (par8 != '') par8 <- as.numeric(par8)
x <- na.omit(x)
ox <- x
if (par8 == '') {
if (par2 == 0) {
x <- log(x)
} else {
x <- (x ^ par2 - 1) / par2
}
} else {
x <- log(x,base=par8)
}
if (par3 > 0) x <- diff(x,lag=1,difference=par3)
if (par4 > 0) x <- diff(x,lag=par5,difference=par4)
bitmap(file='picts.png')
op <- par(mfrow=c(2,1))
plot(ox,type='l',main='Original Time Series',xlab='time',ylab='value')
if (par8=='') {
mytitle <- paste('Working Time Series (lambda=',par2,', d=',par3,', D=',par4,')',sep='')
mysub <- paste('(lambda=',par2,', d=',par3,', D=',par4,', CI=', par7, ', CI type=',par6,')',sep='')
} else {
mytitle <- paste('Working Time Series (base=',par8,', d=',par3,', D=',par4,')',sep='')
mysub <- paste('(base=',par8,', d=',par3,', D=',par4,', CI=', par7, ', CI type=',par6,')',sep='')
}
plot(x,type='l', main=mytitle,xlab='time',ylab='value')
par(op)
dev.off()
bitmap(file='pic1.png')
racf <- acf(x, par1, main='Autocorrelation', xlab='time lag', ylab='ACF', ci.type=par6, ci=par7, sub=mysub)
dev.off()
bitmap(file='pic2.png')
rpacf <- pacf(x,par1,main='Partial Autocorrelation',xlab='lags',ylab='PACF',sub=mysub)
dev.off()
(myacf <- c(racf$acf))
(mypacf <- c(rpacf$acf))
lengthx <- length(x)
sqrtn <- sqrt(lengthx)
load(file='createtable')
a<-table.start()
a<-table.row.start(a)
a<-table.element(a,'Autocorrelation Function',4,TRUE)
a<-table.row.end(a)
a<-table.row.start(a)
a<-table.element(a,'Time lag k',header=TRUE)
a<-table.element(a,'ACF(k)',header=TRUE)
a<-table.element(a,'T-STAT',header=TRUE)
a<-table.element(a,'P-value',header=TRUE)
a<-table.row.end(a)
for (i in 2:(par1+1)) {
a<-table.row.start(a)
a<-table.element(a,i-1,header=TRUE)
a<-table.element(a,round(myacf[i],6))
mytstat <- myacf[i]*sqrtn
a<-table.element(a,round(mytstat,4))
a<-table.element(a,round(1-pt(abs(mytstat),lengthx),6))
a<-table.row.end(a)
}
a<-table.end(a)
table.save(a,file='mytable.tab')
a<-table.start()
a<-table.row.start(a)
a<-table.element(a,'Partial Autocorrelation Function',4,TRUE)
a<-table.row.end(a)
a<-table.row.start(a)
a<-table.element(a,'Time lag k',header=TRUE)
a<-table.element(a,'PACF(k)',header=TRUE)
a<-table.element(a,'T-STAT',header=TRUE)
a<-table.element(a,'P-value',header=TRUE)
a<-table.row.end(a)
for (i in 1:par1) {
a<-table.row.start(a)
a<-table.element(a,i,header=TRUE)
a<-table.element(a,round(mypacf[i],6))
mytstat <- mypacf[i]*sqrtn
a<-table.element(a,round(mytstat,4))
a<-table.element(a,round(1-pt(abs(mytstat),lengthx),6))
a<-table.row.end(a)
}
a<-table.end(a)
table.save(a,file='mytable1.tab')