Free Statistics

of Irreproducible Research!

Author's title

Author*The author of this computation has been verified*
R Software Modulerwasp_autocorrelation.wasp
Title produced by software(Partial) Autocorrelation Function
Date of computationTue, 12 Dec 2017 14:27:47 +0100
Cite this page as followsStatistical Computations at FreeStatistics.org, Office for Research Development and Education, URL https://freestatistics.org/blog/index.php?v=date/2017/Dec/12/t1513085373zalls565r7pmu9g.htm/, Retrieved Wed, 15 May 2024 23:07:20 +0000
Statistical Computations at FreeStatistics.org, Office for Research Development and Education, URL https://freestatistics.org/blog/index.php?pk=309074, Retrieved Wed, 15 May 2024 23:07:20 +0000
QR Codes:

Original text written by user:Textile, and wearing apparel, ...
IsPrivate?No (this computation is public)
User-defined keywordsDataset 3
Estimated Impact73
Family? (F = Feedback message, R = changed R code, M = changed R Module, P = changed Parameters, D = changed Data)
-       [(Partial) Autocorrelation Function] [Partial Autocorre...] [2017-12-12 13:27:47] [79eb5143bcf363cf12f20cb866038ece] [Current]
Feedback Forum

Post a new message
Dataseries X:
122,2
136,1
145,5
116,7
137,1
125,5
112,4
106,3
145,7
151,5
144,6
116,4
137,7
138,8
149,5
125
133,4
134,4
124,8
110,6
142,4
149,6
134,6
103,3
136,5
137,1
140,7
131,4
126,2
125,3
126,6
107,7
144,5
154,2
131,4
105,7
136,2
133,3
130
129,3
113,1
117,7
116,3
97,3
140,6
141,2
120,8
106,2
121,5
122,6
137,2
118,9
107,2
127,4
111,8
100
138,3
128
121,2
105,9
112,5
123,1
129
115,5
105,7
122,3
106,4
101,1
131,6
119,5
127
106,9
115,9
122,7
137,2
108,5
115,2
129,4
112,3
104,3
140
139,9
134,9
105,1


Summary of computational transaction
Raw Input view raw input (R code)
Raw Outputview raw output of R engine
Computing time2 seconds
R ServerBig Analytics Cloud Computing Center

\begin{tabular}{lllllllll}
\hline
Summary of computational transaction \tabularnewline
Raw Input view raw input (R code)  \tabularnewline
Raw Outputview raw output of R engine  \tabularnewline
Computing time2 seconds \tabularnewline
R ServerBig Analytics Cloud Computing Center \tabularnewline
\hline
\end{tabular}
%Source: https://freestatistics.org/blog/index.php?pk=309074&T=0

[TABLE]
[ROW]
Summary of computational transaction[/C][/ROW] [ROW]Raw Input[/C] view raw input (R code) [/C][/ROW] [ROW]Raw Output[/C]view raw output of R engine [/C][/ROW] [ROW]Computing time[/C]2 seconds[/C][/ROW] [ROW]R Server[/C]Big Analytics Cloud Computing Center[/C][/ROW] [/TABLE] Source: https://freestatistics.org/blog/index.php?pk=309074&T=0

Globally Unique Identifier (entire table): ba.freestatistics.org/blog/index.php?pk=309074&T=0

As an alternative you can also use a QR Code:  

The GUIDs for individual cells are displayed in the table below:

Summary of computational transaction
Raw Input view raw input (R code)
Raw Outputview raw output of R engine
Computing time2 seconds
R ServerBig Analytics Cloud Computing Center


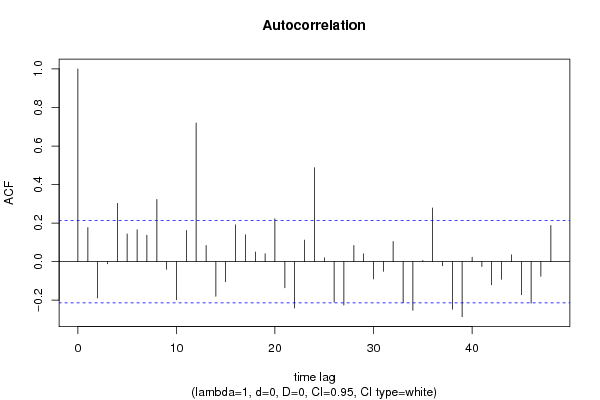
Autocorrelation Function
Time lag kACF(k)T-STATP-value
10.1766241.61880.054621
2-0.188523-1.72780.043846
3-0.011542-0.10580.458001
40.3021942.76970.003453
50.1434591.31480.096073
60.1654621.51650.066576
70.136541.25140.10713
80.3222852.95380.002035
9-0.039403-0.36110.359452
10-0.19822-1.81670.036413
110.161711.48210.071028
120.7199146.59810
130.0835460.76570.222997
14-0.180278-1.65230.051106
15-0.104595-0.95860.170248
160.1908931.74960.041923
170.1388331.27240.103366
180.0500920.45910.323675
190.0404960.37120.355729
200.2226982.04110.022192
21-0.135501-1.24190.108867
22-0.241097-2.20970.014924
230.1114311.02130.155027
240.487114.46441.2e-05
250.0192470.17640.430201
26-0.211104-1.93480.02819
27-0.22574-2.06890.020813
280.0837810.76790.222361
290.0403460.36980.35624
30-0.089719-0.82230.206619
31-0.049708-0.45560.324932
320.1042650.95560.171008
33-0.213084-1.95290.027078
34-0.252343-2.31280.011591
350.0056860.05210.479282
360.27852.55250.006252
37-0.021439-0.19650.422352
38-0.246622-2.26030.013194
39-0.285741-2.61890.005233
400.0224650.20590.418684
41-0.025182-0.23080.409016
42-0.119874-1.09870.137527
43-0.091853-0.84180.201132
440.0350350.32110.374466
45-0.172538-1.58130.058779
46-0.215411-1.97430.025818
47-0.075716-0.6940.244814
480.1878581.72170.044398

\begin{tabular}{lllllllll}
\hline
Autocorrelation Function \tabularnewline
Time lag k & ACF(k) & T-STAT & P-value \tabularnewline
1 & 0.176624 & 1.6188 & 0.054621 \tabularnewline
2 & -0.188523 & -1.7278 & 0.043846 \tabularnewline
3 & -0.011542 & -0.1058 & 0.458001 \tabularnewline
4 & 0.302194 & 2.7697 & 0.003453 \tabularnewline
5 & 0.143459 & 1.3148 & 0.096073 \tabularnewline
6 & 0.165462 & 1.5165 & 0.066576 \tabularnewline
7 & 0.13654 & 1.2514 & 0.10713 \tabularnewline
8 & 0.322285 & 2.9538 & 0.002035 \tabularnewline
9 & -0.039403 & -0.3611 & 0.359452 \tabularnewline
10 & -0.19822 & -1.8167 & 0.036413 \tabularnewline
11 & 0.16171 & 1.4821 & 0.071028 \tabularnewline
12 & 0.719914 & 6.5981 & 0 \tabularnewline
13 & 0.083546 & 0.7657 & 0.222997 \tabularnewline
14 & -0.180278 & -1.6523 & 0.051106 \tabularnewline
15 & -0.104595 & -0.9586 & 0.170248 \tabularnewline
16 & 0.190893 & 1.7496 & 0.041923 \tabularnewline
17 & 0.138833 & 1.2724 & 0.103366 \tabularnewline
18 & 0.050092 & 0.4591 & 0.323675 \tabularnewline
19 & 0.040496 & 0.3712 & 0.355729 \tabularnewline
20 & 0.222698 & 2.0411 & 0.022192 \tabularnewline
21 & -0.135501 & -1.2419 & 0.108867 \tabularnewline
22 & -0.241097 & -2.2097 & 0.014924 \tabularnewline
23 & 0.111431 & 1.0213 & 0.155027 \tabularnewline
24 & 0.48711 & 4.4644 & 1.2e-05 \tabularnewline
25 & 0.019247 & 0.1764 & 0.430201 \tabularnewline
26 & -0.211104 & -1.9348 & 0.02819 \tabularnewline
27 & -0.22574 & -2.0689 & 0.020813 \tabularnewline
28 & 0.083781 & 0.7679 & 0.222361 \tabularnewline
29 & 0.040346 & 0.3698 & 0.35624 \tabularnewline
30 & -0.089719 & -0.8223 & 0.206619 \tabularnewline
31 & -0.049708 & -0.4556 & 0.324932 \tabularnewline
32 & 0.104265 & 0.9556 & 0.171008 \tabularnewline
33 & -0.213084 & -1.9529 & 0.027078 \tabularnewline
34 & -0.252343 & -2.3128 & 0.011591 \tabularnewline
35 & 0.005686 & 0.0521 & 0.479282 \tabularnewline
36 & 0.2785 & 2.5525 & 0.006252 \tabularnewline
37 & -0.021439 & -0.1965 & 0.422352 \tabularnewline
38 & -0.246622 & -2.2603 & 0.013194 \tabularnewline
39 & -0.285741 & -2.6189 & 0.005233 \tabularnewline
40 & 0.022465 & 0.2059 & 0.418684 \tabularnewline
41 & -0.025182 & -0.2308 & 0.409016 \tabularnewline
42 & -0.119874 & -1.0987 & 0.137527 \tabularnewline
43 & -0.091853 & -0.8418 & 0.201132 \tabularnewline
44 & 0.035035 & 0.3211 & 0.374466 \tabularnewline
45 & -0.172538 & -1.5813 & 0.058779 \tabularnewline
46 & -0.215411 & -1.9743 & 0.025818 \tabularnewline
47 & -0.075716 & -0.694 & 0.244814 \tabularnewline
48 & 0.187858 & 1.7217 & 0.044398 \tabularnewline
\hline
\end{tabular}
%Source: https://freestatistics.org/blog/index.php?pk=309074&T=1

[TABLE]
[ROW][C]Autocorrelation Function[/C][/ROW]
[ROW][C]Time lag k[/C][C]ACF(k)[/C][C]T-STAT[/C][C]P-value[/C][/ROW]
[ROW][C]1[/C][C]0.176624[/C][C]1.6188[/C][C]0.054621[/C][/ROW]
[ROW][C]2[/C][C]-0.188523[/C][C]-1.7278[/C][C]0.043846[/C][/ROW]
[ROW][C]3[/C][C]-0.011542[/C][C]-0.1058[/C][C]0.458001[/C][/ROW]
[ROW][C]4[/C][C]0.302194[/C][C]2.7697[/C][C]0.003453[/C][/ROW]
[ROW][C]5[/C][C]0.143459[/C][C]1.3148[/C][C]0.096073[/C][/ROW]
[ROW][C]6[/C][C]0.165462[/C][C]1.5165[/C][C]0.066576[/C][/ROW]
[ROW][C]7[/C][C]0.13654[/C][C]1.2514[/C][C]0.10713[/C][/ROW]
[ROW][C]8[/C][C]0.322285[/C][C]2.9538[/C][C]0.002035[/C][/ROW]
[ROW][C]9[/C][C]-0.039403[/C][C]-0.3611[/C][C]0.359452[/C][/ROW]
[ROW][C]10[/C][C]-0.19822[/C][C]-1.8167[/C][C]0.036413[/C][/ROW]
[ROW][C]11[/C][C]0.16171[/C][C]1.4821[/C][C]0.071028[/C][/ROW]
[ROW][C]12[/C][C]0.719914[/C][C]6.5981[/C][C]0[/C][/ROW]
[ROW][C]13[/C][C]0.083546[/C][C]0.7657[/C][C]0.222997[/C][/ROW]
[ROW][C]14[/C][C]-0.180278[/C][C]-1.6523[/C][C]0.051106[/C][/ROW]
[ROW][C]15[/C][C]-0.104595[/C][C]-0.9586[/C][C]0.170248[/C][/ROW]
[ROW][C]16[/C][C]0.190893[/C][C]1.7496[/C][C]0.041923[/C][/ROW]
[ROW][C]17[/C][C]0.138833[/C][C]1.2724[/C][C]0.103366[/C][/ROW]
[ROW][C]18[/C][C]0.050092[/C][C]0.4591[/C][C]0.323675[/C][/ROW]
[ROW][C]19[/C][C]0.040496[/C][C]0.3712[/C][C]0.355729[/C][/ROW]
[ROW][C]20[/C][C]0.222698[/C][C]2.0411[/C][C]0.022192[/C][/ROW]
[ROW][C]21[/C][C]-0.135501[/C][C]-1.2419[/C][C]0.108867[/C][/ROW]
[ROW][C]22[/C][C]-0.241097[/C][C]-2.2097[/C][C]0.014924[/C][/ROW]
[ROW][C]23[/C][C]0.111431[/C][C]1.0213[/C][C]0.155027[/C][/ROW]
[ROW][C]24[/C][C]0.48711[/C][C]4.4644[/C][C]1.2e-05[/C][/ROW]
[ROW][C]25[/C][C]0.019247[/C][C]0.1764[/C][C]0.430201[/C][/ROW]
[ROW][C]26[/C][C]-0.211104[/C][C]-1.9348[/C][C]0.02819[/C][/ROW]
[ROW][C]27[/C][C]-0.22574[/C][C]-2.0689[/C][C]0.020813[/C][/ROW]
[ROW][C]28[/C][C]0.083781[/C][C]0.7679[/C][C]0.222361[/C][/ROW]
[ROW][C]29[/C][C]0.040346[/C][C]0.3698[/C][C]0.35624[/C][/ROW]
[ROW][C]30[/C][C]-0.089719[/C][C]-0.8223[/C][C]0.206619[/C][/ROW]
[ROW][C]31[/C][C]-0.049708[/C][C]-0.4556[/C][C]0.324932[/C][/ROW]
[ROW][C]32[/C][C]0.104265[/C][C]0.9556[/C][C]0.171008[/C][/ROW]
[ROW][C]33[/C][C]-0.213084[/C][C]-1.9529[/C][C]0.027078[/C][/ROW]
[ROW][C]34[/C][C]-0.252343[/C][C]-2.3128[/C][C]0.011591[/C][/ROW]
[ROW][C]35[/C][C]0.005686[/C][C]0.0521[/C][C]0.479282[/C][/ROW]
[ROW][C]36[/C][C]0.2785[/C][C]2.5525[/C][C]0.006252[/C][/ROW]
[ROW][C]37[/C][C]-0.021439[/C][C]-0.1965[/C][C]0.422352[/C][/ROW]
[ROW][C]38[/C][C]-0.246622[/C][C]-2.2603[/C][C]0.013194[/C][/ROW]
[ROW][C]39[/C][C]-0.285741[/C][C]-2.6189[/C][C]0.005233[/C][/ROW]
[ROW][C]40[/C][C]0.022465[/C][C]0.2059[/C][C]0.418684[/C][/ROW]
[ROW][C]41[/C][C]-0.025182[/C][C]-0.2308[/C][C]0.409016[/C][/ROW]
[ROW][C]42[/C][C]-0.119874[/C][C]-1.0987[/C][C]0.137527[/C][/ROW]
[ROW][C]43[/C][C]-0.091853[/C][C]-0.8418[/C][C]0.201132[/C][/ROW]
[ROW][C]44[/C][C]0.035035[/C][C]0.3211[/C][C]0.374466[/C][/ROW]
[ROW][C]45[/C][C]-0.172538[/C][C]-1.5813[/C][C]0.058779[/C][/ROW]
[ROW][C]46[/C][C]-0.215411[/C][C]-1.9743[/C][C]0.025818[/C][/ROW]
[ROW][C]47[/C][C]-0.075716[/C][C]-0.694[/C][C]0.244814[/C][/ROW]
[ROW][C]48[/C][C]0.187858[/C][C]1.7217[/C][C]0.044398[/C][/ROW]
[/TABLE]
Source: https://freestatistics.org/blog/index.php?pk=309074&T=1

Globally Unique Identifier (entire table): ba.freestatistics.org/blog/index.php?pk=309074&T=1

As an alternative you can also use a QR Code:  

The GUIDs for individual cells are displayed in the table below:

Autocorrelation Function
Time lag kACF(k)T-STATP-value
10.1766241.61880.054621
2-0.188523-1.72780.043846
3-0.011542-0.10580.458001
40.3021942.76970.003453
50.1434591.31480.096073
60.1654621.51650.066576
70.136541.25140.10713
80.3222852.95380.002035
9-0.039403-0.36110.359452
10-0.19822-1.81670.036413
110.161711.48210.071028
120.7199146.59810
130.0835460.76570.222997
14-0.180278-1.65230.051106
15-0.104595-0.95860.170248
160.1908931.74960.041923
170.1388331.27240.103366
180.0500920.45910.323675
190.0404960.37120.355729
200.2226982.04110.022192
21-0.135501-1.24190.108867
22-0.241097-2.20970.014924
230.1114311.02130.155027
240.487114.46441.2e-05
250.0192470.17640.430201
26-0.211104-1.93480.02819
27-0.22574-2.06890.020813
280.0837810.76790.222361
290.0403460.36980.35624
30-0.089719-0.82230.206619
31-0.049708-0.45560.324932
320.1042650.95560.171008
33-0.213084-1.95290.027078
34-0.252343-2.31280.011591
350.0056860.05210.479282
360.27852.55250.006252
37-0.021439-0.19650.422352
38-0.246622-2.26030.013194
39-0.285741-2.61890.005233
400.0224650.20590.418684
41-0.025182-0.23080.409016
42-0.119874-1.09870.137527
43-0.091853-0.84180.201132
440.0350350.32110.374466
45-0.172538-1.58130.058779
46-0.215411-1.97430.025818
47-0.075716-0.6940.244814
480.1878581.72170.044398


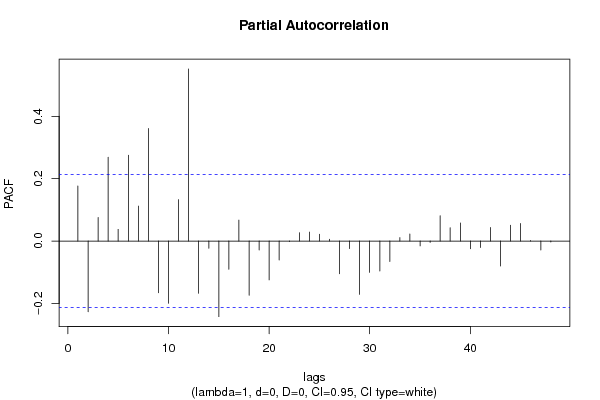
Partial Autocorrelation Function
Time lag kPACF(k)T-STATP-value
10.1766241.61880.054621
2-0.226794-2.07860.020353
30.075480.69180.245489
40.2689192.46470.007875
50.0374770.34350.366048
60.2751812.52210.006777
70.1121241.02760.153536
80.361213.31050.000687
9-0.165891-1.52040.066081
10-0.199692-1.83020.035383
110.1329081.21810.113295
120.5519345.05861e-06
13-0.167351-1.53380.064419
14-0.023288-0.21340.415751
15-0.242514-2.22270.014462
16-0.090365-0.82820.20495
170.0670640.61470.270222
18-0.173771-1.59260.057499
19-0.028875-0.26460.395967
20-0.124594-1.14190.128365
21-0.06077-0.5570.289517
22-0.001702-0.01560.493796
230.0265320.24320.404233
240.0285770.26190.397016
250.0218160.19990.421003
260.0059380.05440.478362
27-0.105145-0.96370.168989
28-0.024269-0.22240.41226
29-0.171163-1.56870.060234
30-0.100426-0.92040.179995
31-0.096211-0.88180.190205
32-0.065504-0.60040.274943
330.0109010.09990.460326
340.0227950.20890.417507
35-0.015603-0.1430.443315
36-0.004438-0.04070.483826
370.080950.74190.230103
380.0424580.38910.349079
390.0580710.53220.297986
40-0.02487-0.22790.410123
41-0.020819-0.19080.424569
420.0437070.40060.344874
43-0.080266-0.73570.231995
440.0506810.46450.321745
450.056420.51710.303224
460.0016050.01470.494148
47-0.028587-0.2620.39698
48-0.002931-0.02690.489315

\begin{tabular}{lllllllll}
\hline
Partial Autocorrelation Function \tabularnewline
Time lag k & PACF(k) & T-STAT & P-value \tabularnewline
1 & 0.176624 & 1.6188 & 0.054621 \tabularnewline
2 & -0.226794 & -2.0786 & 0.020353 \tabularnewline
3 & 0.07548 & 0.6918 & 0.245489 \tabularnewline
4 & 0.268919 & 2.4647 & 0.007875 \tabularnewline
5 & 0.037477 & 0.3435 & 0.366048 \tabularnewline
6 & 0.275181 & 2.5221 & 0.006777 \tabularnewline
7 & 0.112124 & 1.0276 & 0.153536 \tabularnewline
8 & 0.36121 & 3.3105 & 0.000687 \tabularnewline
9 & -0.165891 & -1.5204 & 0.066081 \tabularnewline
10 & -0.199692 & -1.8302 & 0.035383 \tabularnewline
11 & 0.132908 & 1.2181 & 0.113295 \tabularnewline
12 & 0.551934 & 5.0586 & 1e-06 \tabularnewline
13 & -0.167351 & -1.5338 & 0.064419 \tabularnewline
14 & -0.023288 & -0.2134 & 0.415751 \tabularnewline
15 & -0.242514 & -2.2227 & 0.014462 \tabularnewline
16 & -0.090365 & -0.8282 & 0.20495 \tabularnewline
17 & 0.067064 & 0.6147 & 0.270222 \tabularnewline
18 & -0.173771 & -1.5926 & 0.057499 \tabularnewline
19 & -0.028875 & -0.2646 & 0.395967 \tabularnewline
20 & -0.124594 & -1.1419 & 0.128365 \tabularnewline
21 & -0.06077 & -0.557 & 0.289517 \tabularnewline
22 & -0.001702 & -0.0156 & 0.493796 \tabularnewline
23 & 0.026532 & 0.2432 & 0.404233 \tabularnewline
24 & 0.028577 & 0.2619 & 0.397016 \tabularnewline
25 & 0.021816 & 0.1999 & 0.421003 \tabularnewline
26 & 0.005938 & 0.0544 & 0.478362 \tabularnewline
27 & -0.105145 & -0.9637 & 0.168989 \tabularnewline
28 & -0.024269 & -0.2224 & 0.41226 \tabularnewline
29 & -0.171163 & -1.5687 & 0.060234 \tabularnewline
30 & -0.100426 & -0.9204 & 0.179995 \tabularnewline
31 & -0.096211 & -0.8818 & 0.190205 \tabularnewline
32 & -0.065504 & -0.6004 & 0.274943 \tabularnewline
33 & 0.010901 & 0.0999 & 0.460326 \tabularnewline
34 & 0.022795 & 0.2089 & 0.417507 \tabularnewline
35 & -0.015603 & -0.143 & 0.443315 \tabularnewline
36 & -0.004438 & -0.0407 & 0.483826 \tabularnewline
37 & 0.08095 & 0.7419 & 0.230103 \tabularnewline
38 & 0.042458 & 0.3891 & 0.349079 \tabularnewline
39 & 0.058071 & 0.5322 & 0.297986 \tabularnewline
40 & -0.02487 & -0.2279 & 0.410123 \tabularnewline
41 & -0.020819 & -0.1908 & 0.424569 \tabularnewline
42 & 0.043707 & 0.4006 & 0.344874 \tabularnewline
43 & -0.080266 & -0.7357 & 0.231995 \tabularnewline
44 & 0.050681 & 0.4645 & 0.321745 \tabularnewline
45 & 0.05642 & 0.5171 & 0.303224 \tabularnewline
46 & 0.001605 & 0.0147 & 0.494148 \tabularnewline
47 & -0.028587 & -0.262 & 0.39698 \tabularnewline
48 & -0.002931 & -0.0269 & 0.489315 \tabularnewline
\hline
\end{tabular}
%Source: https://freestatistics.org/blog/index.php?pk=309074&T=2

[TABLE]
[ROW][C]Partial Autocorrelation Function[/C][/ROW]
[ROW][C]Time lag k[/C][C]PACF(k)[/C][C]T-STAT[/C][C]P-value[/C][/ROW]
[ROW][C]1[/C][C]0.176624[/C][C]1.6188[/C][C]0.054621[/C][/ROW]
[ROW][C]2[/C][C]-0.226794[/C][C]-2.0786[/C][C]0.020353[/C][/ROW]
[ROW][C]3[/C][C]0.07548[/C][C]0.6918[/C][C]0.245489[/C][/ROW]
[ROW][C]4[/C][C]0.268919[/C][C]2.4647[/C][C]0.007875[/C][/ROW]
[ROW][C]5[/C][C]0.037477[/C][C]0.3435[/C][C]0.366048[/C][/ROW]
[ROW][C]6[/C][C]0.275181[/C][C]2.5221[/C][C]0.006777[/C][/ROW]
[ROW][C]7[/C][C]0.112124[/C][C]1.0276[/C][C]0.153536[/C][/ROW]
[ROW][C]8[/C][C]0.36121[/C][C]3.3105[/C][C]0.000687[/C][/ROW]
[ROW][C]9[/C][C]-0.165891[/C][C]-1.5204[/C][C]0.066081[/C][/ROW]
[ROW][C]10[/C][C]-0.199692[/C][C]-1.8302[/C][C]0.035383[/C][/ROW]
[ROW][C]11[/C][C]0.132908[/C][C]1.2181[/C][C]0.113295[/C][/ROW]
[ROW][C]12[/C][C]0.551934[/C][C]5.0586[/C][C]1e-06[/C][/ROW]
[ROW][C]13[/C][C]-0.167351[/C][C]-1.5338[/C][C]0.064419[/C][/ROW]
[ROW][C]14[/C][C]-0.023288[/C][C]-0.2134[/C][C]0.415751[/C][/ROW]
[ROW][C]15[/C][C]-0.242514[/C][C]-2.2227[/C][C]0.014462[/C][/ROW]
[ROW][C]16[/C][C]-0.090365[/C][C]-0.8282[/C][C]0.20495[/C][/ROW]
[ROW][C]17[/C][C]0.067064[/C][C]0.6147[/C][C]0.270222[/C][/ROW]
[ROW][C]18[/C][C]-0.173771[/C][C]-1.5926[/C][C]0.057499[/C][/ROW]
[ROW][C]19[/C][C]-0.028875[/C][C]-0.2646[/C][C]0.395967[/C][/ROW]
[ROW][C]20[/C][C]-0.124594[/C][C]-1.1419[/C][C]0.128365[/C][/ROW]
[ROW][C]21[/C][C]-0.06077[/C][C]-0.557[/C][C]0.289517[/C][/ROW]
[ROW][C]22[/C][C]-0.001702[/C][C]-0.0156[/C][C]0.493796[/C][/ROW]
[ROW][C]23[/C][C]0.026532[/C][C]0.2432[/C][C]0.404233[/C][/ROW]
[ROW][C]24[/C][C]0.028577[/C][C]0.2619[/C][C]0.397016[/C][/ROW]
[ROW][C]25[/C][C]0.021816[/C][C]0.1999[/C][C]0.421003[/C][/ROW]
[ROW][C]26[/C][C]0.005938[/C][C]0.0544[/C][C]0.478362[/C][/ROW]
[ROW][C]27[/C][C]-0.105145[/C][C]-0.9637[/C][C]0.168989[/C][/ROW]
[ROW][C]28[/C][C]-0.024269[/C][C]-0.2224[/C][C]0.41226[/C][/ROW]
[ROW][C]29[/C][C]-0.171163[/C][C]-1.5687[/C][C]0.060234[/C][/ROW]
[ROW][C]30[/C][C]-0.100426[/C][C]-0.9204[/C][C]0.179995[/C][/ROW]
[ROW][C]31[/C][C]-0.096211[/C][C]-0.8818[/C][C]0.190205[/C][/ROW]
[ROW][C]32[/C][C]-0.065504[/C][C]-0.6004[/C][C]0.274943[/C][/ROW]
[ROW][C]33[/C][C]0.010901[/C][C]0.0999[/C][C]0.460326[/C][/ROW]
[ROW][C]34[/C][C]0.022795[/C][C]0.2089[/C][C]0.417507[/C][/ROW]
[ROW][C]35[/C][C]-0.015603[/C][C]-0.143[/C][C]0.443315[/C][/ROW]
[ROW][C]36[/C][C]-0.004438[/C][C]-0.0407[/C][C]0.483826[/C][/ROW]
[ROW][C]37[/C][C]0.08095[/C][C]0.7419[/C][C]0.230103[/C][/ROW]
[ROW][C]38[/C][C]0.042458[/C][C]0.3891[/C][C]0.349079[/C][/ROW]
[ROW][C]39[/C][C]0.058071[/C][C]0.5322[/C][C]0.297986[/C][/ROW]
[ROW][C]40[/C][C]-0.02487[/C][C]-0.2279[/C][C]0.410123[/C][/ROW]
[ROW][C]41[/C][C]-0.020819[/C][C]-0.1908[/C][C]0.424569[/C][/ROW]
[ROW][C]42[/C][C]0.043707[/C][C]0.4006[/C][C]0.344874[/C][/ROW]
[ROW][C]43[/C][C]-0.080266[/C][C]-0.7357[/C][C]0.231995[/C][/ROW]
[ROW][C]44[/C][C]0.050681[/C][C]0.4645[/C][C]0.321745[/C][/ROW]
[ROW][C]45[/C][C]0.05642[/C][C]0.5171[/C][C]0.303224[/C][/ROW]
[ROW][C]46[/C][C]0.001605[/C][C]0.0147[/C][C]0.494148[/C][/ROW]
[ROW][C]47[/C][C]-0.028587[/C][C]-0.262[/C][C]0.39698[/C][/ROW]
[ROW][C]48[/C][C]-0.002931[/C][C]-0.0269[/C][C]0.489315[/C][/ROW]
[/TABLE]
Source: https://freestatistics.org/blog/index.php?pk=309074&T=2

Globally Unique Identifier (entire table): ba.freestatistics.org/blog/index.php?pk=309074&T=2

As an alternative you can also use a QR Code:  

The GUIDs for individual cells are displayed in the table below:

Partial Autocorrelation Function
Time lag kPACF(k)T-STATP-value
10.1766241.61880.054621
2-0.226794-2.07860.020353
30.075480.69180.245489
40.2689192.46470.007875
50.0374770.34350.366048
60.2751812.52210.006777
70.1121241.02760.153536
80.361213.31050.000687
9-0.165891-1.52040.066081
10-0.199692-1.83020.035383
110.1329081.21810.113295
120.5519345.05861e-06
13-0.167351-1.53380.064419
14-0.023288-0.21340.415751
15-0.242514-2.22270.014462
16-0.090365-0.82820.20495
170.0670640.61470.270222
18-0.173771-1.59260.057499
19-0.028875-0.26460.395967
20-0.124594-1.14190.128365
21-0.06077-0.5570.289517
22-0.001702-0.01560.493796
230.0265320.24320.404233
240.0285770.26190.397016
250.0218160.19990.421003
260.0059380.05440.478362
27-0.105145-0.96370.168989
28-0.024269-0.22240.41226
29-0.171163-1.56870.060234
30-0.100426-0.92040.179995
31-0.096211-0.88180.190205
32-0.065504-0.60040.274943
330.0109010.09990.460326
340.0227950.20890.417507
35-0.015603-0.1430.443315
36-0.004438-0.04070.483826
370.080950.74190.230103
380.0424580.38910.349079
390.0580710.53220.297986
40-0.02487-0.22790.410123
41-0.020819-0.19080.424569
420.0437070.40060.344874
43-0.080266-0.73570.231995
440.0506810.46450.321745
450.056420.51710.303224
460.0016050.01470.494148
47-0.028587-0.2620.39698
48-0.002931-0.02690.489315


Parameters (Session):
par1 = 48 ; par2 = 1 ; par3 = 0 ; par4 = 0 ; par5 = 12 ; par6 = White Noise ; par7 = 0.95 ;
Parameters (R input):
par1 = 48 ; par2 = 1 ; par3 = 0 ; par4 = 0 ; par5 = 12 ; par6 = White Noise ; par7 = 0.95 ; par8 = ;
R code (references can be found in the software module):
if (par1 == 'Default') {
par1 = 10*log10(length(x))
} else {
par1 <- as.numeric(par1)
}
par2 <- as.numeric(par2)
par3 <- as.numeric(par3)
par4 <- as.numeric(par4)
par5 <- as.numeric(par5)
if (par6 == 'White Noise') par6 <- 'white' else par6 <- 'ma'
par7 <- as.numeric(par7)
if (par8 != '') par8 <- as.numeric(par8)
x <- na.omit(x)
ox <- x
if (par8 == '') {
if (par2 == 0) {
x <- log(x)
} else {
x <- (x ^ par2 - 1) / par2
}
} else {
x <- log(x,base=par8)
}
if (par3 > 0) x <- diff(x,lag=1,difference=par3)
if (par4 > 0) x <- diff(x,lag=par5,difference=par4)
bitmap(file='picts.png')
op <- par(mfrow=c(2,1))
plot(ox,type='l',main='Original Time Series',xlab='time',ylab='value')
if (par8=='') {
mytitle <- paste('Working Time Series (lambda=',par2,', d=',par3,', D=',par4,')',sep='')
mysub <- paste('(lambda=',par2,', d=',par3,', D=',par4,', CI=', par7, ', CI type=',par6,')',sep='')
} else {
mytitle <- paste('Working Time Series (base=',par8,', d=',par3,', D=',par4,')',sep='')
mysub <- paste('(base=',par8,', d=',par3,', D=',par4,', CI=', par7, ', CI type=',par6,')',sep='')
}
plot(x,type='l', main=mytitle,xlab='time',ylab='value')
par(op)
dev.off()
bitmap(file='pic1.png')
racf <- acf(x, par1, main='Autocorrelation', xlab='time lag', ylab='ACF', ci.type=par6, ci=par7, sub=mysub)
dev.off()
bitmap(file='pic2.png')
rpacf <- pacf(x,par1,main='Partial Autocorrelation',xlab='lags',ylab='PACF',sub=mysub)
dev.off()
(myacf <- c(racf$acf))
(mypacf <- c(rpacf$acf))
lengthx <- length(x)
sqrtn <- sqrt(lengthx)
load(file='createtable')
a<-table.start()
a<-table.row.start(a)
a<-table.element(a,'Autocorrelation Function',4,TRUE)
a<-table.row.end(a)
a<-table.row.start(a)
a<-table.element(a,'Time lag k',header=TRUE)
a<-table.element(a,'ACF(k)',header=TRUE)
a<-table.element(a,'T-STAT',header=TRUE)
a<-table.element(a,'P-value',header=TRUE)
a<-table.row.end(a)
for (i in 2:(par1+1)) {
a<-table.row.start(a)
a<-table.element(a,i-1,header=TRUE)
a<-table.element(a,round(myacf[i],6))
mytstat <- myacf[i]*sqrtn
a<-table.element(a,round(mytstat,4))
a<-table.element(a,round(1-pt(abs(mytstat),lengthx),6))
a<-table.row.end(a)
}
a<-table.end(a)
table.save(a,file='mytable.tab')
a<-table.start()
a<-table.row.start(a)
a<-table.element(a,'Partial Autocorrelation Function',4,TRUE)
a<-table.row.end(a)
a<-table.row.start(a)
a<-table.element(a,'Time lag k',header=TRUE)
a<-table.element(a,'PACF(k)',header=TRUE)
a<-table.element(a,'T-STAT',header=TRUE)
a<-table.element(a,'P-value',header=TRUE)
a<-table.row.end(a)
for (i in 1:par1) {
a<-table.row.start(a)
a<-table.element(a,i,header=TRUE)
a<-table.element(a,round(mypacf[i],6))
mytstat <- mypacf[i]*sqrtn
a<-table.element(a,round(mytstat,4))
a<-table.element(a,round(1-pt(abs(mytstat),lengthx),6))
a<-table.row.end(a)
}
a<-table.end(a)
table.save(a,file='mytable1.tab')