Free Statistics

of Irreproducible Research!

Author's title

Author*The author of this computation has been verified*
R Software Modulerwasp_autocorrelation.wasp
Title produced by software(Partial) Autocorrelation Function
Date of computationMon, 11 Dec 2017 13:38:30 +0100
Cite this page as followsStatistical Computations at FreeStatistics.org, Office for Research Development and Education, URL https://freestatistics.org/blog/index.php?v=date/2017/Dec/11/t1512995954ucotnq045tngvio.htm/, Retrieved Wed, 15 May 2024 04:13:01 +0000
Statistical Computations at FreeStatistics.org, Office for Research Development and Education, URL https://freestatistics.org/blog/index.php?pk=308959, Retrieved Wed, 15 May 2024 04:13:01 +0000
QR Codes:

Original text written by user:
IsPrivate?No (this computation is public)
User-defined keywords
Estimated Impact128
Family? (F = Feedback message, R = changed R code, M = changed R Module, P = changed Parameters, D = changed Data)
-       [(Partial) Autocorrelation Function] [] [2017-12-11 12:38:30] [ca643b0c409f93e6a7ce1fd0961340ec] [Current]
Feedback Forum

Post a new message
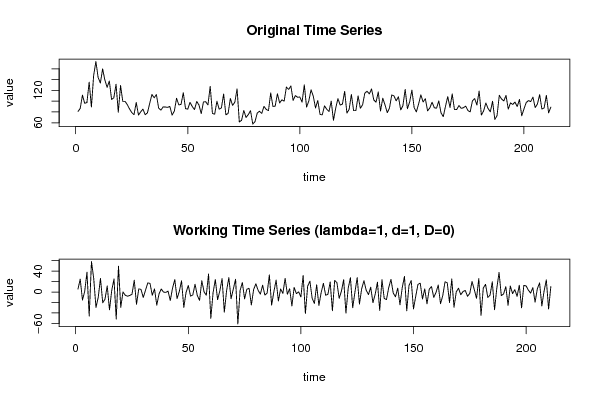
Dataseries X:
80.9
86.5
111.3
96
97.4
135.3
89.2
147.6
173.5
144
133.7
159.9
139.4
125.7
137.4
103.2
106.3
131.4
79.5
129.1
99.6
99.7
93.7
85.7
79.1
74.9
97.7
74.3
80.3
85.3
74.9
78.4
95.8
112.4
106.3
112.3
87.1
83.5
89.3
89.2
88.5
90.3
74.2
81.6
105.5
93.1
94.1
115.7
86.2
85.2
97.9
90.1
84.5
99.5
92.9
76.9
98.6
99
93
127.6
77.2
75.9
99.9
85.3
87.5
113.3
74.8
77.3
105
92.2
98.2
122.8
61.5
64.5
82.8
69.8
75.2
82.4
57.6
62.2
78
81.4
77.3
90.4
84.7
82.5
115.3
90.2
90.8
113.8
96.7
102.6
100
126.2
121.8
128.2
101.5
110.4
107.3
107.7
98.3
130.3
89.1
100.4
121.1
109.3
87.4
101.3
75.6
74.6
91.3
85.1
80.8
100.2
64.5
86.9
104.8
92.9
94.6
118.3
77.9
85
112.5
82.4
82.4
109.9
86.9
93.3
115
118.5
113.5
122.7
102.3
98.2
117.1
81.8
105.5
93.2
78.8
87.2
111.5
109.8
100.7
108.2
83.8
92
121.9
86.1
98.6
120.6
88.2
80.2
94.9
111.8
98.5
104.6
82.1
87.5
98.1
87.8
87
100.5
78.2
71.3
90.9
108.5
88.4
113.4
84.3
84.6
92
86.8
87.8
90.9
82.7
80.2
100.4
105
92.9
118.8
74.3
81.9
96.7
86.3
80.4
100
66.2
73.3
110.9
104.1
100.4
110.7
85.3
96.9
93.9
98.4
90.1
103.2
72.9
85.6
97.4
101.2
99.2
107.6
88.3
94.6
112.2
85.4
87.5
110.8
78.3
89


Summary of computational transaction
Raw Input view raw input (R code)
Raw Outputview raw output of R engine
Computing time1 seconds
R ServerBig Analytics Cloud Computing Center

\begin{tabular}{lllllllll}
\hline
Summary of computational transaction \tabularnewline
Raw Input view raw input (R code)  \tabularnewline
Raw Outputview raw output of R engine  \tabularnewline
Computing time1 seconds \tabularnewline
R ServerBig Analytics Cloud Computing Center \tabularnewline
\hline
\end{tabular}
%Source: https://freestatistics.org/blog/index.php?pk=308959&T=0

[TABLE]
[ROW]
Summary of computational transaction[/C][/ROW] [ROW]Raw Input[/C] view raw input (R code) [/C][/ROW] [ROW]Raw Output[/C]view raw output of R engine [/C][/ROW] [ROW]Computing time[/C]1 seconds[/C][/ROW] [ROW]R Server[/C]Big Analytics Cloud Computing Center[/C][/ROW] [/TABLE] Source: https://freestatistics.org/blog/index.php?pk=308959&T=0

Globally Unique Identifier (entire table): ba.freestatistics.org/blog/index.php?pk=308959&T=0

As an alternative you can also use a QR Code:  

The GUIDs for individual cells are displayed in the table below:

Summary of computational transaction
Raw Input view raw input (R code)
Raw Outputview raw output of R engine
Computing time1 seconds
R ServerBig Analytics Cloud Computing Center


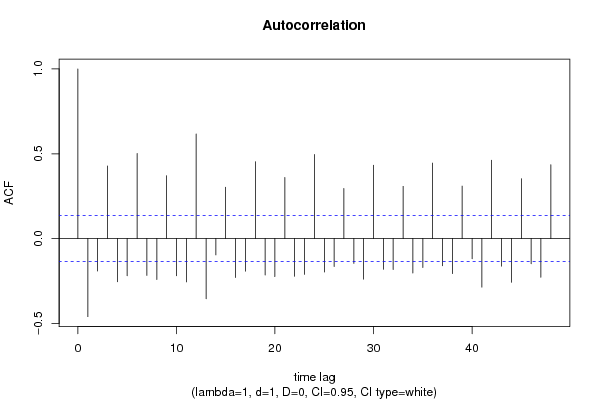
Autocorrelation Function
Time lag kACF(k)T-STATP-value
1-0.460394-6.68760
2-0.191778-2.78570.002914
30.4275976.21120
4-0.254956-3.70340.000136
5-0.219409-3.18710.000828
60.5012057.28040
7-0.21729-3.15630.000916
8-0.241333-3.50560.000278
90.3703785.38010
10-0.219122-3.18290.000839
11-0.255617-3.71310.000131
120.6164338.95420
13-0.354895-5.15520
14-0.096265-1.39830.081741
150.3021464.38899e-06
16-0.229689-3.33640.000501
17-0.192099-2.79040.002873
180.4530016.58020
19-0.214771-3.11970.001032
20-0.22423-3.25710.000656
210.3597875.22620
22-0.222539-3.23260.000712
23-0.211016-3.06520.00123
240.4955877.19880
25-0.197357-2.86680.002284
26-0.164428-2.38850.0089
270.2955094.29251.3e-05
28-0.146263-2.12460.017392
29-0.239343-3.47670.000308
300.4320936.27650
31-0.18075-2.62550.004642
32-0.182879-2.65650.00425
330.3076044.46826e-06
34-0.20263-2.94340.001805
35-0.171093-2.48530.006861
360.4446466.45890
37-0.159961-2.32360.01055
38-0.206575-3.00070.001509
390.309414.49446e-06
40-0.119358-1.73380.042209
41-0.286497-4.16162.3e-05
420.4613056.70080
43-0.162613-2.36210.009541
44-0.257186-3.73580.00012
450.3524035.11890
46-0.148231-2.15320.016219
47-0.228453-3.31850.000533
480.4356416.32810

\begin{tabular}{lllllllll}
\hline
Autocorrelation Function \tabularnewline
Time lag k & ACF(k) & T-STAT & P-value \tabularnewline
1 & -0.460394 & -6.6876 & 0 \tabularnewline
2 & -0.191778 & -2.7857 & 0.002914 \tabularnewline
3 & 0.427597 & 6.2112 & 0 \tabularnewline
4 & -0.254956 & -3.7034 & 0.000136 \tabularnewline
5 & -0.219409 & -3.1871 & 0.000828 \tabularnewline
6 & 0.501205 & 7.2804 & 0 \tabularnewline
7 & -0.21729 & -3.1563 & 0.000916 \tabularnewline
8 & -0.241333 & -3.5056 & 0.000278 \tabularnewline
9 & 0.370378 & 5.3801 & 0 \tabularnewline
10 & -0.219122 & -3.1829 & 0.000839 \tabularnewline
11 & -0.255617 & -3.7131 & 0.000131 \tabularnewline
12 & 0.616433 & 8.9542 & 0 \tabularnewline
13 & -0.354895 & -5.1552 & 0 \tabularnewline
14 & -0.096265 & -1.3983 & 0.081741 \tabularnewline
15 & 0.302146 & 4.3889 & 9e-06 \tabularnewline
16 & -0.229689 & -3.3364 & 0.000501 \tabularnewline
17 & -0.192099 & -2.7904 & 0.002873 \tabularnewline
18 & 0.453001 & 6.5802 & 0 \tabularnewline
19 & -0.214771 & -3.1197 & 0.001032 \tabularnewline
20 & -0.22423 & -3.2571 & 0.000656 \tabularnewline
21 & 0.359787 & 5.2262 & 0 \tabularnewline
22 & -0.222539 & -3.2326 & 0.000712 \tabularnewline
23 & -0.211016 & -3.0652 & 0.00123 \tabularnewline
24 & 0.495587 & 7.1988 & 0 \tabularnewline
25 & -0.197357 & -2.8668 & 0.002284 \tabularnewline
26 & -0.164428 & -2.3885 & 0.0089 \tabularnewline
27 & 0.295509 & 4.2925 & 1.3e-05 \tabularnewline
28 & -0.146263 & -2.1246 & 0.017392 \tabularnewline
29 & -0.239343 & -3.4767 & 0.000308 \tabularnewline
30 & 0.432093 & 6.2765 & 0 \tabularnewline
31 & -0.18075 & -2.6255 & 0.004642 \tabularnewline
32 & -0.182879 & -2.6565 & 0.00425 \tabularnewline
33 & 0.307604 & 4.4682 & 6e-06 \tabularnewline
34 & -0.20263 & -2.9434 & 0.001805 \tabularnewline
35 & -0.171093 & -2.4853 & 0.006861 \tabularnewline
36 & 0.444646 & 6.4589 & 0 \tabularnewline
37 & -0.159961 & -2.3236 & 0.01055 \tabularnewline
38 & -0.206575 & -3.0007 & 0.001509 \tabularnewline
39 & 0.30941 & 4.4944 & 6e-06 \tabularnewline
40 & -0.119358 & -1.7338 & 0.042209 \tabularnewline
41 & -0.286497 & -4.1616 & 2.3e-05 \tabularnewline
42 & 0.461305 & 6.7008 & 0 \tabularnewline
43 & -0.162613 & -2.3621 & 0.009541 \tabularnewline
44 & -0.257186 & -3.7358 & 0.00012 \tabularnewline
45 & 0.352403 & 5.1189 & 0 \tabularnewline
46 & -0.148231 & -2.1532 & 0.016219 \tabularnewline
47 & -0.228453 & -3.3185 & 0.000533 \tabularnewline
48 & 0.435641 & 6.3281 & 0 \tabularnewline
\hline
\end{tabular}
%Source: https://freestatistics.org/blog/index.php?pk=308959&T=1

[TABLE]
[ROW][C]Autocorrelation Function[/C][/ROW]
[ROW][C]Time lag k[/C][C]ACF(k)[/C][C]T-STAT[/C][C]P-value[/C][/ROW]
[ROW][C]1[/C][C]-0.460394[/C][C]-6.6876[/C][C]0[/C][/ROW]
[ROW][C]2[/C][C]-0.191778[/C][C]-2.7857[/C][C]0.002914[/C][/ROW]
[ROW][C]3[/C][C]0.427597[/C][C]6.2112[/C][C]0[/C][/ROW]
[ROW][C]4[/C][C]-0.254956[/C][C]-3.7034[/C][C]0.000136[/C][/ROW]
[ROW][C]5[/C][C]-0.219409[/C][C]-3.1871[/C][C]0.000828[/C][/ROW]
[ROW][C]6[/C][C]0.501205[/C][C]7.2804[/C][C]0[/C][/ROW]
[ROW][C]7[/C][C]-0.21729[/C][C]-3.1563[/C][C]0.000916[/C][/ROW]
[ROW][C]8[/C][C]-0.241333[/C][C]-3.5056[/C][C]0.000278[/C][/ROW]
[ROW][C]9[/C][C]0.370378[/C][C]5.3801[/C][C]0[/C][/ROW]
[ROW][C]10[/C][C]-0.219122[/C][C]-3.1829[/C][C]0.000839[/C][/ROW]
[ROW][C]11[/C][C]-0.255617[/C][C]-3.7131[/C][C]0.000131[/C][/ROW]
[ROW][C]12[/C][C]0.616433[/C][C]8.9542[/C][C]0[/C][/ROW]
[ROW][C]13[/C][C]-0.354895[/C][C]-5.1552[/C][C]0[/C][/ROW]
[ROW][C]14[/C][C]-0.096265[/C][C]-1.3983[/C][C]0.081741[/C][/ROW]
[ROW][C]15[/C][C]0.302146[/C][C]4.3889[/C][C]9e-06[/C][/ROW]
[ROW][C]16[/C][C]-0.229689[/C][C]-3.3364[/C][C]0.000501[/C][/ROW]
[ROW][C]17[/C][C]-0.192099[/C][C]-2.7904[/C][C]0.002873[/C][/ROW]
[ROW][C]18[/C][C]0.453001[/C][C]6.5802[/C][C]0[/C][/ROW]
[ROW][C]19[/C][C]-0.214771[/C][C]-3.1197[/C][C]0.001032[/C][/ROW]
[ROW][C]20[/C][C]-0.22423[/C][C]-3.2571[/C][C]0.000656[/C][/ROW]
[ROW][C]21[/C][C]0.359787[/C][C]5.2262[/C][C]0[/C][/ROW]
[ROW][C]22[/C][C]-0.222539[/C][C]-3.2326[/C][C]0.000712[/C][/ROW]
[ROW][C]23[/C][C]-0.211016[/C][C]-3.0652[/C][C]0.00123[/C][/ROW]
[ROW][C]24[/C][C]0.495587[/C][C]7.1988[/C][C]0[/C][/ROW]
[ROW][C]25[/C][C]-0.197357[/C][C]-2.8668[/C][C]0.002284[/C][/ROW]
[ROW][C]26[/C][C]-0.164428[/C][C]-2.3885[/C][C]0.0089[/C][/ROW]
[ROW][C]27[/C][C]0.295509[/C][C]4.2925[/C][C]1.3e-05[/C][/ROW]
[ROW][C]28[/C][C]-0.146263[/C][C]-2.1246[/C][C]0.017392[/C][/ROW]
[ROW][C]29[/C][C]-0.239343[/C][C]-3.4767[/C][C]0.000308[/C][/ROW]
[ROW][C]30[/C][C]0.432093[/C][C]6.2765[/C][C]0[/C][/ROW]
[ROW][C]31[/C][C]-0.18075[/C][C]-2.6255[/C][C]0.004642[/C][/ROW]
[ROW][C]32[/C][C]-0.182879[/C][C]-2.6565[/C][C]0.00425[/C][/ROW]
[ROW][C]33[/C][C]0.307604[/C][C]4.4682[/C][C]6e-06[/C][/ROW]
[ROW][C]34[/C][C]-0.20263[/C][C]-2.9434[/C][C]0.001805[/C][/ROW]
[ROW][C]35[/C][C]-0.171093[/C][C]-2.4853[/C][C]0.006861[/C][/ROW]
[ROW][C]36[/C][C]0.444646[/C][C]6.4589[/C][C]0[/C][/ROW]
[ROW][C]37[/C][C]-0.159961[/C][C]-2.3236[/C][C]0.01055[/C][/ROW]
[ROW][C]38[/C][C]-0.206575[/C][C]-3.0007[/C][C]0.001509[/C][/ROW]
[ROW][C]39[/C][C]0.30941[/C][C]4.4944[/C][C]6e-06[/C][/ROW]
[ROW][C]40[/C][C]-0.119358[/C][C]-1.7338[/C][C]0.042209[/C][/ROW]
[ROW][C]41[/C][C]-0.286497[/C][C]-4.1616[/C][C]2.3e-05[/C][/ROW]
[ROW][C]42[/C][C]0.461305[/C][C]6.7008[/C][C]0[/C][/ROW]
[ROW][C]43[/C][C]-0.162613[/C][C]-2.3621[/C][C]0.009541[/C][/ROW]
[ROW][C]44[/C][C]-0.257186[/C][C]-3.7358[/C][C]0.00012[/C][/ROW]
[ROW][C]45[/C][C]0.352403[/C][C]5.1189[/C][C]0[/C][/ROW]
[ROW][C]46[/C][C]-0.148231[/C][C]-2.1532[/C][C]0.016219[/C][/ROW]
[ROW][C]47[/C][C]-0.228453[/C][C]-3.3185[/C][C]0.000533[/C][/ROW]
[ROW][C]48[/C][C]0.435641[/C][C]6.3281[/C][C]0[/C][/ROW]
[/TABLE]
Source: https://freestatistics.org/blog/index.php?pk=308959&T=1

Globally Unique Identifier (entire table): ba.freestatistics.org/blog/index.php?pk=308959&T=1

As an alternative you can also use a QR Code:  

The GUIDs for individual cells are displayed in the table below:

Autocorrelation Function
Time lag kACF(k)T-STATP-value
1-0.460394-6.68760
2-0.191778-2.78570.002914
30.4275976.21120
4-0.254956-3.70340.000136
5-0.219409-3.18710.000828
60.5012057.28040
7-0.21729-3.15630.000916
8-0.241333-3.50560.000278
90.3703785.38010
10-0.219122-3.18290.000839
11-0.255617-3.71310.000131
120.6164338.95420
13-0.354895-5.15520
14-0.096265-1.39830.081741
150.3021464.38899e-06
16-0.229689-3.33640.000501
17-0.192099-2.79040.002873
180.4530016.58020
19-0.214771-3.11970.001032
20-0.22423-3.25710.000656
210.3597875.22620
22-0.222539-3.23260.000712
23-0.211016-3.06520.00123
240.4955877.19880
25-0.197357-2.86680.002284
26-0.164428-2.38850.0089
270.2955094.29251.3e-05
28-0.146263-2.12460.017392
29-0.239343-3.47670.000308
300.4320936.27650
31-0.18075-2.62550.004642
32-0.182879-2.65650.00425
330.3076044.46826e-06
34-0.20263-2.94340.001805
35-0.171093-2.48530.006861
360.4446466.45890
37-0.159961-2.32360.01055
38-0.206575-3.00070.001509
390.309414.49446e-06
40-0.119358-1.73380.042209
41-0.286497-4.16162.3e-05
420.4613056.70080
43-0.162613-2.36210.009541
44-0.257186-3.73580.00012
450.3524035.11890
46-0.148231-2.15320.016219
47-0.228453-3.31850.000533
480.4356416.32810


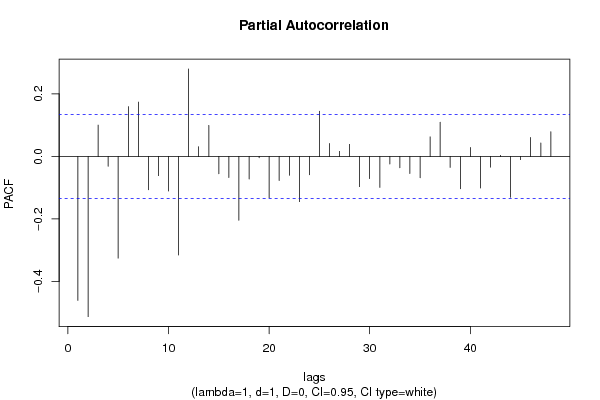
Partial Autocorrelation Function
Time lag kPACF(k)T-STATP-value
1-0.460394-6.68760
2-0.512337-7.44210
30.1001241.45440.073663
4-0.031208-0.45330.325393
5-0.325171-4.72342e-06
60.1594322.31590.010762
70.1737112.52330.006182
8-0.106346-1.54480.06195
9-0.061292-0.89030.187154
10-0.110771-1.6090.054551
11-0.315118-4.57744e-06
120.2798114.06453.4e-05
130.0307640.44690.327714
140.0992831.44220.075369
15-0.05522-0.80210.211696
16-0.067491-0.98040.164014
17-0.204124-2.96510.001687
18-0.072317-1.05050.147352
19-0.004069-0.05910.476459
20-0.132067-1.91840.028206
21-0.077159-1.12080.131825
22-0.060031-0.8720.192098
23-0.144496-2.09890.018507
24-0.058587-0.8510.19786
250.1444092.09770.018563
260.0412960.59990.27462
270.0162690.23630.406707
280.0387010.56220.2873
29-0.096584-1.4030.08105
30-0.070864-1.02940.152245
31-0.099043-1.43870.075861
32-0.024005-0.34870.363832
33-0.036159-0.52520.299984
34-0.05483-0.79650.213332
35-0.068306-0.99220.161119
360.0625870.90910.182158
370.109461.590.056667
38-0.035075-0.50950.305468
39-0.103322-1.50080.067447
400.0288870.41960.337601
41-0.101078-1.46820.071764
42-0.034308-0.49840.309375
430.0034510.05010.480032
44-0.130435-1.89470.029752
45-0.010261-0.14910.440826
460.060740.88230.189309
470.0431350.62660.265811
480.0788951.1460.126544

\begin{tabular}{lllllllll}
\hline
Partial Autocorrelation Function \tabularnewline
Time lag k & PACF(k) & T-STAT & P-value \tabularnewline
1 & -0.460394 & -6.6876 & 0 \tabularnewline
2 & -0.512337 & -7.4421 & 0 \tabularnewline
3 & 0.100124 & 1.4544 & 0.073663 \tabularnewline
4 & -0.031208 & -0.4533 & 0.325393 \tabularnewline
5 & -0.325171 & -4.7234 & 2e-06 \tabularnewline
6 & 0.159432 & 2.3159 & 0.010762 \tabularnewline
7 & 0.173711 & 2.5233 & 0.006182 \tabularnewline
8 & -0.106346 & -1.5448 & 0.06195 \tabularnewline
9 & -0.061292 & -0.8903 & 0.187154 \tabularnewline
10 & -0.110771 & -1.609 & 0.054551 \tabularnewline
11 & -0.315118 & -4.5774 & 4e-06 \tabularnewline
12 & 0.279811 & 4.0645 & 3.4e-05 \tabularnewline
13 & 0.030764 & 0.4469 & 0.327714 \tabularnewline
14 & 0.099283 & 1.4422 & 0.075369 \tabularnewline
15 & -0.05522 & -0.8021 & 0.211696 \tabularnewline
16 & -0.067491 & -0.9804 & 0.164014 \tabularnewline
17 & -0.204124 & -2.9651 & 0.001687 \tabularnewline
18 & -0.072317 & -1.0505 & 0.147352 \tabularnewline
19 & -0.004069 & -0.0591 & 0.476459 \tabularnewline
20 & -0.132067 & -1.9184 & 0.028206 \tabularnewline
21 & -0.077159 & -1.1208 & 0.131825 \tabularnewline
22 & -0.060031 & -0.872 & 0.192098 \tabularnewline
23 & -0.144496 & -2.0989 & 0.018507 \tabularnewline
24 & -0.058587 & -0.851 & 0.19786 \tabularnewline
25 & 0.144409 & 2.0977 & 0.018563 \tabularnewline
26 & 0.041296 & 0.5999 & 0.27462 \tabularnewline
27 & 0.016269 & 0.2363 & 0.406707 \tabularnewline
28 & 0.038701 & 0.5622 & 0.2873 \tabularnewline
29 & -0.096584 & -1.403 & 0.08105 \tabularnewline
30 & -0.070864 & -1.0294 & 0.152245 \tabularnewline
31 & -0.099043 & -1.4387 & 0.075861 \tabularnewline
32 & -0.024005 & -0.3487 & 0.363832 \tabularnewline
33 & -0.036159 & -0.5252 & 0.299984 \tabularnewline
34 & -0.05483 & -0.7965 & 0.213332 \tabularnewline
35 & -0.068306 & -0.9922 & 0.161119 \tabularnewline
36 & 0.062587 & 0.9091 & 0.182158 \tabularnewline
37 & 0.10946 & 1.59 & 0.056667 \tabularnewline
38 & -0.035075 & -0.5095 & 0.305468 \tabularnewline
39 & -0.103322 & -1.5008 & 0.067447 \tabularnewline
40 & 0.028887 & 0.4196 & 0.337601 \tabularnewline
41 & -0.101078 & -1.4682 & 0.071764 \tabularnewline
42 & -0.034308 & -0.4984 & 0.309375 \tabularnewline
43 & 0.003451 & 0.0501 & 0.480032 \tabularnewline
44 & -0.130435 & -1.8947 & 0.029752 \tabularnewline
45 & -0.010261 & -0.1491 & 0.440826 \tabularnewline
46 & 0.06074 & 0.8823 & 0.189309 \tabularnewline
47 & 0.043135 & 0.6266 & 0.265811 \tabularnewline
48 & 0.078895 & 1.146 & 0.126544 \tabularnewline
\hline
\end{tabular}
%Source: https://freestatistics.org/blog/index.php?pk=308959&T=2

[TABLE]
[ROW][C]Partial Autocorrelation Function[/C][/ROW]
[ROW][C]Time lag k[/C][C]PACF(k)[/C][C]T-STAT[/C][C]P-value[/C][/ROW]
[ROW][C]1[/C][C]-0.460394[/C][C]-6.6876[/C][C]0[/C][/ROW]
[ROW][C]2[/C][C]-0.512337[/C][C]-7.4421[/C][C]0[/C][/ROW]
[ROW][C]3[/C][C]0.100124[/C][C]1.4544[/C][C]0.073663[/C][/ROW]
[ROW][C]4[/C][C]-0.031208[/C][C]-0.4533[/C][C]0.325393[/C][/ROW]
[ROW][C]5[/C][C]-0.325171[/C][C]-4.7234[/C][C]2e-06[/C][/ROW]
[ROW][C]6[/C][C]0.159432[/C][C]2.3159[/C][C]0.010762[/C][/ROW]
[ROW][C]7[/C][C]0.173711[/C][C]2.5233[/C][C]0.006182[/C][/ROW]
[ROW][C]8[/C][C]-0.106346[/C][C]-1.5448[/C][C]0.06195[/C][/ROW]
[ROW][C]9[/C][C]-0.061292[/C][C]-0.8903[/C][C]0.187154[/C][/ROW]
[ROW][C]10[/C][C]-0.110771[/C][C]-1.609[/C][C]0.054551[/C][/ROW]
[ROW][C]11[/C][C]-0.315118[/C][C]-4.5774[/C][C]4e-06[/C][/ROW]
[ROW][C]12[/C][C]0.279811[/C][C]4.0645[/C][C]3.4e-05[/C][/ROW]
[ROW][C]13[/C][C]0.030764[/C][C]0.4469[/C][C]0.327714[/C][/ROW]
[ROW][C]14[/C][C]0.099283[/C][C]1.4422[/C][C]0.075369[/C][/ROW]
[ROW][C]15[/C][C]-0.05522[/C][C]-0.8021[/C][C]0.211696[/C][/ROW]
[ROW][C]16[/C][C]-0.067491[/C][C]-0.9804[/C][C]0.164014[/C][/ROW]
[ROW][C]17[/C][C]-0.204124[/C][C]-2.9651[/C][C]0.001687[/C][/ROW]
[ROW][C]18[/C][C]-0.072317[/C][C]-1.0505[/C][C]0.147352[/C][/ROW]
[ROW][C]19[/C][C]-0.004069[/C][C]-0.0591[/C][C]0.476459[/C][/ROW]
[ROW][C]20[/C][C]-0.132067[/C][C]-1.9184[/C][C]0.028206[/C][/ROW]
[ROW][C]21[/C][C]-0.077159[/C][C]-1.1208[/C][C]0.131825[/C][/ROW]
[ROW][C]22[/C][C]-0.060031[/C][C]-0.872[/C][C]0.192098[/C][/ROW]
[ROW][C]23[/C][C]-0.144496[/C][C]-2.0989[/C][C]0.018507[/C][/ROW]
[ROW][C]24[/C][C]-0.058587[/C][C]-0.851[/C][C]0.19786[/C][/ROW]
[ROW][C]25[/C][C]0.144409[/C][C]2.0977[/C][C]0.018563[/C][/ROW]
[ROW][C]26[/C][C]0.041296[/C][C]0.5999[/C][C]0.27462[/C][/ROW]
[ROW][C]27[/C][C]0.016269[/C][C]0.2363[/C][C]0.406707[/C][/ROW]
[ROW][C]28[/C][C]0.038701[/C][C]0.5622[/C][C]0.2873[/C][/ROW]
[ROW][C]29[/C][C]-0.096584[/C][C]-1.403[/C][C]0.08105[/C][/ROW]
[ROW][C]30[/C][C]-0.070864[/C][C]-1.0294[/C][C]0.152245[/C][/ROW]
[ROW][C]31[/C][C]-0.099043[/C][C]-1.4387[/C][C]0.075861[/C][/ROW]
[ROW][C]32[/C][C]-0.024005[/C][C]-0.3487[/C][C]0.363832[/C][/ROW]
[ROW][C]33[/C][C]-0.036159[/C][C]-0.5252[/C][C]0.299984[/C][/ROW]
[ROW][C]34[/C][C]-0.05483[/C][C]-0.7965[/C][C]0.213332[/C][/ROW]
[ROW][C]35[/C][C]-0.068306[/C][C]-0.9922[/C][C]0.161119[/C][/ROW]
[ROW][C]36[/C][C]0.062587[/C][C]0.9091[/C][C]0.182158[/C][/ROW]
[ROW][C]37[/C][C]0.10946[/C][C]1.59[/C][C]0.056667[/C][/ROW]
[ROW][C]38[/C][C]-0.035075[/C][C]-0.5095[/C][C]0.305468[/C][/ROW]
[ROW][C]39[/C][C]-0.103322[/C][C]-1.5008[/C][C]0.067447[/C][/ROW]
[ROW][C]40[/C][C]0.028887[/C][C]0.4196[/C][C]0.337601[/C][/ROW]
[ROW][C]41[/C][C]-0.101078[/C][C]-1.4682[/C][C]0.071764[/C][/ROW]
[ROW][C]42[/C][C]-0.034308[/C][C]-0.4984[/C][C]0.309375[/C][/ROW]
[ROW][C]43[/C][C]0.003451[/C][C]0.0501[/C][C]0.480032[/C][/ROW]
[ROW][C]44[/C][C]-0.130435[/C][C]-1.8947[/C][C]0.029752[/C][/ROW]
[ROW][C]45[/C][C]-0.010261[/C][C]-0.1491[/C][C]0.440826[/C][/ROW]
[ROW][C]46[/C][C]0.06074[/C][C]0.8823[/C][C]0.189309[/C][/ROW]
[ROW][C]47[/C][C]0.043135[/C][C]0.6266[/C][C]0.265811[/C][/ROW]
[ROW][C]48[/C][C]0.078895[/C][C]1.146[/C][C]0.126544[/C][/ROW]
[/TABLE]
Source: https://freestatistics.org/blog/index.php?pk=308959&T=2

Globally Unique Identifier (entire table): ba.freestatistics.org/blog/index.php?pk=308959&T=2

As an alternative you can also use a QR Code:  

The GUIDs for individual cells are displayed in the table below:

Partial Autocorrelation Function
Time lag kPACF(k)T-STATP-value
1-0.460394-6.68760
2-0.512337-7.44210
30.1001241.45440.073663
4-0.031208-0.45330.325393
5-0.325171-4.72342e-06
60.1594322.31590.010762
70.1737112.52330.006182
8-0.106346-1.54480.06195
9-0.061292-0.89030.187154
10-0.110771-1.6090.054551
11-0.315118-4.57744e-06
120.2798114.06453.4e-05
130.0307640.44690.327714
140.0992831.44220.075369
15-0.05522-0.80210.211696
16-0.067491-0.98040.164014
17-0.204124-2.96510.001687
18-0.072317-1.05050.147352
19-0.004069-0.05910.476459
20-0.132067-1.91840.028206
21-0.077159-1.12080.131825
22-0.060031-0.8720.192098
23-0.144496-2.09890.018507
24-0.058587-0.8510.19786
250.1444092.09770.018563
260.0412960.59990.27462
270.0162690.23630.406707
280.0387010.56220.2873
29-0.096584-1.4030.08105
30-0.070864-1.02940.152245
31-0.099043-1.43870.075861
32-0.024005-0.34870.363832
33-0.036159-0.52520.299984
34-0.05483-0.79650.213332
35-0.068306-0.99220.161119
360.0625870.90910.182158
370.109461.590.056667
38-0.035075-0.50950.305468
39-0.103322-1.50080.067447
400.0288870.41960.337601
41-0.101078-1.46820.071764
42-0.034308-0.49840.309375
430.0034510.05010.480032
44-0.130435-1.89470.029752
45-0.010261-0.14910.440826
460.060740.88230.189309
470.0431350.62660.265811
480.0788951.1460.126544


Parameters (Session):
par1 = 48 ; par2 = 1 ; par3 = 1 ; par4 = 0 ; par5 = 12 ; par6 = White Noise ; par7 = 0.95 ;
Parameters (R input):
par1 = 48 ; par2 = 1 ; par3 = 1 ; par4 = 0 ; par5 = 12 ; par6 = White Noise ; par7 = 0.95 ; par8 = ;
R code (references can be found in the software module):
if (par1 == 'Default') {
par1 = 10*log10(length(x))
} else {
par1 <- as.numeric(par1)
}
par2 <- as.numeric(par2)
par3 <- as.numeric(par3)
par4 <- as.numeric(par4)
par5 <- as.numeric(par5)
if (par6 == 'White Noise') par6 <- 'white' else par6 <- 'ma'
par7 <- as.numeric(par7)
if (par8 != '') par8 <- as.numeric(par8)
x <- na.omit(x)
ox <- x
if (par8 == '') {
if (par2 == 0) {
x <- log(x)
} else {
x <- (x ^ par2 - 1) / par2
}
} else {
x <- log(x,base=par8)
}
if (par3 > 0) x <- diff(x,lag=1,difference=par3)
if (par4 > 0) x <- diff(x,lag=par5,difference=par4)
bitmap(file='picts.png')
op <- par(mfrow=c(2,1))
plot(ox,type='l',main='Original Time Series',xlab='time',ylab='value')
if (par8=='') {
mytitle <- paste('Working Time Series (lambda=',par2,', d=',par3,', D=',par4,')',sep='')
mysub <- paste('(lambda=',par2,', d=',par3,', D=',par4,', CI=', par7, ', CI type=',par6,')',sep='')
} else {
mytitle <- paste('Working Time Series (base=',par8,', d=',par3,', D=',par4,')',sep='')
mysub <- paste('(base=',par8,', d=',par3,', D=',par4,', CI=', par7, ', CI type=',par6,')',sep='')
}
plot(x,type='l', main=mytitle,xlab='time',ylab='value')
par(op)
dev.off()
bitmap(file='pic1.png')
racf <- acf(x, par1, main='Autocorrelation', xlab='time lag', ylab='ACF', ci.type=par6, ci=par7, sub=mysub)
dev.off()
bitmap(file='pic2.png')
rpacf <- pacf(x,par1,main='Partial Autocorrelation',xlab='lags',ylab='PACF',sub=mysub)
dev.off()
(myacf <- c(racf$acf))
(mypacf <- c(rpacf$acf))
lengthx <- length(x)
sqrtn <- sqrt(lengthx)
load(file='createtable')
a<-table.start()
a<-table.row.start(a)
a<-table.element(a,'Autocorrelation Function',4,TRUE)
a<-table.row.end(a)
a<-table.row.start(a)
a<-table.element(a,'Time lag k',header=TRUE)
a<-table.element(a,'ACF(k)',header=TRUE)
a<-table.element(a,'T-STAT',header=TRUE)
a<-table.element(a,'P-value',header=TRUE)
a<-table.row.end(a)
for (i in 2:(par1+1)) {
a<-table.row.start(a)
a<-table.element(a,i-1,header=TRUE)
a<-table.element(a,round(myacf[i],6))
mytstat <- myacf[i]*sqrtn
a<-table.element(a,round(mytstat,4))
a<-table.element(a,round(1-pt(abs(mytstat),lengthx),6))
a<-table.row.end(a)
}
a<-table.end(a)
table.save(a,file='mytable.tab')
a<-table.start()
a<-table.row.start(a)
a<-table.element(a,'Partial Autocorrelation Function',4,TRUE)
a<-table.row.end(a)
a<-table.row.start(a)
a<-table.element(a,'Time lag k',header=TRUE)
a<-table.element(a,'PACF(k)',header=TRUE)
a<-table.element(a,'T-STAT',header=TRUE)
a<-table.element(a,'P-value',header=TRUE)
a<-table.row.end(a)
for (i in 1:par1) {
a<-table.row.start(a)
a<-table.element(a,i,header=TRUE)
a<-table.element(a,round(mypacf[i],6))
mytstat <- mypacf[i]*sqrtn
a<-table.element(a,round(mytstat,4))
a<-table.element(a,round(1-pt(abs(mytstat),lengthx),6))
a<-table.row.end(a)
}
a<-table.end(a)
table.save(a,file='mytable1.tab')