Free Statistics

of Irreproducible Research!

Author's title

Author*The author of this computation has been verified*
R Software Modulerwasp_autocorrelation.wasp
Title produced by software(Partial) Autocorrelation Function
Date of computationMon, 11 Dec 2017 13:34:07 +0100
Cite this page as followsStatistical Computations at FreeStatistics.org, Office for Research Development and Education, URL https://freestatistics.org/blog/index.php?v=date/2017/Dec/11/t1512995712fux25be6os2efvg.htm/, Retrieved Wed, 15 May 2024 23:18:54 +0000
Statistical Computations at FreeStatistics.org, Office for Research Development and Education, URL https://freestatistics.org/blog/index.php?pk=308957, Retrieved Wed, 15 May 2024 23:18:54 +0000
QR Codes:

Original text written by user:
IsPrivate?No (this computation is public)
User-defined keywords
Estimated Impact99
Family? (F = Feedback message, R = changed R code, M = changed R Module, P = changed Parameters, D = changed Data)
-       [(Partial) Autocorrelation Function] [] [2017-12-11 12:34:07] [ca643b0c409f93e6a7ce1fd0961340ec] [Current]
Feedback Forum

Post a new message
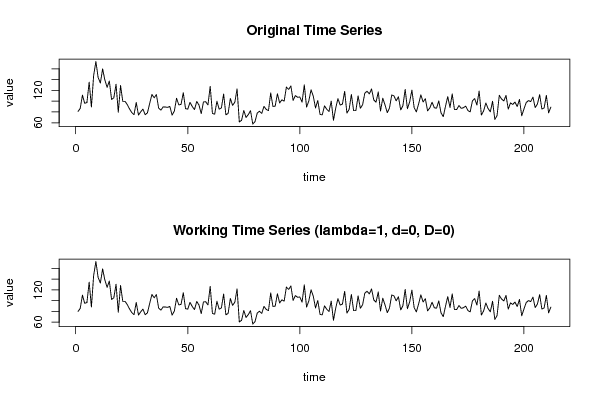
Dataseries X:
80.9
86.5
111.3
96
97.4
135.3
89.2
147.6
173.5
144
133.7
159.9
139.4
125.7
137.4
103.2
106.3
131.4
79.5
129.1
99.6
99.7
93.7
85.7
79.1
74.9
97.7
74.3
80.3
85.3
74.9
78.4
95.8
112.4
106.3
112.3
87.1
83.5
89.3
89.2
88.5
90.3
74.2
81.6
105.5
93.1
94.1
115.7
86.2
85.2
97.9
90.1
84.5
99.5
92.9
76.9
98.6
99
93
127.6
77.2
75.9
99.9
85.3
87.5
113.3
74.8
77.3
105
92.2
98.2
122.8
61.5
64.5
82.8
69.8
75.2
82.4
57.6
62.2
78
81.4
77.3
90.4
84.7
82.5
115.3
90.2
90.8
113.8
96.7
102.6
100
126.2
121.8
128.2
101.5
110.4
107.3
107.7
98.3
130.3
89.1
100.4
121.1
109.3
87.4
101.3
75.6
74.6
91.3
85.1
80.8
100.2
64.5
86.9
104.8
92.9
94.6
118.3
77.9
85
112.5
82.4
82.4
109.9
86.9
93.3
115
118.5
113.5
122.7
102.3
98.2
117.1
81.8
105.5
93.2
78.8
87.2
111.5
109.8
100.7
108.2
83.8
92
121.9
86.1
98.6
120.6
88.2
80.2
94.9
111.8
98.5
104.6
82.1
87.5
98.1
87.8
87
100.5
78.2
71.3
90.9
108.5
88.4
113.4
84.3
84.6
92
86.8
87.8
90.9
82.7
80.2
100.4
105
92.9
118.8
74.3
81.9
96.7
86.3
80.4
100
66.2
73.3
110.9
104.1
100.4
110.7
85.3
96.9
93.9
98.4
90.1
103.2
72.9
85.6
97.4
101.2
99.2
107.6
88.3
94.6
112.2
85.4
87.5
110.8
78.3
89


Summary of computational transaction
Raw Input view raw input (R code)
Raw Outputview raw output of R engine
Computing time2 seconds
R ServerBig Analytics Cloud Computing Center

\begin{tabular}{lllllllll}
\hline
Summary of computational transaction \tabularnewline
Raw Input view raw input (R code)  \tabularnewline
Raw Outputview raw output of R engine  \tabularnewline
Computing time2 seconds \tabularnewline
R ServerBig Analytics Cloud Computing Center \tabularnewline
\hline
\end{tabular}
%Source: https://freestatistics.org/blog/index.php?pk=308957&T=0

[TABLE]
[ROW]
Summary of computational transaction[/C][/ROW] [ROW]Raw Input[/C] view raw input (R code) [/C][/ROW] [ROW]Raw Output[/C]view raw output of R engine [/C][/ROW] [ROW]Computing time[/C]2 seconds[/C][/ROW] [ROW]R Server[/C]Big Analytics Cloud Computing Center[/C][/ROW] [/TABLE] Source: https://freestatistics.org/blog/index.php?pk=308957&T=0

Globally Unique Identifier (entire table): ba.freestatistics.org/blog/index.php?pk=308957&T=0

As an alternative you can also use a QR Code:  

The GUIDs for individual cells are displayed in the table below:

Summary of computational transaction
Raw Input view raw input (R code)
Raw Outputview raw output of R engine
Computing time2 seconds
R ServerBig Analytics Cloud Computing Center


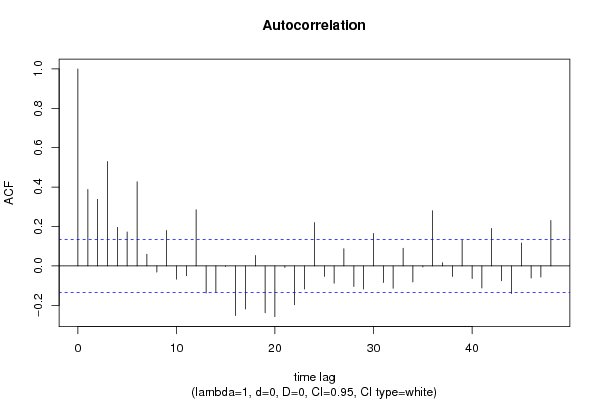
Autocorrelation Function
Time lag kACF(k)T-STATP-value
10.3881435.65140
20.3378484.91911e-06
30.530537.72460
40.1958112.85110.002394
50.17212.50580.006484
60.427446.22360
70.0592230.86230.194747
8-0.031393-0.45710.324039
90.1802732.62480.00465
10-0.067297-0.97990.164137
11-0.049763-0.72460.234759
120.2850644.15062.4e-05
13-0.137712-2.00510.023111
14-0.13215-1.92410.027839
15-0.003276-0.04770.480999
16-0.25202-3.66950.000154
17-0.219072-3.18970.00082
180.0533740.77710.218971
19-0.238073-3.46640.000319
20-0.257568-3.75020.000114
21-0.007611-0.11080.455931
22-0.19748-2.87540.002224
23-0.116946-1.70280.04504
240.2198093.20050.000791
25-0.053305-0.77610.219268
26-0.08746-1.27340.102129
270.0876931.27680.101529
28-0.104931-1.52780.064023
29-0.117205-1.70650.044687
300.1646332.39710.008697
31-0.0844-1.22890.11024
32-0.113032-1.64580.050646
330.0900511.31120.095611
34-0.080968-1.17890.119877
35-0.004978-0.07250.471141
360.2805284.08463.1e-05
370.0159250.23190.408432
38-0.054163-0.78860.215606
390.1298521.89070.030016
40-0.0638-0.92890.176989
41-0.112165-1.63310.051961
420.1898042.76360.00311
43-0.075224-1.09530.137317
44-0.140308-2.04290.021149
450.1167751.70030.045273
46-0.061373-0.89360.186272
47-0.05639-0.82110.206268
480.2302163.3520.000475

\begin{tabular}{lllllllll}
\hline
Autocorrelation Function \tabularnewline
Time lag k & ACF(k) & T-STAT & P-value \tabularnewline
1 & 0.388143 & 5.6514 & 0 \tabularnewline
2 & 0.337848 & 4.9191 & 1e-06 \tabularnewline
3 & 0.53053 & 7.7246 & 0 \tabularnewline
4 & 0.195811 & 2.8511 & 0.002394 \tabularnewline
5 & 0.1721 & 2.5058 & 0.006484 \tabularnewline
6 & 0.42744 & 6.2236 & 0 \tabularnewline
7 & 0.059223 & 0.8623 & 0.194747 \tabularnewline
8 & -0.031393 & -0.4571 & 0.324039 \tabularnewline
9 & 0.180273 & 2.6248 & 0.00465 \tabularnewline
10 & -0.067297 & -0.9799 & 0.164137 \tabularnewline
11 & -0.049763 & -0.7246 & 0.234759 \tabularnewline
12 & 0.285064 & 4.1506 & 2.4e-05 \tabularnewline
13 & -0.137712 & -2.0051 & 0.023111 \tabularnewline
14 & -0.13215 & -1.9241 & 0.027839 \tabularnewline
15 & -0.003276 & -0.0477 & 0.480999 \tabularnewline
16 & -0.25202 & -3.6695 & 0.000154 \tabularnewline
17 & -0.219072 & -3.1897 & 0.00082 \tabularnewline
18 & 0.053374 & 0.7771 & 0.218971 \tabularnewline
19 & -0.238073 & -3.4664 & 0.000319 \tabularnewline
20 & -0.257568 & -3.7502 & 0.000114 \tabularnewline
21 & -0.007611 & -0.1108 & 0.455931 \tabularnewline
22 & -0.19748 & -2.8754 & 0.002224 \tabularnewline
23 & -0.116946 & -1.7028 & 0.04504 \tabularnewline
24 & 0.219809 & 3.2005 & 0.000791 \tabularnewline
25 & -0.053305 & -0.7761 & 0.219268 \tabularnewline
26 & -0.08746 & -1.2734 & 0.102129 \tabularnewline
27 & 0.087693 & 1.2768 & 0.101529 \tabularnewline
28 & -0.104931 & -1.5278 & 0.064023 \tabularnewline
29 & -0.117205 & -1.7065 & 0.044687 \tabularnewline
30 & 0.164633 & 2.3971 & 0.008697 \tabularnewline
31 & -0.0844 & -1.2289 & 0.11024 \tabularnewline
32 & -0.113032 & -1.6458 & 0.050646 \tabularnewline
33 & 0.090051 & 1.3112 & 0.095611 \tabularnewline
34 & -0.080968 & -1.1789 & 0.119877 \tabularnewline
35 & -0.004978 & -0.0725 & 0.471141 \tabularnewline
36 & 0.280528 & 4.0846 & 3.1e-05 \tabularnewline
37 & 0.015925 & 0.2319 & 0.408432 \tabularnewline
38 & -0.054163 & -0.7886 & 0.215606 \tabularnewline
39 & 0.129852 & 1.8907 & 0.030016 \tabularnewline
40 & -0.0638 & -0.9289 & 0.176989 \tabularnewline
41 & -0.112165 & -1.6331 & 0.051961 \tabularnewline
42 & 0.189804 & 2.7636 & 0.00311 \tabularnewline
43 & -0.075224 & -1.0953 & 0.137317 \tabularnewline
44 & -0.140308 & -2.0429 & 0.021149 \tabularnewline
45 & 0.116775 & 1.7003 & 0.045273 \tabularnewline
46 & -0.061373 & -0.8936 & 0.186272 \tabularnewline
47 & -0.05639 & -0.8211 & 0.206268 \tabularnewline
48 & 0.230216 & 3.352 & 0.000475 \tabularnewline
\hline
\end{tabular}
%Source: https://freestatistics.org/blog/index.php?pk=308957&T=1

[TABLE]
[ROW][C]Autocorrelation Function[/C][/ROW]
[ROW][C]Time lag k[/C][C]ACF(k)[/C][C]T-STAT[/C][C]P-value[/C][/ROW]
[ROW][C]1[/C][C]0.388143[/C][C]5.6514[/C][C]0[/C][/ROW]
[ROW][C]2[/C][C]0.337848[/C][C]4.9191[/C][C]1e-06[/C][/ROW]
[ROW][C]3[/C][C]0.53053[/C][C]7.7246[/C][C]0[/C][/ROW]
[ROW][C]4[/C][C]0.195811[/C][C]2.8511[/C][C]0.002394[/C][/ROW]
[ROW][C]5[/C][C]0.1721[/C][C]2.5058[/C][C]0.006484[/C][/ROW]
[ROW][C]6[/C][C]0.42744[/C][C]6.2236[/C][C]0[/C][/ROW]
[ROW][C]7[/C][C]0.059223[/C][C]0.8623[/C][C]0.194747[/C][/ROW]
[ROW][C]8[/C][C]-0.031393[/C][C]-0.4571[/C][C]0.324039[/C][/ROW]
[ROW][C]9[/C][C]0.180273[/C][C]2.6248[/C][C]0.00465[/C][/ROW]
[ROW][C]10[/C][C]-0.067297[/C][C]-0.9799[/C][C]0.164137[/C][/ROW]
[ROW][C]11[/C][C]-0.049763[/C][C]-0.7246[/C][C]0.234759[/C][/ROW]
[ROW][C]12[/C][C]0.285064[/C][C]4.1506[/C][C]2.4e-05[/C][/ROW]
[ROW][C]13[/C][C]-0.137712[/C][C]-2.0051[/C][C]0.023111[/C][/ROW]
[ROW][C]14[/C][C]-0.13215[/C][C]-1.9241[/C][C]0.027839[/C][/ROW]
[ROW][C]15[/C][C]-0.003276[/C][C]-0.0477[/C][C]0.480999[/C][/ROW]
[ROW][C]16[/C][C]-0.25202[/C][C]-3.6695[/C][C]0.000154[/C][/ROW]
[ROW][C]17[/C][C]-0.219072[/C][C]-3.1897[/C][C]0.00082[/C][/ROW]
[ROW][C]18[/C][C]0.053374[/C][C]0.7771[/C][C]0.218971[/C][/ROW]
[ROW][C]19[/C][C]-0.238073[/C][C]-3.4664[/C][C]0.000319[/C][/ROW]
[ROW][C]20[/C][C]-0.257568[/C][C]-3.7502[/C][C]0.000114[/C][/ROW]
[ROW][C]21[/C][C]-0.007611[/C][C]-0.1108[/C][C]0.455931[/C][/ROW]
[ROW][C]22[/C][C]-0.19748[/C][C]-2.8754[/C][C]0.002224[/C][/ROW]
[ROW][C]23[/C][C]-0.116946[/C][C]-1.7028[/C][C]0.04504[/C][/ROW]
[ROW][C]24[/C][C]0.219809[/C][C]3.2005[/C][C]0.000791[/C][/ROW]
[ROW][C]25[/C][C]-0.053305[/C][C]-0.7761[/C][C]0.219268[/C][/ROW]
[ROW][C]26[/C][C]-0.08746[/C][C]-1.2734[/C][C]0.102129[/C][/ROW]
[ROW][C]27[/C][C]0.087693[/C][C]1.2768[/C][C]0.101529[/C][/ROW]
[ROW][C]28[/C][C]-0.104931[/C][C]-1.5278[/C][C]0.064023[/C][/ROW]
[ROW][C]29[/C][C]-0.117205[/C][C]-1.7065[/C][C]0.044687[/C][/ROW]
[ROW][C]30[/C][C]0.164633[/C][C]2.3971[/C][C]0.008697[/C][/ROW]
[ROW][C]31[/C][C]-0.0844[/C][C]-1.2289[/C][C]0.11024[/C][/ROW]
[ROW][C]32[/C][C]-0.113032[/C][C]-1.6458[/C][C]0.050646[/C][/ROW]
[ROW][C]33[/C][C]0.090051[/C][C]1.3112[/C][C]0.095611[/C][/ROW]
[ROW][C]34[/C][C]-0.080968[/C][C]-1.1789[/C][C]0.119877[/C][/ROW]
[ROW][C]35[/C][C]-0.004978[/C][C]-0.0725[/C][C]0.471141[/C][/ROW]
[ROW][C]36[/C][C]0.280528[/C][C]4.0846[/C][C]3.1e-05[/C][/ROW]
[ROW][C]37[/C][C]0.015925[/C][C]0.2319[/C][C]0.408432[/C][/ROW]
[ROW][C]38[/C][C]-0.054163[/C][C]-0.7886[/C][C]0.215606[/C][/ROW]
[ROW][C]39[/C][C]0.129852[/C][C]1.8907[/C][C]0.030016[/C][/ROW]
[ROW][C]40[/C][C]-0.0638[/C][C]-0.9289[/C][C]0.176989[/C][/ROW]
[ROW][C]41[/C][C]-0.112165[/C][C]-1.6331[/C][C]0.051961[/C][/ROW]
[ROW][C]42[/C][C]0.189804[/C][C]2.7636[/C][C]0.00311[/C][/ROW]
[ROW][C]43[/C][C]-0.075224[/C][C]-1.0953[/C][C]0.137317[/C][/ROW]
[ROW][C]44[/C][C]-0.140308[/C][C]-2.0429[/C][C]0.021149[/C][/ROW]
[ROW][C]45[/C][C]0.116775[/C][C]1.7003[/C][C]0.045273[/C][/ROW]
[ROW][C]46[/C][C]-0.061373[/C][C]-0.8936[/C][C]0.186272[/C][/ROW]
[ROW][C]47[/C][C]-0.05639[/C][C]-0.8211[/C][C]0.206268[/C][/ROW]
[ROW][C]48[/C][C]0.230216[/C][C]3.352[/C][C]0.000475[/C][/ROW]
[/TABLE]
Source: https://freestatistics.org/blog/index.php?pk=308957&T=1

Globally Unique Identifier (entire table): ba.freestatistics.org/blog/index.php?pk=308957&T=1

As an alternative you can also use a QR Code:  

The GUIDs for individual cells are displayed in the table below:

Autocorrelation Function
Time lag kACF(k)T-STATP-value
10.3881435.65140
20.3378484.91911e-06
30.530537.72460
40.1958112.85110.002394
50.17212.50580.006484
60.427446.22360
70.0592230.86230.194747
8-0.031393-0.45710.324039
90.1802732.62480.00465
10-0.067297-0.97990.164137
11-0.049763-0.72460.234759
120.2850644.15062.4e-05
13-0.137712-2.00510.023111
14-0.13215-1.92410.027839
15-0.003276-0.04770.480999
16-0.25202-3.66950.000154
17-0.219072-3.18970.00082
180.0533740.77710.218971
19-0.238073-3.46640.000319
20-0.257568-3.75020.000114
21-0.007611-0.11080.455931
22-0.19748-2.87540.002224
23-0.116946-1.70280.04504
240.2198093.20050.000791
25-0.053305-0.77610.219268
26-0.08746-1.27340.102129
270.0876931.27680.101529
28-0.104931-1.52780.064023
29-0.117205-1.70650.044687
300.1646332.39710.008697
31-0.0844-1.22890.11024
32-0.113032-1.64580.050646
330.0900511.31120.095611
34-0.080968-1.17890.119877
35-0.004978-0.07250.471141
360.2805284.08463.1e-05
370.0159250.23190.408432
38-0.054163-0.78860.215606
390.1298521.89070.030016
40-0.0638-0.92890.176989
41-0.112165-1.63310.051961
420.1898042.76360.00311
43-0.075224-1.09530.137317
44-0.140308-2.04290.021149
450.1167751.70030.045273
46-0.061373-0.89360.186272
47-0.05639-0.82110.206268
480.2302163.3520.000475


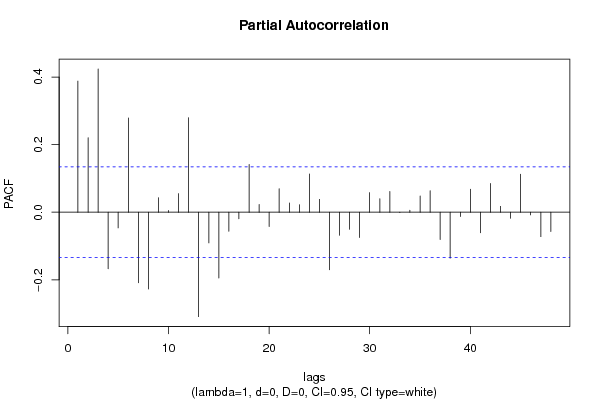
Partial Autocorrelation Function
Time lag kPACF(k)T-STATP-value
10.3881435.65140
20.2203973.2090.000769
30.4241536.17580
4-0.167285-2.43570.007844
5-0.046467-0.67660.24971
60.2789214.06123.4e-05
7-0.208868-3.04120.001327
8-0.227266-3.3090.00055
90.0429480.62530.26621
100.0052470.07640.469585
110.0550180.80110.211993
120.279834.07443.3e-05
13-0.309187-4.50186e-06
14-0.090823-1.32240.09373
15-0.194609-2.83350.002524
16-0.056485-0.82240.205877
17-0.019341-0.28160.389257
180.1411152.05470.020569
190.0231220.33670.368354
20-0.042414-0.61760.268767
210.0693071.00910.157034
220.0275660.40140.344276
230.0222990.32470.372872
240.1130221.64560.050662
250.0381040.55480.289806
26-0.17013-2.47710.007013
27-0.068122-0.99190.161194
28-0.050512-0.73550.231435
29-0.074732-1.08810.138889
300.0580820.84570.199341
310.0396560.57740.282139
320.0615010.89550.185775
33-0.000678-0.00990.496069
340.0059470.08660.465537
350.0479930.69880.242724
360.0634390.92370.178352
37-0.080862-1.17740.120184
38-0.13587-1.97830.024595
39-0.012697-0.18490.426751
400.0679960.990.161642
41-0.060965-0.88770.187863
420.0852751.24160.107873
430.0173240.25220.400552
44-0.018126-0.26390.396047
450.1123351.63560.051702
46-0.007963-0.11590.453904
47-0.072369-1.05370.146608
48-0.057296-0.83420.20254

\begin{tabular}{lllllllll}
\hline
Partial Autocorrelation Function \tabularnewline
Time lag k & PACF(k) & T-STAT & P-value \tabularnewline
1 & 0.388143 & 5.6514 & 0 \tabularnewline
2 & 0.220397 & 3.209 & 0.000769 \tabularnewline
3 & 0.424153 & 6.1758 & 0 \tabularnewline
4 & -0.167285 & -2.4357 & 0.007844 \tabularnewline
5 & -0.046467 & -0.6766 & 0.24971 \tabularnewline
6 & 0.278921 & 4.0612 & 3.4e-05 \tabularnewline
7 & -0.208868 & -3.0412 & 0.001327 \tabularnewline
8 & -0.227266 & -3.309 & 0.00055 \tabularnewline
9 & 0.042948 & 0.6253 & 0.26621 \tabularnewline
10 & 0.005247 & 0.0764 & 0.469585 \tabularnewline
11 & 0.055018 & 0.8011 & 0.211993 \tabularnewline
12 & 0.27983 & 4.0744 & 3.3e-05 \tabularnewline
13 & -0.309187 & -4.5018 & 6e-06 \tabularnewline
14 & -0.090823 & -1.3224 & 0.09373 \tabularnewline
15 & -0.194609 & -2.8335 & 0.002524 \tabularnewline
16 & -0.056485 & -0.8224 & 0.205877 \tabularnewline
17 & -0.019341 & -0.2816 & 0.389257 \tabularnewline
18 & 0.141115 & 2.0547 & 0.020569 \tabularnewline
19 & 0.023122 & 0.3367 & 0.368354 \tabularnewline
20 & -0.042414 & -0.6176 & 0.268767 \tabularnewline
21 & 0.069307 & 1.0091 & 0.157034 \tabularnewline
22 & 0.027566 & 0.4014 & 0.344276 \tabularnewline
23 & 0.022299 & 0.3247 & 0.372872 \tabularnewline
24 & 0.113022 & 1.6456 & 0.050662 \tabularnewline
25 & 0.038104 & 0.5548 & 0.289806 \tabularnewline
26 & -0.17013 & -2.4771 & 0.007013 \tabularnewline
27 & -0.068122 & -0.9919 & 0.161194 \tabularnewline
28 & -0.050512 & -0.7355 & 0.231435 \tabularnewline
29 & -0.074732 & -1.0881 & 0.138889 \tabularnewline
30 & 0.058082 & 0.8457 & 0.199341 \tabularnewline
31 & 0.039656 & 0.5774 & 0.282139 \tabularnewline
32 & 0.061501 & 0.8955 & 0.185775 \tabularnewline
33 & -0.000678 & -0.0099 & 0.496069 \tabularnewline
34 & 0.005947 & 0.0866 & 0.465537 \tabularnewline
35 & 0.047993 & 0.6988 & 0.242724 \tabularnewline
36 & 0.063439 & 0.9237 & 0.178352 \tabularnewline
37 & -0.080862 & -1.1774 & 0.120184 \tabularnewline
38 & -0.13587 & -1.9783 & 0.024595 \tabularnewline
39 & -0.012697 & -0.1849 & 0.426751 \tabularnewline
40 & 0.067996 & 0.99 & 0.161642 \tabularnewline
41 & -0.060965 & -0.8877 & 0.187863 \tabularnewline
42 & 0.085275 & 1.2416 & 0.107873 \tabularnewline
43 & 0.017324 & 0.2522 & 0.400552 \tabularnewline
44 & -0.018126 & -0.2639 & 0.396047 \tabularnewline
45 & 0.112335 & 1.6356 & 0.051702 \tabularnewline
46 & -0.007963 & -0.1159 & 0.453904 \tabularnewline
47 & -0.072369 & -1.0537 & 0.146608 \tabularnewline
48 & -0.057296 & -0.8342 & 0.20254 \tabularnewline
\hline
\end{tabular}
%Source: https://freestatistics.org/blog/index.php?pk=308957&T=2

[TABLE]
[ROW][C]Partial Autocorrelation Function[/C][/ROW]
[ROW][C]Time lag k[/C][C]PACF(k)[/C][C]T-STAT[/C][C]P-value[/C][/ROW]
[ROW][C]1[/C][C]0.388143[/C][C]5.6514[/C][C]0[/C][/ROW]
[ROW][C]2[/C][C]0.220397[/C][C]3.209[/C][C]0.000769[/C][/ROW]
[ROW][C]3[/C][C]0.424153[/C][C]6.1758[/C][C]0[/C][/ROW]
[ROW][C]4[/C][C]-0.167285[/C][C]-2.4357[/C][C]0.007844[/C][/ROW]
[ROW][C]5[/C][C]-0.046467[/C][C]-0.6766[/C][C]0.24971[/C][/ROW]
[ROW][C]6[/C][C]0.278921[/C][C]4.0612[/C][C]3.4e-05[/C][/ROW]
[ROW][C]7[/C][C]-0.208868[/C][C]-3.0412[/C][C]0.001327[/C][/ROW]
[ROW][C]8[/C][C]-0.227266[/C][C]-3.309[/C][C]0.00055[/C][/ROW]
[ROW][C]9[/C][C]0.042948[/C][C]0.6253[/C][C]0.26621[/C][/ROW]
[ROW][C]10[/C][C]0.005247[/C][C]0.0764[/C][C]0.469585[/C][/ROW]
[ROW][C]11[/C][C]0.055018[/C][C]0.8011[/C][C]0.211993[/C][/ROW]
[ROW][C]12[/C][C]0.27983[/C][C]4.0744[/C][C]3.3e-05[/C][/ROW]
[ROW][C]13[/C][C]-0.309187[/C][C]-4.5018[/C][C]6e-06[/C][/ROW]
[ROW][C]14[/C][C]-0.090823[/C][C]-1.3224[/C][C]0.09373[/C][/ROW]
[ROW][C]15[/C][C]-0.194609[/C][C]-2.8335[/C][C]0.002524[/C][/ROW]
[ROW][C]16[/C][C]-0.056485[/C][C]-0.8224[/C][C]0.205877[/C][/ROW]
[ROW][C]17[/C][C]-0.019341[/C][C]-0.2816[/C][C]0.389257[/C][/ROW]
[ROW][C]18[/C][C]0.141115[/C][C]2.0547[/C][C]0.020569[/C][/ROW]
[ROW][C]19[/C][C]0.023122[/C][C]0.3367[/C][C]0.368354[/C][/ROW]
[ROW][C]20[/C][C]-0.042414[/C][C]-0.6176[/C][C]0.268767[/C][/ROW]
[ROW][C]21[/C][C]0.069307[/C][C]1.0091[/C][C]0.157034[/C][/ROW]
[ROW][C]22[/C][C]0.027566[/C][C]0.4014[/C][C]0.344276[/C][/ROW]
[ROW][C]23[/C][C]0.022299[/C][C]0.3247[/C][C]0.372872[/C][/ROW]
[ROW][C]24[/C][C]0.113022[/C][C]1.6456[/C][C]0.050662[/C][/ROW]
[ROW][C]25[/C][C]0.038104[/C][C]0.5548[/C][C]0.289806[/C][/ROW]
[ROW][C]26[/C][C]-0.17013[/C][C]-2.4771[/C][C]0.007013[/C][/ROW]
[ROW][C]27[/C][C]-0.068122[/C][C]-0.9919[/C][C]0.161194[/C][/ROW]
[ROW][C]28[/C][C]-0.050512[/C][C]-0.7355[/C][C]0.231435[/C][/ROW]
[ROW][C]29[/C][C]-0.074732[/C][C]-1.0881[/C][C]0.138889[/C][/ROW]
[ROW][C]30[/C][C]0.058082[/C][C]0.8457[/C][C]0.199341[/C][/ROW]
[ROW][C]31[/C][C]0.039656[/C][C]0.5774[/C][C]0.282139[/C][/ROW]
[ROW][C]32[/C][C]0.061501[/C][C]0.8955[/C][C]0.185775[/C][/ROW]
[ROW][C]33[/C][C]-0.000678[/C][C]-0.0099[/C][C]0.496069[/C][/ROW]
[ROW][C]34[/C][C]0.005947[/C][C]0.0866[/C][C]0.465537[/C][/ROW]
[ROW][C]35[/C][C]0.047993[/C][C]0.6988[/C][C]0.242724[/C][/ROW]
[ROW][C]36[/C][C]0.063439[/C][C]0.9237[/C][C]0.178352[/C][/ROW]
[ROW][C]37[/C][C]-0.080862[/C][C]-1.1774[/C][C]0.120184[/C][/ROW]
[ROW][C]38[/C][C]-0.13587[/C][C]-1.9783[/C][C]0.024595[/C][/ROW]
[ROW][C]39[/C][C]-0.012697[/C][C]-0.1849[/C][C]0.426751[/C][/ROW]
[ROW][C]40[/C][C]0.067996[/C][C]0.99[/C][C]0.161642[/C][/ROW]
[ROW][C]41[/C][C]-0.060965[/C][C]-0.8877[/C][C]0.187863[/C][/ROW]
[ROW][C]42[/C][C]0.085275[/C][C]1.2416[/C][C]0.107873[/C][/ROW]
[ROW][C]43[/C][C]0.017324[/C][C]0.2522[/C][C]0.400552[/C][/ROW]
[ROW][C]44[/C][C]-0.018126[/C][C]-0.2639[/C][C]0.396047[/C][/ROW]
[ROW][C]45[/C][C]0.112335[/C][C]1.6356[/C][C]0.051702[/C][/ROW]
[ROW][C]46[/C][C]-0.007963[/C][C]-0.1159[/C][C]0.453904[/C][/ROW]
[ROW][C]47[/C][C]-0.072369[/C][C]-1.0537[/C][C]0.146608[/C][/ROW]
[ROW][C]48[/C][C]-0.057296[/C][C]-0.8342[/C][C]0.20254[/C][/ROW]
[/TABLE]
Source: https://freestatistics.org/blog/index.php?pk=308957&T=2

Globally Unique Identifier (entire table): ba.freestatistics.org/blog/index.php?pk=308957&T=2

As an alternative you can also use a QR Code:  

The GUIDs for individual cells are displayed in the table below:

Partial Autocorrelation Function
Time lag kPACF(k)T-STATP-value
10.3881435.65140
20.2203973.2090.000769
30.4241536.17580
4-0.167285-2.43570.007844
5-0.046467-0.67660.24971
60.2789214.06123.4e-05
7-0.208868-3.04120.001327
8-0.227266-3.3090.00055
90.0429480.62530.26621
100.0052470.07640.469585
110.0550180.80110.211993
120.279834.07443.3e-05
13-0.309187-4.50186e-06
14-0.090823-1.32240.09373
15-0.194609-2.83350.002524
16-0.056485-0.82240.205877
17-0.019341-0.28160.389257
180.1411152.05470.020569
190.0231220.33670.368354
20-0.042414-0.61760.268767
210.0693071.00910.157034
220.0275660.40140.344276
230.0222990.32470.372872
240.1130221.64560.050662
250.0381040.55480.289806
26-0.17013-2.47710.007013
27-0.068122-0.99190.161194
28-0.050512-0.73550.231435
29-0.074732-1.08810.138889
300.0580820.84570.199341
310.0396560.57740.282139
320.0615010.89550.185775
33-0.000678-0.00990.496069
340.0059470.08660.465537
350.0479930.69880.242724
360.0634390.92370.178352
37-0.080862-1.17740.120184
38-0.13587-1.97830.024595
39-0.012697-0.18490.426751
400.0679960.990.161642
41-0.060965-0.88770.187863
420.0852751.24160.107873
430.0173240.25220.400552
44-0.018126-0.26390.396047
450.1123351.63560.051702
46-0.007963-0.11590.453904
47-0.072369-1.05370.146608
48-0.057296-0.83420.20254


Parameters (Session):
par1 = 48 ; par2 = 1 ; par3 = 0 ; par4 = 0 ; par5 = 12 ; par6 = White Noise ; par7 = 0.95 ;
Parameters (R input):
par1 = 48 ; par2 = 1 ; par3 = 0 ; par4 = 0 ; par5 = 12 ; par6 = White Noise ; par7 = 0.95 ; par8 = ;
R code (references can be found in the software module):
par8 <- ''
par7 <- '0.95'
par6 <- 'White Noise'
par5 <- '12'
par4 <- '0'
par3 <- '0'
par2 <- '1'
par1 <- 'Default'
if (par1 == 'Default') {
par1 = 10*log10(length(x))
} else {
par1 <- as.numeric(par1)
}
par2 <- as.numeric(par2)
par3 <- as.numeric(par3)
par4 <- as.numeric(par4)
par5 <- as.numeric(par5)
if (par6 == 'White Noise') par6 <- 'white' else par6 <- 'ma'
par7 <- as.numeric(par7)
if (par8 != '') par8 <- as.numeric(par8)
x <- na.omit(x)
ox <- x
if (par8 == '') {
if (par2 == 0) {
x <- log(x)
} else {
x <- (x ^ par2 - 1) / par2
}
} else {
x <- log(x,base=par8)
}
if (par3 > 0) x <- diff(x,lag=1,difference=par3)
if (par4 > 0) x <- diff(x,lag=par5,difference=par4)
bitmap(file='picts.png')
op <- par(mfrow=c(2,1))
plot(ox,type='l',main='Original Time Series',xlab='time',ylab='value')
if (par8=='') {
mytitle <- paste('Working Time Series (lambda=',par2,', d=',par3,', D=',par4,')',sep='')
mysub <- paste('(lambda=',par2,', d=',par3,', D=',par4,', CI=', par7, ', CI type=',par6,')',sep='')
} else {
mytitle <- paste('Working Time Series (base=',par8,', d=',par3,', D=',par4,')',sep='')
mysub <- paste('(base=',par8,', d=',par3,', D=',par4,', CI=', par7, ', CI type=',par6,')',sep='')
}
plot(x,type='l', main=mytitle,xlab='time',ylab='value')
par(op)
dev.off()
bitmap(file='pic1.png')
racf <- acf(x, par1, main='Autocorrelation', xlab='time lag', ylab='ACF', ci.type=par6, ci=par7, sub=mysub)
dev.off()
bitmap(file='pic2.png')
rpacf <- pacf(x,par1,main='Partial Autocorrelation',xlab='lags',ylab='PACF',sub=mysub)
dev.off()
(myacf <- c(racf$acf))
(mypacf <- c(rpacf$acf))
lengthx <- length(x)
sqrtn <- sqrt(lengthx)
load(file='createtable')
a<-table.start()
a<-table.row.start(a)
a<-table.element(a,'Autocorrelation Function',4,TRUE)
a<-table.row.end(a)
a<-table.row.start(a)
a<-table.element(a,'Time lag k',header=TRUE)
a<-table.element(a,'ACF(k)',header=TRUE)
a<-table.element(a,'T-STAT',header=TRUE)
a<-table.element(a,'P-value',header=TRUE)
a<-table.row.end(a)
for (i in 2:(par1+1)) {
a<-table.row.start(a)
a<-table.element(a,i-1,header=TRUE)
a<-table.element(a,round(myacf[i],6))
mytstat <- myacf[i]*sqrtn
a<-table.element(a,round(mytstat,4))
a<-table.element(a,round(1-pt(abs(mytstat),lengthx),6))
a<-table.row.end(a)
}
a<-table.end(a)
table.save(a,file='mytable.tab')
a<-table.start()
a<-table.row.start(a)
a<-table.element(a,'Partial Autocorrelation Function',4,TRUE)
a<-table.row.end(a)
a<-table.row.start(a)
a<-table.element(a,'Time lag k',header=TRUE)
a<-table.element(a,'PACF(k)',header=TRUE)
a<-table.element(a,'T-STAT',header=TRUE)
a<-table.element(a,'P-value',header=TRUE)
a<-table.row.end(a)
for (i in 1:par1) {
a<-table.row.start(a)
a<-table.element(a,i,header=TRUE)
a<-table.element(a,round(mypacf[i],6))
mytstat <- mypacf[i]*sqrtn
a<-table.element(a,round(mytstat,4))
a<-table.element(a,round(1-pt(abs(mytstat),lengthx),6))
a<-table.row.end(a)
}
a<-table.end(a)
table.save(a,file='mytable1.tab')