Free Statistics

of Irreproducible Research!

Author's title

Author*The author of this computation has been verified*
R Software Modulerwasp_correlation.wasp
Title produced by softwarePearson Correlation
Date of computationMon, 11 Dec 2017 11:43:33 +0100
Cite this page as followsStatistical Computations at FreeStatistics.org, Office for Research Development and Education, URL https://freestatistics.org/blog/index.php?v=date/2017/Dec/11/t15129894932ufwti0wwgv735l.htm/, Retrieved Wed, 15 May 2024 03:05:31 +0200
Statistical Computations at FreeStatistics.org, Office for Research Development and Education, URL https://freestatistics.org/blog/index.php?pk=, Retrieved Wed, 15 May 2024 03:05:31 +0200
QR Codes:

Original text written by user:realistic and easy to apply
IsPrivate?No (this computation is public)
User-defined keywordsAgricultural Research
Estimated Impact0
Dataseries X:
3
0
5
7
4
3
4
0
5
14
0
0
0
4
7
52
42
47
42
77
7
0
8
36
191
11
32
20
87
66
54
54
74
41
38
41
25
30
29
53
31
63
55
36
Dataseries Y:
5
0
59
24
21
64
58
41
162
32
20
22
16
75
50
116
447
455
447
802
34
22
63
549
1396
603
387
199
495
608
883
344
903
412
908
766
779
904
440
648
360
259
448
255


Summary of computational transaction
Raw Input view raw input (R code)
Raw Outputview raw output of R engine
Computing time4 seconds
R ServerBig Analytics Cloud Computing Center

\begin{tabular}{lllllllll}
\hline
Summary of computational transaction \tabularnewline
Raw Input view raw input (R code)  \tabularnewline
Raw Outputview raw output of R engine  \tabularnewline
Computing time4 seconds \tabularnewline
R ServerBig Analytics Cloud Computing Center \tabularnewline
\hline
\end{tabular}
%Source: https://freestatistics.org/blog/index.php?pk=&T=0

[TABLE]
[ROW]
Summary of computational transaction[/C][/ROW] [ROW]Raw Input[/C] view raw input (R code) [/C][/ROW] [ROW]Raw Output[/C]view raw output of R engine [/C][/ROW] [ROW]Computing time[/C]4 seconds[/C][/ROW] [ROW]R Server[/C]Big Analytics Cloud Computing Center[/C][/ROW] [/TABLE] Source: https://freestatistics.org/blog/index.php?pk=&T=0

Globally Unique Identifier (entire table): ba.freestatistics.org/blog/index.php?pk=&T=0

As an alternative you can also use a QR Code:  

The GUIDs for individual cells are displayed in the table below:

Summary of computational transaction
Raw Input view raw input (R code)
Raw Outputview raw output of R engine
Computing time4 seconds
R ServerBig Analytics Cloud Computing Center


Pearson Product Moment Correlation - Ungrouped Data
StatisticVariable XVariable Y
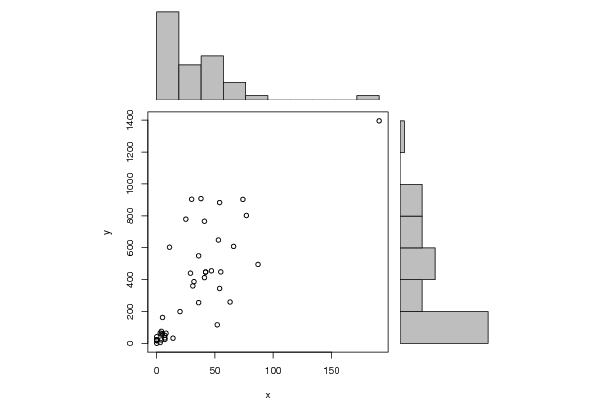
Mean31.7727272727273354.113636363636
Biased Variance1187.76652892562113952.691632231
Biased Standard Deviation34.4639888713657337.568795406553
Covariance9273.77061310782
Correlation0.779012260991803
Determination0.606860102775561
T-Test8.0518444889201
p-value (2 sided)4.73686625778408e-10
p-value (1 sided)2.36843312889204e-10
95% CI of Correlation[0.627182565297194, 0.87380478533475]
Degrees of Freedom42
Number of Observations44

\begin{tabular}{lllllllll}
\hline
Pearson Product Moment Correlation - Ungrouped Data \tabularnewline
Statistic & Variable X & Variable Y \tabularnewline
Mean & 31.7727272727273 & 354.113636363636 \tabularnewline
Biased Variance & 1187.76652892562 & 113952.691632231 \tabularnewline
Biased Standard Deviation & 34.4639888713657 & 337.568795406553 \tabularnewline
Covariance & 9273.77061310782 \tabularnewline
Correlation & 0.779012260991803 \tabularnewline
Determination & 0.606860102775561 \tabularnewline
T-Test & 8.0518444889201 \tabularnewline
p-value (2 sided) & 4.73686625778408e-10 \tabularnewline
p-value (1 sided) & 2.36843312889204e-10 \tabularnewline
95% CI of Correlation & [0.627182565297194, 0.87380478533475] \tabularnewline
Degrees of Freedom & 42 \tabularnewline
Number of Observations & 44 \tabularnewline
\hline
\end{tabular}
%Source: https://freestatistics.org/blog/index.php?pk=&T=1

[TABLE]
[ROW][C]Pearson Product Moment Correlation - Ungrouped Data[/C][/ROW]
[ROW][C]Statistic[/C][C]Variable X[/C][C]Variable Y[/C][/ROW]
[ROW][C]Mean[/C][C]31.7727272727273[/C][C]354.113636363636[/C][/ROW]
[ROW][C]Biased Variance[/C][C]1187.76652892562[/C][C]113952.691632231[/C][/ROW]
[ROW][C]Biased Standard Deviation[/C][C]34.4639888713657[/C][C]337.568795406553[/C][/ROW]
[ROW][C]Covariance[/C][C]9273.77061310782[/C][/ROW]
[ROW][C]Correlation[/C][C]0.779012260991803[/C][/ROW]
[ROW][C]Determination[/C][C]0.606860102775561[/C][/ROW]
[ROW][C]T-Test[/C][C]8.0518444889201[/C][/ROW]
[ROW][C]p-value (2 sided)[/C][C]4.73686625778408e-10[/C][/ROW]
[ROW][C]p-value (1 sided)[/C][C]2.36843312889204e-10[/C][/ROW]
[ROW][C]95% CI of Correlation[/C][C][0.627182565297194, 0.87380478533475][/C][/ROW]
[ROW][C]Degrees of Freedom[/C][C]42[/C][/ROW]
[ROW][C]Number of Observations[/C][C]44[/C][/ROW]
[/TABLE]
Source: https://freestatistics.org/blog/index.php?pk=&T=1

Globally Unique Identifier (entire table): ba.freestatistics.org/blog/index.php?pk=&T=1

As an alternative you can also use a QR Code:  

The GUIDs for individual cells are displayed in the table below:

Pearson Product Moment Correlation - Ungrouped Data
StatisticVariable XVariable Y
Mean31.7727272727273354.113636363636
Biased Variance1187.76652892562113952.691632231
Biased Standard Deviation34.4639888713657337.568795406553
Covariance9273.77061310782
Correlation0.779012260991803
Determination0.606860102775561
T-Test8.0518444889201
p-value (2 sided)4.73686625778408e-10
p-value (1 sided)2.36843312889204e-10
95% CI of Correlation[0.627182565297194, 0.87380478533475]
Degrees of Freedom42
Number of Observations44


Normality Tests
> jarque.x
	Jarque-Bera Normality Test
data:  x
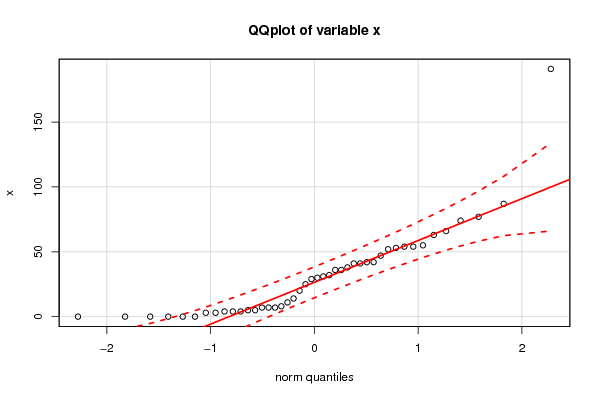
JB = 151.43, p-value < 2.2e-16
alternative hypothesis: greater
> jarque.y
	Jarque-Bera Normality Test
data:  y
JB = 5.8896, p-value = 0.05261
alternative hypothesis: greater
> ad.x
	Anderson-Darling normality test
data:  x
A = 1.8724, p-value = 7.318e-05
> ad.y
	Anderson-Darling normality test
data:  y
A = 1.7233, p-value = 0.0001723

\begin{tabular}{lllllllll}
\hline
Normality Tests \tabularnewline
> jarque.x
	Jarque-Bera Normality Test
data:  x
JB = 151.43, p-value < 2.2e-16
alternative hypothesis: greater
\tabularnewline
> jarque.y
	Jarque-Bera Normality Test
data:  y
JB = 5.8896, p-value = 0.05261
alternative hypothesis: greater
\tabularnewline
> ad.x
	Anderson-Darling normality test
data:  x
A = 1.8724, p-value = 7.318e-05
\tabularnewline
> ad.y
	Anderson-Darling normality test
data:  y
A = 1.7233, p-value = 0.0001723
\tabularnewline \hline \end{tabular} %Source: https://freestatistics.org/blog/index.php?pk=&T=2

[TABLE]
[ROW][C]Normality Tests[/C][/ROW]
[ROW][C]
> jarque.x
	Jarque-Bera Normality Test
data:  x
JB = 151.43, p-value < 2.2e-16
alternative hypothesis: greater
[/C][/ROW] [ROW][C]
> jarque.y
	Jarque-Bera Normality Test
data:  y
JB = 5.8896, p-value = 0.05261
alternative hypothesis: greater
[/C][/ROW] [ROW][C]
> ad.x
	Anderson-Darling normality test
data:  x
A = 1.8724, p-value = 7.318e-05
[/C][/ROW] [ROW][C]
> ad.y
	Anderson-Darling normality test
data:  y
A = 1.7233, p-value = 0.0001723
[/C][/ROW] [/TABLE] Source: https://freestatistics.org/blog/index.php?pk=&T=2

Globally Unique Identifier (entire table): ba.freestatistics.org/blog/index.php?pk=&T=2

As an alternative you can also use a QR Code:  

The GUIDs for individual cells are displayed in the table below:

Normality Tests
> jarque.x
	Jarque-Bera Normality Test
data:  x
JB = 151.43, p-value < 2.2e-16
alternative hypothesis: greater
> jarque.y
	Jarque-Bera Normality Test
data:  y
JB = 5.8896, p-value = 0.05261
alternative hypothesis: greater
> ad.x
	Anderson-Darling normality test
data:  x
A = 1.8724, p-value = 7.318e-05
> ad.y
	Anderson-Darling normality test
data:  y
A = 1.7233, p-value = 0.0001723


Parameters (Session):
Parameters (R input):
R code (references can be found in the software module):
library(psychometric)
x <- x[!is.na(y)]
y <- y[!is.na(y)]
y <- y[!is.na(x)]
x <- x[!is.na(x)]
bitmap(file='test1.png')
histx <- hist(x, plot=FALSE)
histy <- hist(y, plot=FALSE)
maxcounts <- max(c(histx$counts, histx$counts))
xrange <- c(min(x),max(x))
yrange <- c(min(y),max(y))
nf <- layout(matrix(c(2,0,1,3),2,2,byrow=TRUE), c(3,1), c(1,3), TRUE)
par(mar=c(4,4,1,1))
plot(x, y, xlim=xrange, ylim=yrange, xlab=xlab, ylab=ylab, sub=main)
par(mar=c(0,4,1,1))
barplot(histx$counts, axes=FALSE, ylim=c(0, maxcounts), space=0)
par(mar=c(4,0,1,1))
barplot(histy$counts, axes=FALSE, xlim=c(0, maxcounts), space=0, horiz=TRUE)
dev.off()
lx = length(x)
makebiased = (lx-1)/lx
varx = var(x)*makebiased
vary = var(y)*makebiased
corxy <- cor.test(x,y,method='pearson', na.rm = T)
cxy <- as.matrix(corxy$estimate)[1,1]
load(file='createtable')
a<-table.start()
a<-table.row.start(a)
a<-table.element(a,'Pearson Product Moment Correlation - Ungrouped Data',3,TRUE)
a<-table.row.end(a)
a<-table.row.start(a)
a<-table.element(a,'Statistic',1,TRUE)
a<-table.element(a,'Variable X',1,TRUE)
a<-table.element(a,'Variable Y',1,TRUE)
a<-table.row.end(a)
a<-table.row.start(a)
a<-table.element(a,'Mean',header=TRUE)
a<-table.element(a,mean(x))
a<-table.element(a,mean(y))
a<-table.row.end(a)
a<-table.row.start(a)
a<-table.element(a,'Biased Variance',header=TRUE)
a<-table.element(a,varx)
a<-table.element(a,vary)
a<-table.row.end(a)
a<-table.row.start(a)
a<-table.element(a,'Biased Standard Deviation',header=TRUE)
a<-table.element(a,sqrt(varx))
a<-table.element(a,sqrt(vary))
a<-table.row.end(a)
a<-table.row.start(a)
a<-table.element(a,'Covariance',header=TRUE)
a<-table.element(a,cov(x,y),2)
a<-table.row.end(a)
a<-table.row.start(a)
a<-table.element(a,'Correlation',header=TRUE)
a<-table.element(a,cxy,2)
a<-table.row.end(a)
a<-table.row.start(a)
a<-table.element(a,'Determination',header=TRUE)
a<-table.element(a,cxy*cxy,2)
a<-table.row.end(a)
a<-table.row.start(a)
a<-table.element(a,'T-Test',header=TRUE)
a<-table.element(a,as.matrix(corxy$statistic)[1,1],2)
a<-table.row.end(a)
a<-table.row.start(a)
a<-table.element(a,'p-value (2 sided)',header=TRUE)
a<-table.element(a,(p2 <- as.matrix(corxy$p.value)[1,1]),2)
a<-table.row.end(a)
a<-table.row.start(a)
a<-table.element(a,'p-value (1 sided)',header=TRUE)
a<-table.element(a,p2/2,2)
a<-table.row.end(a)
a<-table.row.start(a)
a<-table.element(a,'95% CI of Correlation',header=TRUE)
a<-table.element(a,paste('[',CIr(r=cxy, n = lx, level = .95)[1],', ', CIr(r=cxy, n = lx, level = .95)[2],']',sep=''),2)
a<-table.row.end(a)
a<-table.row.start(a)
a<-table.element(a,'Degrees of Freedom',header=TRUE)
a<-table.element(a,lx-2,2)
a<-table.row.end(a)
a<-table.row.start(a)
a<-table.element(a,'Number of Observations',header=TRUE)
a<-table.element(a,lx,2)
a<-table.row.end(a)
a<-table.end(a)
table.save(a,file='mytable.tab')
library(moments)
library(nortest)
jarque.x <- jarque.test(x)
jarque.y <- jarque.test(y)
if(lx>7) {
ad.x <- ad.test(x)
ad.y <- ad.test(y)
}
a<-table.start()
a<-table.row.start(a)
a<-table.element(a,'Normality Tests',1,TRUE)
a<-table.row.end(a)
a<-table.row.start(a)
a<-table.element(a,paste('
',RC.texteval('jarque.x'),'
',sep=''))
a<-table.row.end(a)
a<-table.row.start(a)
a<-table.element(a,paste('
',RC.texteval('jarque.y'),'
',sep=''))
a<-table.row.end(a)
if(lx>7) {
a<-table.row.start(a)
a<-table.element(a,paste('
',RC.texteval('ad.x'),'
',sep=''))
a<-table.row.end(a)
a<-table.row.start(a)
a<-table.element(a,paste('
',RC.texteval('ad.y'),'
',sep=''))
a<-table.row.end(a)
}
a<-table.end(a)
table.save(a,file='mytable1.tab')
library(car)
bitmap(file='test2.png')
qqPlot(x,main='QQplot of variable x')
dev.off()
bitmap(file='test3.png')
qqPlot(y,main='QQplot of variable y')
dev.off()